r
r
D High-Resolution Conversion of Light
Intensity to Frequency
D Programmable Color and Full-Scale Output
Frequency
D Communicates Directly With a Microcontroller
D Single-Supply Operation (2.7 V to 5.5 V)
D Power Down Feature
D Nonlinearity Error Typically 0.2% at 50 kHz
D Stable 200 ppm/°C Temperature Coefficient
D Low-Profile Lead (Pb) Free and RoHS
Compliant Surface-Mount Package
Description
The TCS3200 and TCS3210 programmable color
light-to-frequency converters that combine confi-
gurable silicon photodiodes and a current-to-fre-
quency converter on a single monolithic CMOS
integrated circuit. The output is a square wave
(50% duty cycle) with frequency directly propor-
tional to light intensity (irradiance).
TCS3200, TCS3210
PROGRAMMABLE
COLOR LIGHT-TO-FREQUENCY CONVERTER
TAOS099 − JULY 2009
PACKAGE D
8-LEAD SOIC
(TOP VIEW)
TCS3200
TCS3210
8 S3
7 S2
6 OUT
5 VDD
8 S3
7 S2
6 OUT
5 VDD
S0 1
S1 2
OE 3
GND 4
S0 1
S1 2
OE 3
GND 4
The full-scale output frequency can be scaled by one of three preset values via two control input pins. Digital
inputs and digital output allow direct interface to a microcontroller or other logic circuitry. Output enable (OE)
places the output in the high-impedance state for multiple-unit sharing of a microcontroller input line.
In the TCS3200, the light-to-frequency converter reads an 8 x 8 array of photodiodes. Sixteen photodiodes have
blue filters, 16 photodiodes have green filters, 16 photodiodes have red filters, and 16 photodiodes are clear
with no filters.
In the TCS3210, the light-to-frequency converter reads a 4 x 6 array of photodiodes. Six photodiodes have blue
filters, 6 photodiodes have green filters, 6 photodiodes have red filters, and 6 photodiodes are clear with no
filters.
The four types (colors) of photodiodes are interdigitated to minimize the effect of non-uniformity of incident
irradiance. All photodiodes of the same color are connected in parallel. Pins S2 and S3 are used to select which
group of photodiodes (red, green, blue, clear) are active. Photodiodes are 110 μm x 110 μm in size and are on
134-μm centers.
Functional Block Diagram
Light
Photodiode
Array
Current-to-Frequency
Converter
Output
S2 S3
S0
S1
OE
The LUMENOLOGY r Company
Texas Advanced Optoelectronic Solutions Inc.
r
Copyright E 2009, TAOS Inc.
1001 Klein Road S Suite 300 S Plano, TX 75074 S (972) 673-0759
r
www.taosinc.com
1
�
TCS3200, TCS3210
PROGRAMMABLE
COLOR LIGHT-TO-FREQUENCY CONVERTER
TAOS099 − JULY 2009
Terminal Functions
TERMINAL
NAME
GND
OE
OUT
S0, S1
S2, S3
VDD
NO.
4
3
6
1, 2
7, 8
5
I/O
I/O
I
O
I
I
DESCRIPTION
DESCRIPTION
Power supply ground. All voltages are referenced to GND.
Enable for fo (active low).
Output frequency (fo).
Output frequency scaling selection inputs.
Photodiode type selection inputs.
Supply voltage
Table 1. Selectable Options
S0
L
L
H
H
S1
L
H
L
H
OUTPUT FREQUENCY SCALING (fo)
Power down
2%
20%
100%
S2
L
L
H
H
S3
L
H
L
H
PHOTODIODE TYPE
Red
Blue
Clear (no filter)
Green
Available Options
DEVICE
TCS3200
TCS3210
TA
−40°C to 85°C
−40°C to 85°C
PACKAGE − LEADS PACKAGE DESIGNATOR ORDERING NUMBER
SOIC−8
SOIC−8
D
D
TCS3200D
TCS3210D
Copyright E 2009, TAOS Inc.
r
The LUMENOLOGY r Company
2
www.taosinc.com
r
�
Absolute Maximum Ratings over operating free-air temperature range (unless otherwise noted)†
TCS3200, TCS3210
PROGRAMMABLE
COLOR LIGHT-TO-FREQUENCY CONVERTER
TAOS099 − JULY 2009
. . . . . . . . . . . . . . . . . . . . . . . . . . . . . . . . . . . . . . . . . . . . . . . . . . . . . . . . . . . . .
. . . . . . . . . . . . . . . . . . . . . . . . . . . . . . . . . . . . . . . . . . . . .
Supply voltage, VDD (see Note 1)
Input voltage range, all inputs, VI
Operating free-air temperature range, TA (see Note 2)
Storage temperature range (see Note 2)
Solder conditions in accordance with JEDEC J−STD−020A, maximum temperature (see Note 3)
6 V
−0.3 V to VDD + 0.3 V
−40°C to 85°C
−40°C to 85°C
260°C
† Stresses beyond those listed under “absolute maximum ratings” may cause permanent damage to the device. These are stress ratings only, and
functional operation of the device at these or any other conditions beyond those indicated under “recommended operating conditions” is not
implied. Exposure to absolute-maximum-rated conditions for extended periods may affect device reliability.
. . . . . . . . . . . . . . . . . . . . . . . . . . . . . . . . .
. . . . . . . . . . . . . . . . . . . . . . . . . . . . . . . . . . . . . . . . . . . . .
. . .
NOTES: 1. All voltage values are with respect to GND.
2. Long-term storage or operation above 70°C could cause package yellowing that will lower the sensitivity to wavelengths < 500nm.
3. The device may be hand soldered provided that heat is applied only to the solder pad and no contact is made between the tip of
the solder iron and the device lead. The maximum time heat should be applied to the device is 5 seconds.
Recommended Operating Conditions
Supply voltage, VDD
High-level input voltage, VIH
Low-level input voltage, VIL
Operating free-air temperature range, TA
VDD = 2.7 V to 5.5 V
VDD = 2.7 V to 5.5 V
5
MIN NOM MAX
5.5
2.7
VDD
2
0.8
0
−40
70
UNIT
V
V
V
°C
Electrical Characteristics at TA = 25°C, VDD = 5 V (unless otherwise noted)
PARAMETER
TEST CONDITIONS
IOH = − 2 mA
IOL = 2 mA
Power-on mode
Power-down mode
S0 = H, S1 = H
S0 = H, S1 = L
S0 = L, S1 = H
λ ≤ 700 nm, −25°C ≤ TA ≤ 70°C
VDD = 5 V ±10%
MIN
4
500
100
10
TYP MAX
4.5
0.25
0.40
5
5
2
0.1
1.4
600
120
12
± 200
±0.5
UNIT
V
V
μA
μA
mA
μA
kHz
kHz
kHz
ppm/°C
%/ V
VOH
VOL
IIH
IIL
I
IDD
High-level output voltage
Low-level output voltage
High-level input current
Low-level input current
Supply current
Supply current
Full-scale frequency (See Note 4)
Full scale frequency (See Note 4)
Temperature coefficient of responsivity
Supply voltage sensitivity
kSVS
NOTE 4: Full-scale frequency is the maximum operating frequency of the device without saturation.
The LUMENOLOGY r Company
r
Copyright E 2009, TAOS Inc.
www.taosinc.com
r
3
�
TCS3200, TCS3210
PROGRAMMABLE
COLOR LIGHT-TO-FREQUENCY CONVERTER
TAOS099 − JULY 2009
Operating Characteristics at VDD = 5 V, TA = 25°C, S0 = H, S1 = H (unless otherwise noted)
(See Notes 5, 6, 7, and 8). Values for TCS3200 (TCS3210) are below.
PARAMETER
TEST
CONDITIONS
CONDITIONS
CLEAR
PHOTODIODE
S2 = H, S3 = L
BLUE
PHOTODIODE
S2 = L, S3 = H
GREEN
PHOTODIODE
S2 = H, S3 = H
RED
PHOTODIODE
S2 = L, S3 = L
UNIT
f
fO
Output
frequency
frequency
(Note 9)
(Note 9)
MIN
12.5
(4.7)
12.5
(4.7)
13.1
(4.9)
Ee = 47.2 μW/cm2,
Ee = 47.2 μW/cm2,
λp = 470 nm
Ee = 40.4 μW/cm2,
Ee = 40.4 μW/cm2,
λp = 524 nm
Ee = 34.6 μW/cm2,
Ee = 34.6 μW/cm2,
λp = 640 nm
λ
λp = 470 nm
470 nm
R
Re
Irradiance
responsivity λ
responsivity
(Note 10)
(Note 10)
λp = 524 nm
524 nm
λ
λp = 640 nm
640 nm
λ
λp = 470 nm
470 nm
λ
λp = 524 nm
524 nm
λ
λp = 640 nm
640 nm
Saturation
irradiance
irradiance
(Note 11)
(Note 11)
fD
Dark
frequency
Ee = 0
fO = 0 to 5 kHz
fO = 0 to 50 kHz
fO = 0 to 500 kHz
Nonlinearity
(Note 12)
(Note 12)
Recovery
from power
down
Response
time to out-
put enable
(OE)
8%
8%
5%
5%
8%
8%
61%
61%
61%
61%
18.7
(7)
18.7
(7)
19.7
(7.4)
TYP MAX MIN
15.6
(5.85)
15.6
(5.85)
16.4
(6.15)
331
(124)
386
(145)
474
(178)
1813
(4839)
1554
(4138)
1266
(3371)
5%
5%
TYP MAX MIN
TYP MAX MIN
TYP MAX
84% 22%
84% 22%
43% 0%
43% 0%
6%
6%
28% 57%
28% 57%
80% 9%
80% 9%
27% kHz
27% kHz
21% 0%
21% 0%
12% 84%
12% 84%
105%
105%
84% 22%
84% 22%
43% 0%
43% 0%
6%
6%
28% 57%
28% 57%
80% 9%
80% 9%
Hz/
27% (μW/
( W/
27%
cm2)
cm2)
21% 0%
21% 0%
12% 84%
12% 84%
105%
105%
−−
−−
−−
−−
−−
−−
−−
−−
−−
μW/
μW/
cm2
2
10
2
10
2
10
2
10
Hz
± 0.1
± 0.2
± 0.5
100
100
± 0.1
± 0.2
± 0.5
100
100
± 0.1
± 0.2
± 0.5
100
100
± 0.1
± 0.2
± 0.5
100
100
% F.S.
% F.S.
μs
ns
NOTES: 5. Optical measurements are made using small-angle incident radiation from a light-emitting diode (LED) optical source.
6. The 470 nm input irradiance is supplied by an InGaN light-emitting diode with the following characteristics:
7. The 524 nm input irradiance is supplied by an InGaN light-emitting diode with the following characteristics:
peak wavelength λp = 470 nm, spectral halfwidth Δλ½ = 35 nm, and luminous efficacy = 75 lm/W.
peak wavelength λp = 524 nm, spectral halfwidth Δλ½ = 47 nm, and luminous efficacy = 520 lm/W.
peak wavelength λp = 640 nm, spectral halfwidth Δλ½ = 17 nm, and luminous efficacy = 155 lm/W.
8. The 640 nm input irradiance is supplied by a AlInGaP light-emitting diode with the following characteristics:
Irradiance responsivity Re is characterized over the range from zero to 5 kHz.
9. Output frequency Blue, Green, Red percentage represents the ratio of the respective color to the Clear channel absolute value.
10.
11. Saturation irradiance = (full-scale frequency)/(irradiance responsivity) for the Clear reference channel.
12. Nonlinearity is defined as the deviation of fO from a straight line between zero and full scale, expressed as a percent of full scale.
Copyright E 2009, TAOS Inc.
r
The LUMENOLOGY r Company
4
www.taosinc.com
r
�
TCS3200, TCS3210
PROGRAMMABLE
COLOR LIGHT-TO-FREQUENCY CONVERTER
TAOS099 − JULY 2009
TYPICAL CHARACTERISTICS
PHOTODIODE SPECTRAL RESPONSIVITY
NORMALIZED OUTPUT FREQUENCY
vs.
ANGULAR DISPLACEMENT
y
t
i
v
i
s
n
o
p
s
e
R
e
v
i
t
a
l
e
R
1
0.9
0.8
0.7
0.6
0.5
0.4
0.3
0.2
0.1
0
300
Normalized to
Clear
@ 715 nm
Clear
Green
Blue
Blue
Red
TA = 25°C
1
0.8
0.6
0.4
0.2
d
e
z
i
l
a
m
r
o
N
—
y
c
n
e
u
q
e
r
F
t
u
p
t
u
O
—
O
f
Green
500
700
λ − Wavelength − nm
900
1100
0
−90
−60
s
i
x
A
l
a
c
i
t
p
O
Angular Displacement is
Equal for Both Aspects
−30
0
Q − Angular Displacement − °
30
60
90
Figure 1
IDD vs.
VDD vs.
TEMPERATURE
Saturated
VDD = 5 V
Saturated
VDD = 3 V
Dark
VDD = 3 V
Dark
VDD = 5 V
25
TA − Free-Air Temperature − °C
50
75
100
Figure 3
1.55
1.5
1.45
1.4
1.35
1.3
1.25
1.2
1.15
1.1
1.05
1
0
A
m
—
D
D
I
Figure 2
NORMALIZED OUTPUT
vs.
VDD
2.5
3
3.5
4
4.5
5
5.5
VDD − V
Figure 4
100.6
100.4
100.2
100
99.8
99.6
99.4
%
—
t
u
p
t
u
O
d
e
z
i
l
a
m
r
o
N
The LUMENOLOGY r Company
r
Copyright E 2009, TAOS Inc.
www.taosinc.com
r
5
�
TCS3200, TCS3210
PROGRAMMABLE
COLOR LIGHT-TO-FREQUENCY CONVERTER
TAOS099 − JULY 2009
TYPICAL CHARACTERISTICS
PHOTODIODE RESPONSIVITY TEMPERATURE COEFFICIENT
WAVELENGTH OF INCIDENT LIGHT
vs.
/
C
g
e
d
m
p
p
—
t
n
e
i
c
i
f
f
e
o
C
e
r
u
t
a
r
e
p
m
e
T
9k
8k
7k
6k
5k
4k
3k
2k
1k
0
600
650
700
750
800
850
900
950 1000
λ − Wavelength of Incident Light − nm
Figure 5
Copyright E 2009, TAOS Inc.
r
The LUMENOLOGY r Company
6
www.taosinc.com
r
�
TCS3200, TCS3210
PROGRAMMABLE
COLOR LIGHT-TO-FREQUENCY CONVERTER
TAOS099 − JULY 2009
APPLICATION INFORMATION
Power supply considerations
Power-supply lines must be decoupled by a 0.01-μF to 0.1-μF capacitor with short leads mounted close to the
device package.
Input interface
A low-impedance electrical connection between the device OE pin and the device GND pin is required for
improved noise immunity. All input pins must be either driven by a logic signal or connected to VDD or GND —
they should not be left unconnected (floating).
Output interface
The output of the device is designed to drive a standard TTL or CMOS logic input over short distances. If lines
greater than 12 inches are used on the output, a buffer or line driver is recommended.
A high state on Output Enable (OE) places the output in a high-impedance state for multiple-unit sharing of a
microcontroller input line.
Power down
Powering down the sensor using S0/S1 (L/L) will cause the output to be held in a high-impedance state. This
is similar to the behavior of the output enable pin, however powering down the sensor saves significantly more
power than disabling the sensor with the output enable pin.
Photodiode type (color) selection
The type of photodiode (blue, green, red, or clear) used by the device is controlled by two logic inputs, S2 and
S3 (see Table 1).
Output frequency scaling
Output-frequency scaling is controlled by two logic inputs, S0 and S1. The internal light-to-frequency converter
generates a fixed-pulsewidth pulse train. Scaling is accomplished by internally connecting the pulse-train output
of the converter to a series of frequency dividers. Divided outputs are 50%-duty cycle square waves with relative
frequency values of 100%, 20%, and 2%. Because division of the output frequency is accomplished by counting
pulses of the principal internal frequency, the final-output period represents an average of the multiple periods
of the principle frequency.
The output-scaling counter registers are cleared upon the next pulse of the principal frequency after any
transition of the S0, S1, S2, S3, and OE lines. The output goes high upon the next subsequent pulse of the
principal frequency, beginning a new valid period. This minimizes the time delay between a change on the input
lines and the resulting new output period. The response time to an input programming change or to an irradiance
step change is one period of new frequency plus 1 μs. The scaled output changes both the full-scale frequency
and the dark frequency by the selected scale factor.
The frequency-scaling function allows the output range to be optimized for a variety of measurement
techniques. The scaled-down outputs may be used where only a slower frequency counter is available, such
as low-cost microcontroller, or where period measurement techniques are used.
The LUMENOLOGY r Company
r
Copyright E 2009, TAOS Inc.
www.taosinc.com
r
7
�
TCS3200, TCS3210
PROGRAMMABLE
COLOR LIGHT-TO-FREQUENCY CONVERTER
TAOS099 − JULY 2009
APPLICATION INFORMATION
Measuring the frequency
The choice of interface and measurement technique depends on the desired resolution and data acquisition
rate. For maximum data-acquisition rate, period-measurement techniques are used.
Output data can be collected at a rate of twice the output frequency or one data point every microsecond for
full-scale output. Period measurement requires the use of a fast reference clock with available resolution directly
related to reference clock rate. Output scaling can be used to increase the resolution for a given clock rate or
to maximize resolution as the light input changes. Period measurement is used to measure rapidly varying light
levels or to make a very fast measurement of a constant light source.
Maximum resolution and accuracy may be obtained using frequency-measurement, pulse-accumulation, or
integration techniques. Frequency measurements provide the added benefit of averaging out random- or
high-frequency variations (jitter) resulting from noise in the light signal. Resolution is limited mainly by available
counter registers and allowable measurement time. Frequency measurement is well suited for slowly varying
or constant light levels and for reading average light levels over short periods of time. Integration (the
accumulation of pulses over a very long period of time) can be used to measure exposure, the amount of light
present in an area over a given time period.
PCB Pad Layout
Suggested PCB pad layout guidelines for the D package are shown in Figure 6.
4.65
6.90
1.27
2.25
0.50
NOTES: A. All linear dimensions are in millimeters.
B. This drawing is subject to change without notice.
Figure 6. Suggested D Package PCB Layout
Copyright E 2009, TAOS Inc.
r
The LUMENOLOGY r Company
8
www.taosinc.com
r
�

.pdf-第1页.jpg")
.pdf-第2页.jpg")
.pdf-第3页.jpg")
.pdf-第4页.jpg")
.pdf-第5页.jpg")
.pdf-第6页.jpg")
.pdf-第7页.jpg")
.pdf-第8页.jpg")
 V2版本原理图(Capacitive-Fingerprint-Reader-Schematic_V2).pdf
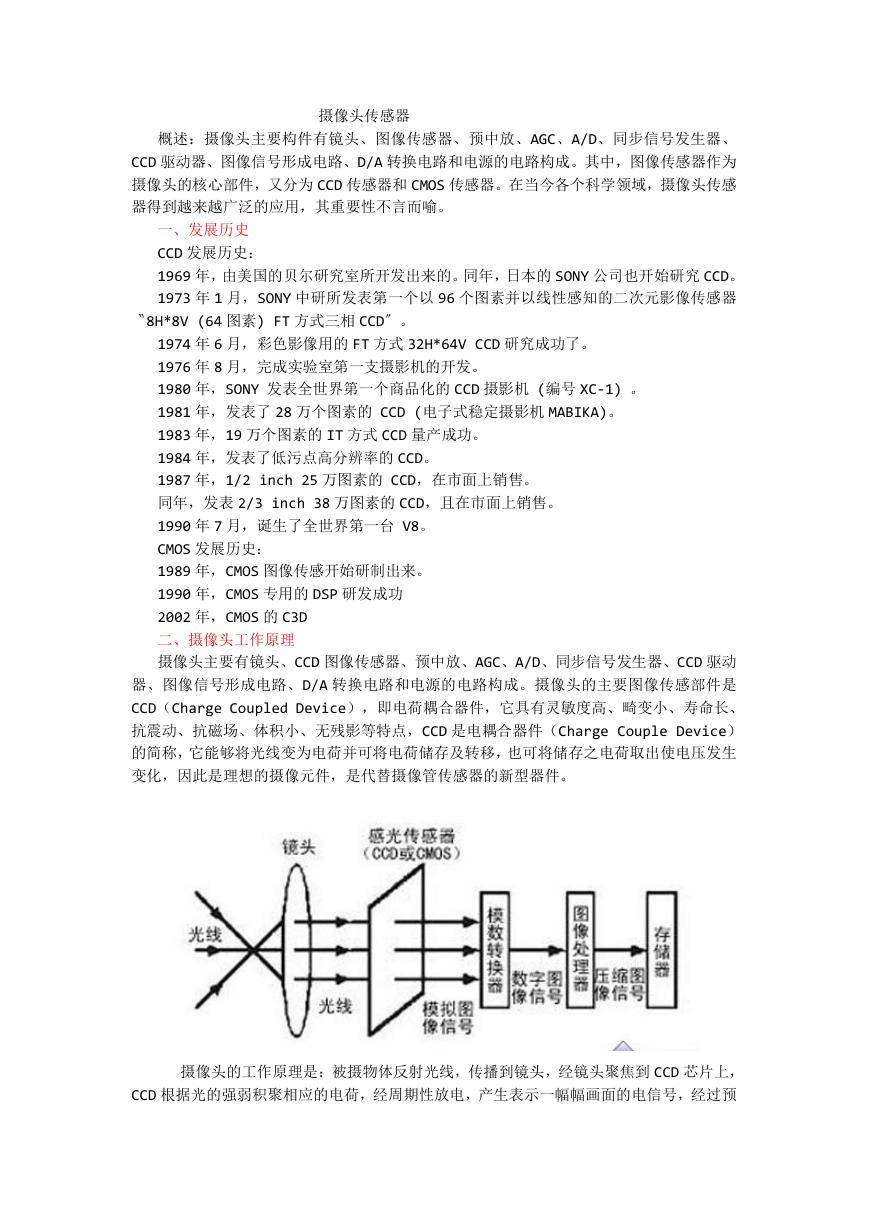 摄像头工作原理.doc
 VL53L0X简要说明(En.FLVL53L00216).pdf
 原理图(DVK720-Schematic).pdf
 原理图(Pico-Clock-Green-Schdoc).pdf
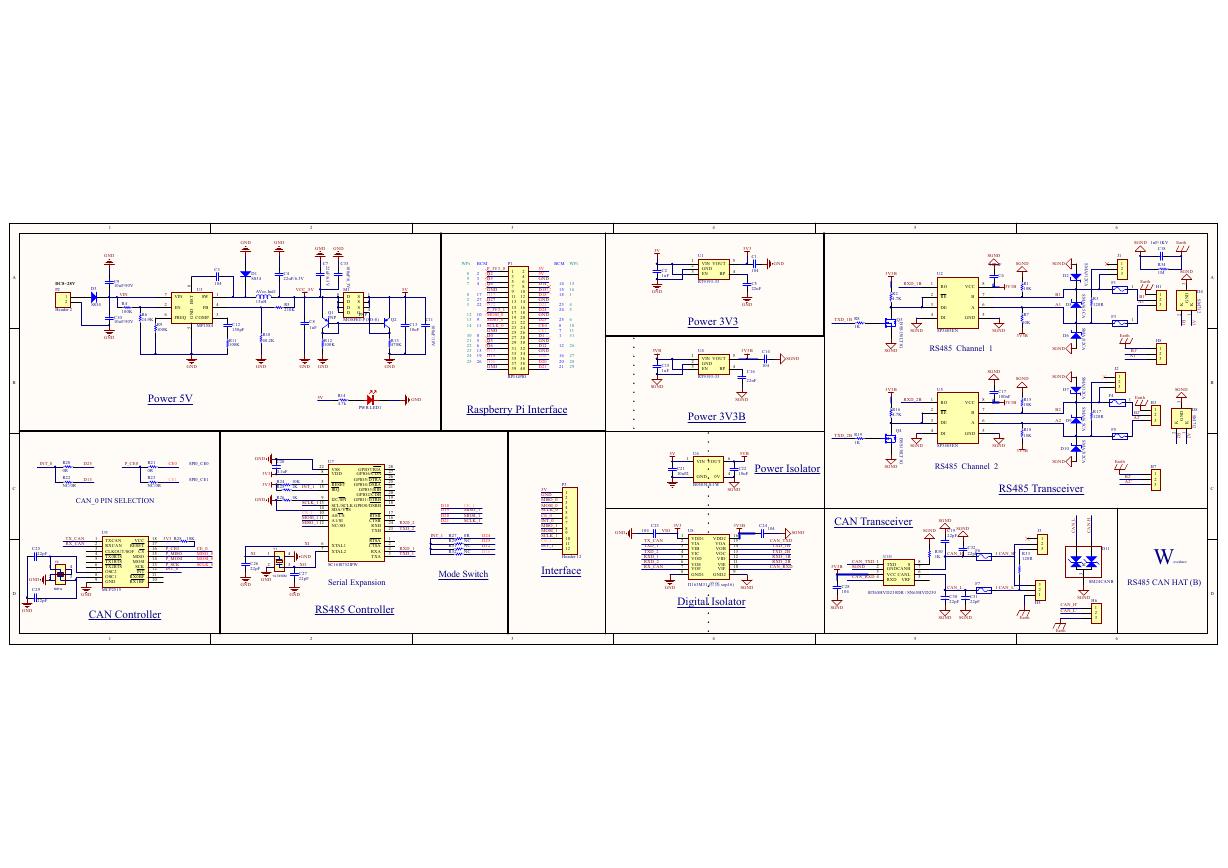 原理图(RS485-CAN-HAT-B-schematic).pdf
 File:SIM7500_SIM7600_SIM7800 Series_SSL_Application Note_V2.00.pdf
 ADS1263(Ads1262).pdf
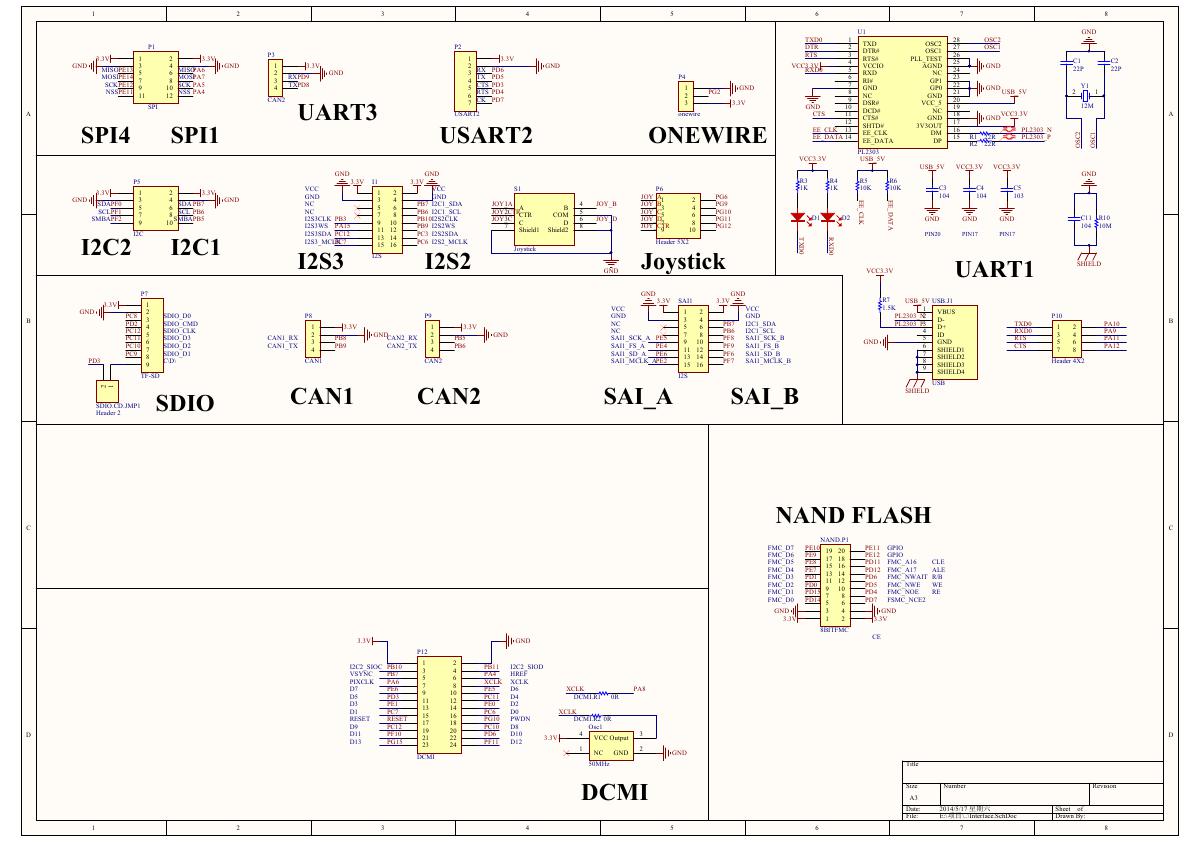 原理图(Open429Z-D-Schematic).pdf
 用户手册(Capacitive_Fingerprint_Reader_User_Manual_CN).pdf
 CY7C68013A(英文版)(CY7C68013A).pdf
 TechnicalReference_Dem.pdf
 23-S4P+与IRC5P的差别-ABB喷涂机器人培训.pdf