Final project of Image Analysis Technology and Applications
Final project of Image Analysis Technology and Applications
1. Introduction
The task of the project is finding the differences of the two images, ignoring butterfly. In addition,
the code should be suitable for all image pairs.
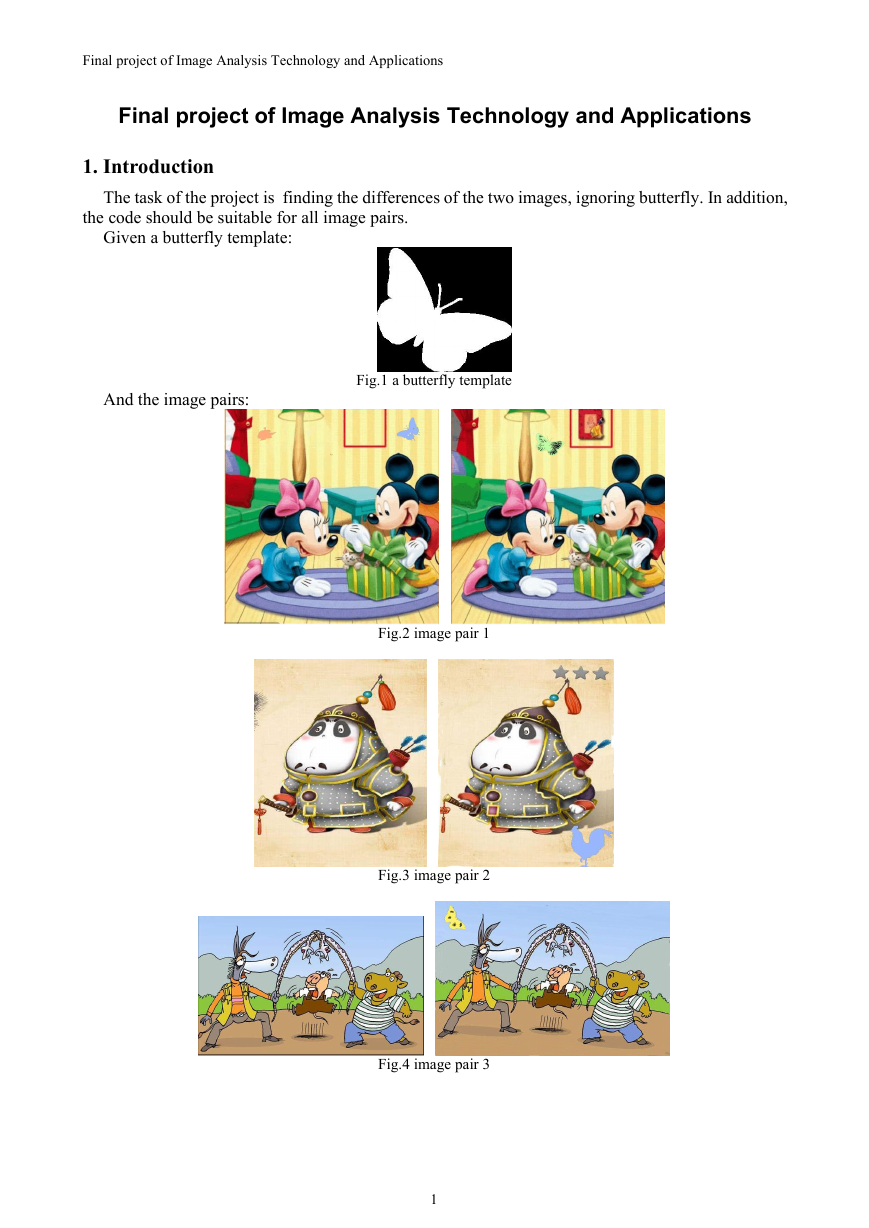
Given a butterfly template:
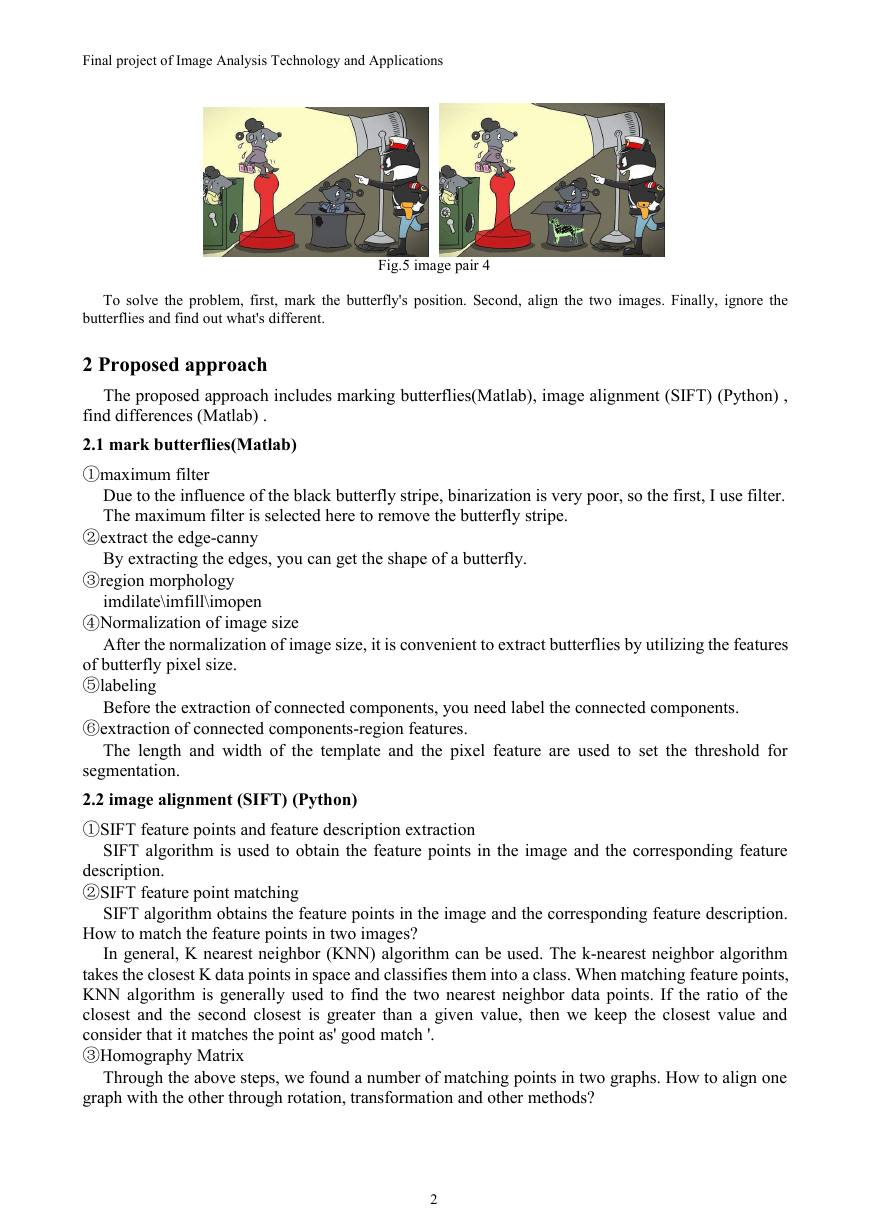
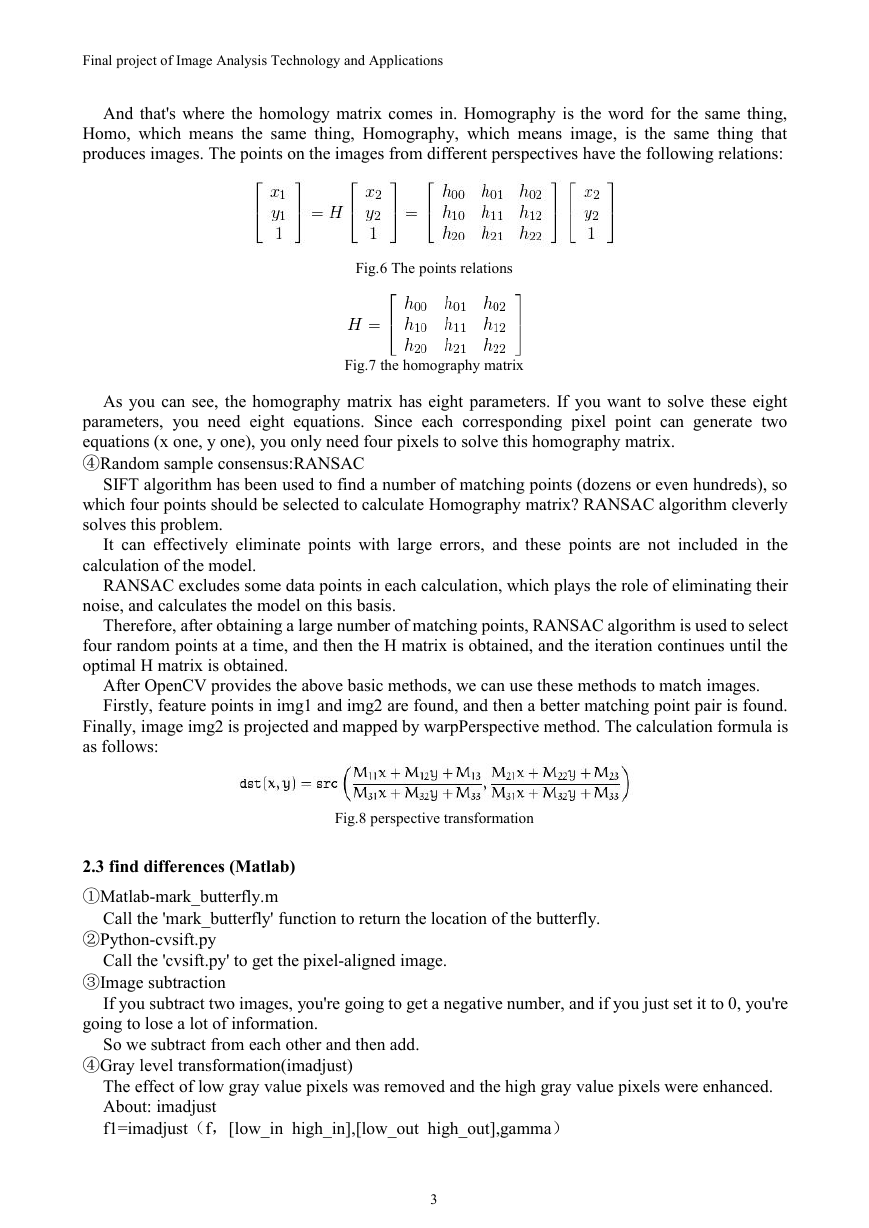
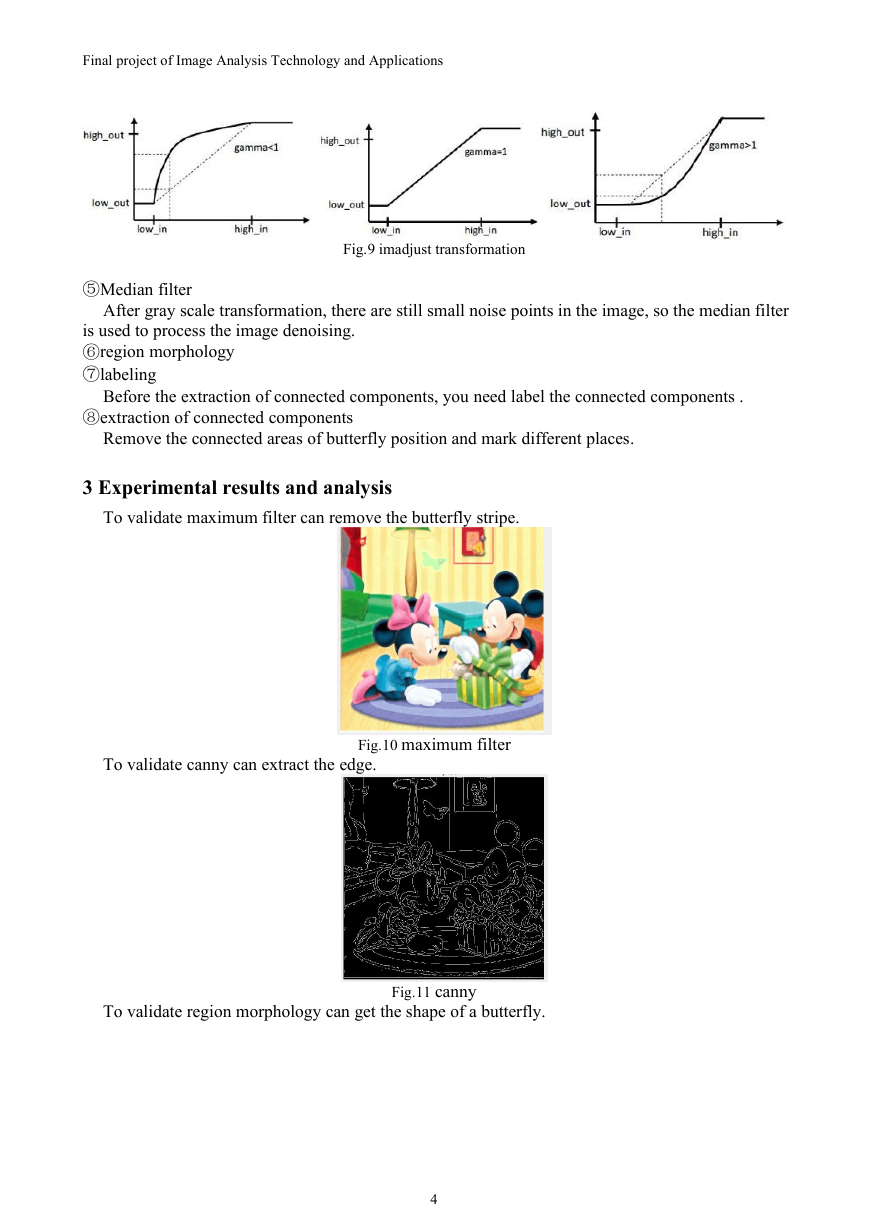
And the image pairs:
Fig.1 a butterfly template
Fig.2 image pair 1
Fig.3 image pair 2
Fig.4 image pair 3
1
�
Final project of Image Analysis Technology and Applications
To solve the problem, first, mark the butterfly's position. Second, align the two images. Finally, ignore the
butterflies and find out what's different.
Fig.5 image pair 4
2 Proposed approach
The proposed approach includes marking butterflies(Matlab), image alignment (SIFT) (Python) ,
Due to the influence of the black butterfly stripe, binarization is very poor, so the first, I use filter.
The maximum filter is selected here to remove the butterfly stripe.
By extracting the edges, you can get the shape of a butterfly.
find differences (Matlab) .
2.1 mark butterflies(Matlab)
①maximum filter
②extract the edge-canny
③region morphology
imdilate\imfill\imopen
④Normalization of image size
of butterfly pixel size.
⑤labeling
After the normalization of image size, it is convenient to extract butterflies by utilizing the features
Before the extraction of connected components, you need label the connected components.
⑥extraction of connected components-region features.
The length and width of the template and the pixel feature are used to set the threshold for
segmentation.
2.2 image alignment (SIFT) (Python)
①SIFT feature points and feature description extraction
description.
②SIFT feature point matching
SIFT algorithm is used to obtain the feature points in the image and the corresponding feature
SIFT algorithm obtains the feature points in the image and the corresponding feature description.
How to match the feature points in two images?
In general, K nearest neighbor (KNN) algorithm can be used. The k-nearest neighbor algorithm
takes the closest K data points in space and classifies them into a class. When matching feature points,
KNN algorithm is generally used to find the two nearest neighbor data points. If the ratio of the
closest and the second closest is greater than a given value, then we keep the closest value and
consider that it matches the point as' good match '.
③Homography Matrix
Through the above steps, we found a number of matching points in two graphs. How to align one
graph with the other through rotation, transformation and other methods?
2
�
Final project of Image Analysis Technology and Applications
And that's where the homology matrix comes in. Homography is the word for the same thing,
Homo, which means the same thing, Homography, which means image, is the same thing that
produces images. The points on the images from different perspectives have the following relations:
Fig.6 The points relations
Fig.7 the homography matrix
As you can see, the homography matrix has eight parameters. If you want to solve these eight
parameters, you need eight equations. Since each corresponding pixel point can generate two
equations (x one, y one), you only need four pixels to solve this homography matrix.
④Random sample consensus:RANSAC
SIFT algorithm has been used to find a number of matching points (dozens or even hundreds), so
which four points should be selected to calculate Homography matrix? RANSAC algorithm cleverly
solves this problem.
It can effectively eliminate points with large errors, and these points are not included in the
calculation of the model.
RANSAC excludes some data points in each calculation, which plays the role of eliminating their
noise, and calculates the model on this basis.
Therefore, after obtaining a large number of matching points, RANSAC algorithm is used to select
four random points at a time, and then the H matrix is obtained, and the iteration continues until the
optimal H matrix is obtained.
After OpenCV provides the above basic methods, we can use these methods to match images.
Firstly, feature points in img1 and img2 are found, and then a better matching point pair is found.
Finally, image img2 is projected and mapped by warpPerspective method. The calculation formula is
as follows:
Fig.8 perspective transformation
Call the 'mark_butterfly' function to return the location of the butterfly.
2.3 find differences (Matlab)
①Matlab-mark_butterfly.m
②Python-cvsift.py
③Image subtraction
Call the 'cvsift.py' to get the pixel-aligned image.
going to lose a lot of information.
So we subtract from each other and then add.
④Gray level transformation(imadjust)
If you subtract two images, you're going to get a negative number, and if you just set it to 0, you're
The effect of low gray value pixels was removed and the high gray value pixels were enhanced.
About: imadjust
f1=imadjust(f,[low_in high_in],[low_out high_out],gamma)
3
�
Final project of Image Analysis Technology and Applications
Fig.9 imadjust transformation
⑤Median filter
After gray scale transformation, there are still small noise points in the image, so the median filter
Before the extraction of connected components, you need label the connected components .
Remove the connected areas of butterfly position and mark different places.
is used to process the image denoising.
⑥region morphology
⑦labeling
⑧extraction of connected components
3 Experimental results and analysis
To validate maximum filter can remove the butterfly stripe.
To validate canny can extract the edge.
Fig.10 maximum filter
To validate region morphology can get the shape of a butterfly.
Fig.11 canny
4
�
Final project of Image Analysis Technology and Applications
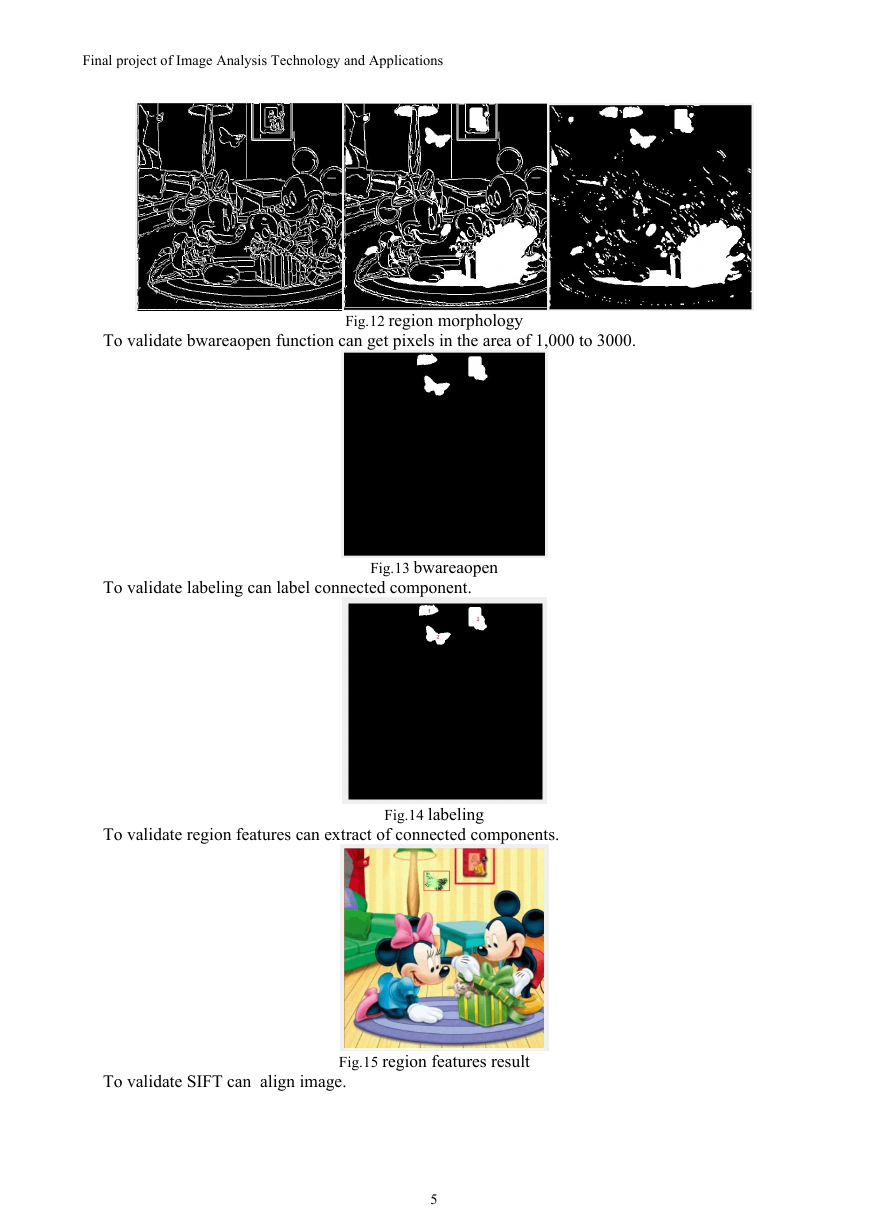
To validate bwareaopen function can get pixels in the area of 1,000 to 3000.
Fig.12 region morphology
To validate labeling can label connected component.
Fig.13 bwareaopen
To validate region features can extract of connected components.
Fig.14 labeling
To validate SIFT can align image.
Fig.15 region features result
5
�
Final project of Image Analysis Technology and Applications
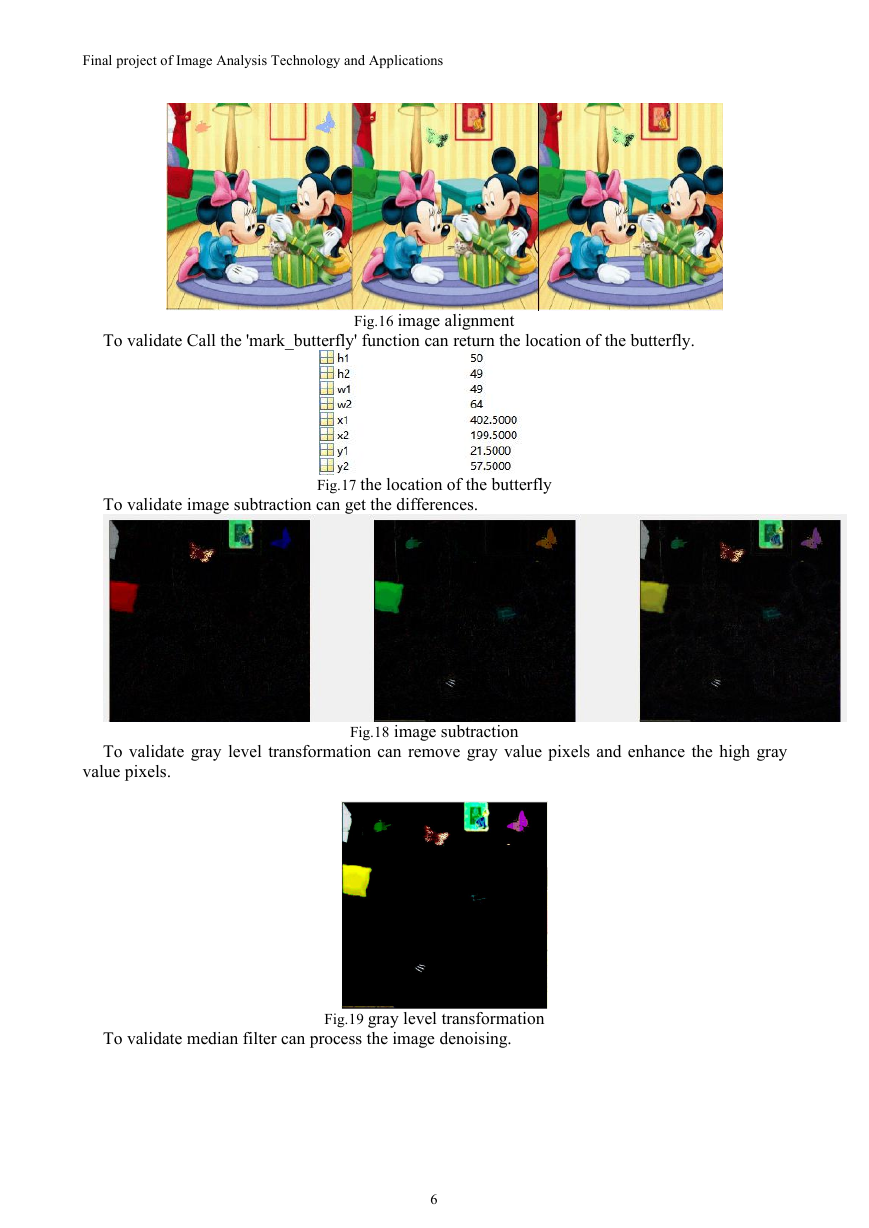
To validate Call the 'mark_butterfly' function can return the location of the butterfly.
Fig.16 image alignment
To validate image subtraction can get the differences.
Fig.17 the location of the butterfly
To validate gray level transformation can remove gray value pixels and enhance the high gray
Fig.18 image subtraction
value pixels.
To validate median filter can process the image denoising.
Fig.19 gray level transformation
6
�
Final project of Image Analysis Technology and Applications
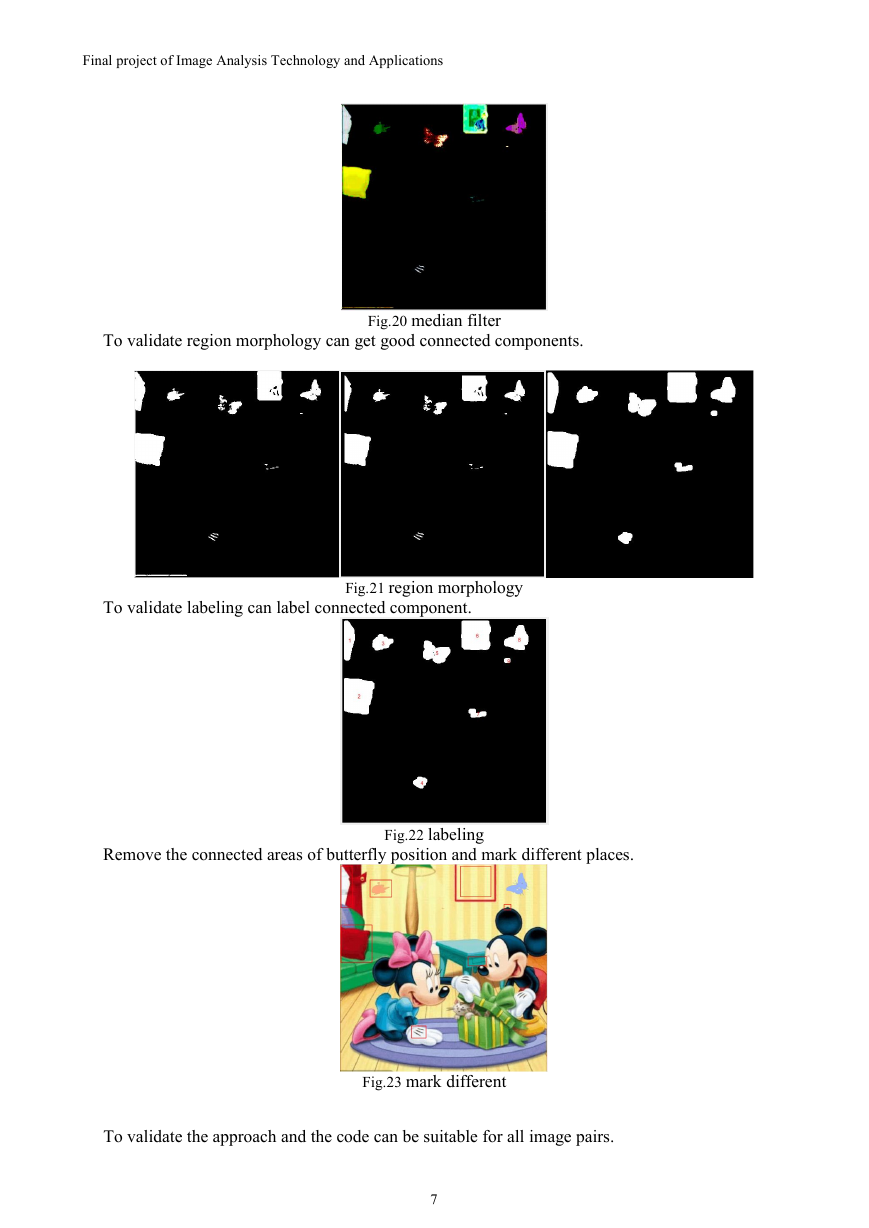
To validate region morphology can get good connected components.
Fig.20 median filter
To validate labeling can label connected component.
Fig.21 region morphology
Remove the connected areas of butterfly position and mark different places.
Fig.22 labeling
Fig.23 mark different
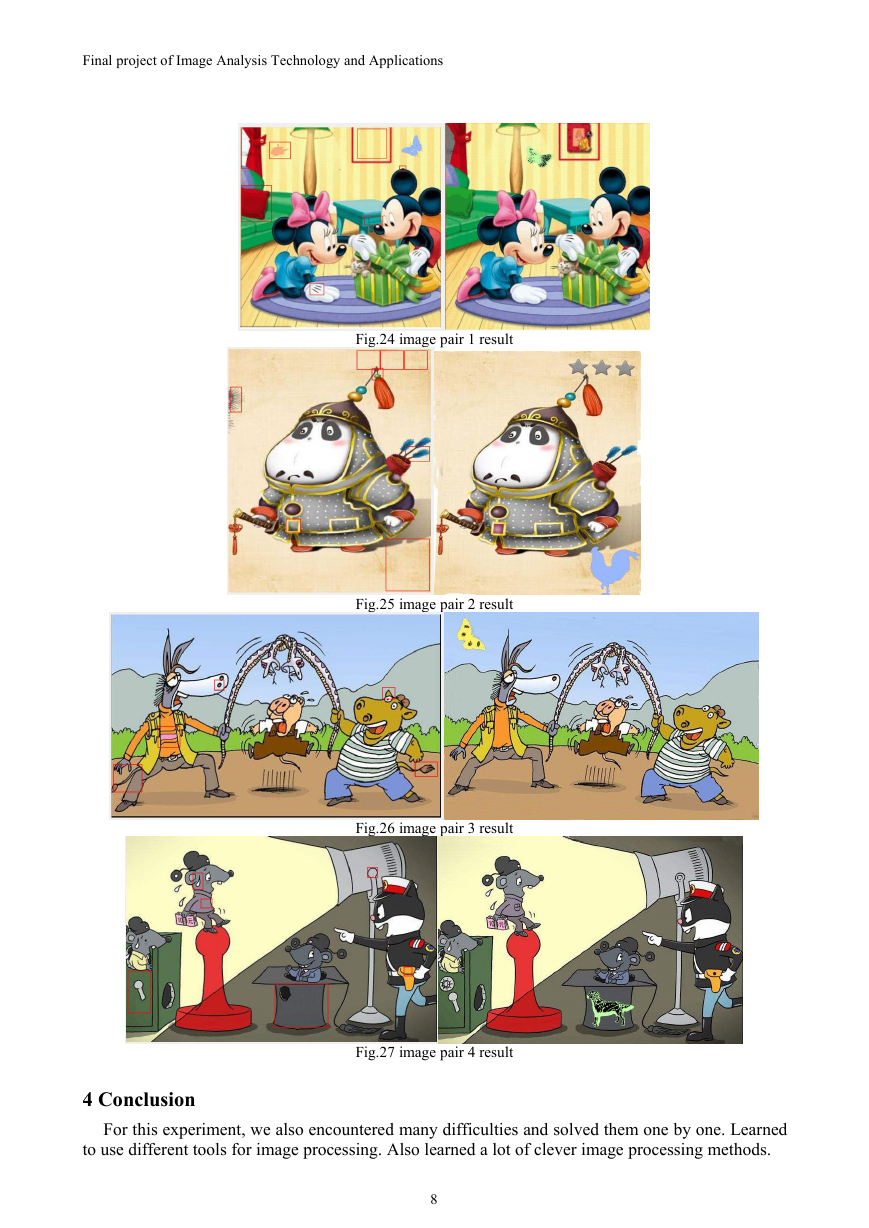
To validate the approach and the code can be suitable for all image pairs.
7
�
Final project of Image Analysis Technology and Applications
Fig.24 image pair 1 result
Fig.25 image pair 2 result
Fig.26 image pair 3 result
Fig.27 image pair 4 result
4 Conclusion
For this experiment, we also encountered many difficulties and solved them one by one. Learned
to use different tools for image processing. Also learned a lot of clever image processing methods.
8
�


 2023年江西萍乡中考道德与法治真题及答案.doc
 2012年重庆南川中考生物真题及答案.doc
 2013年江西师范大学地理学综合及文艺理论基础考研真题.doc
 2020年四川甘孜小升初语文真题及答案I卷.doc
 2020年注册岩土工程师专业基础考试真题及答案.doc
 2023-2024学年福建省厦门市九年级上学期数学月考试题及答案.doc
 2021-2022学年辽宁省沈阳市大东区九年级上学期语文期末试题及答案.doc
 2022-2023学年北京东城区初三第一学期物理期末试卷及答案.doc
 2018上半年江西教师资格初中地理学科知识与教学能力真题及答案.doc
 2012年河北国家公务员申论考试真题及答案-省级.doc
 2020-2021学年江苏省扬州市江都区邵樊片九年级上学期数学第一次质量检测试题及答案.doc
 2022下半年黑龙江教师资格证中学综合素质真题及答案.doc