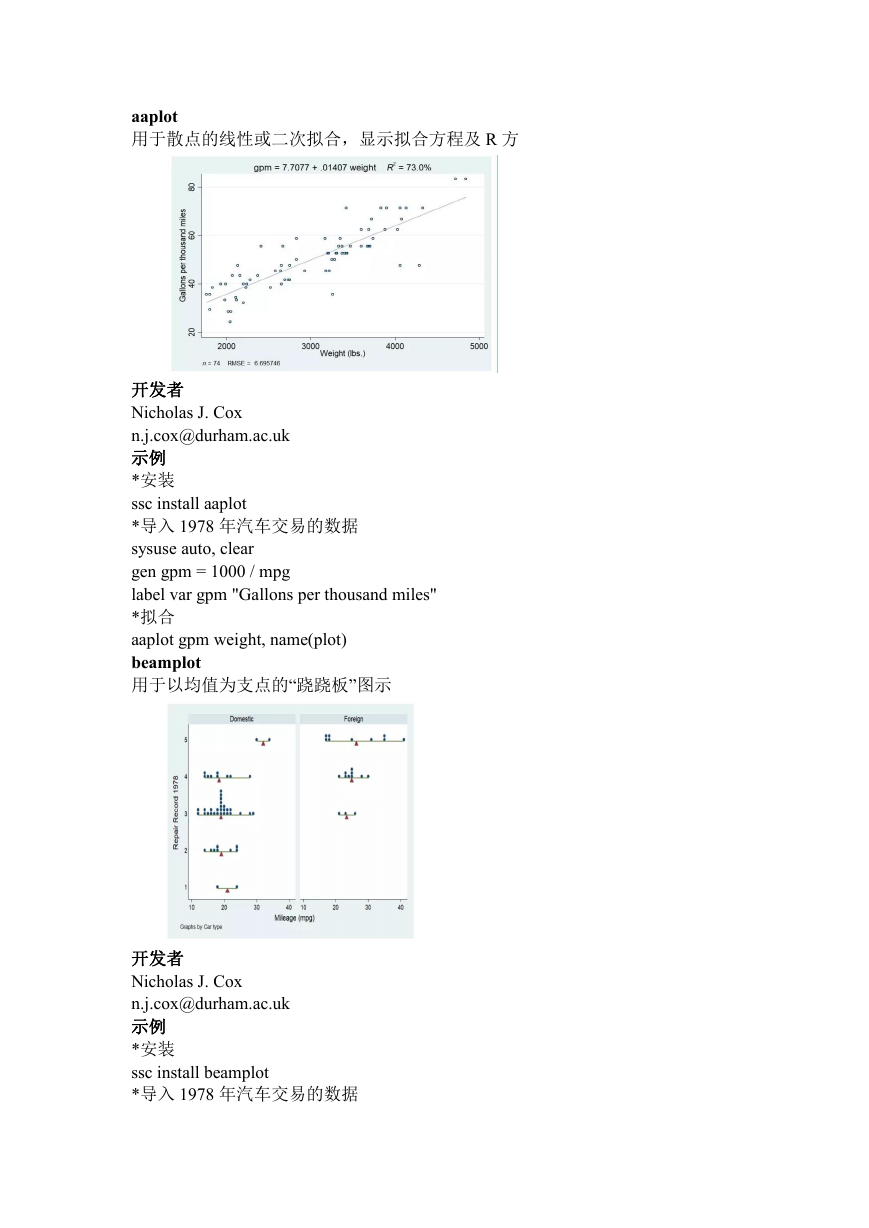
aaplot
用于散点的线性或二次拟合,显示拟合方程及 R 方
开发者
Nicholas J. Cox
n.j.cox@durham.ac.uk
示例
*安装
ssc install aaplot
*导入 1978 年汽车交易的数据
sysuse auto, clear
gen gpm = 1000 / mpg
label var gpm "Gallons per thousand miles"
*拟合
aaplot gpm weight, name(plot)
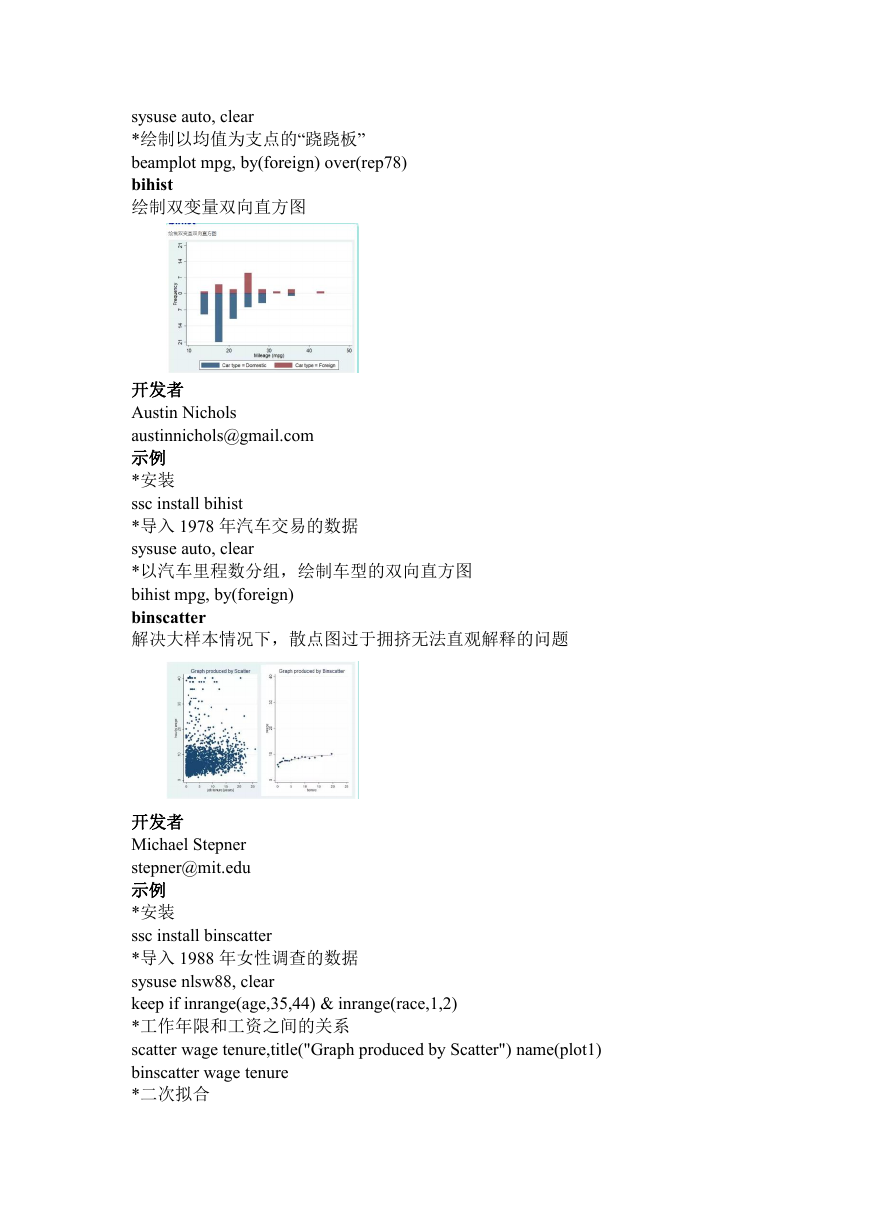
beamplot
用于以均值为支点的“跷跷板”图示
开发者
Nicholas J. Cox
n.j.cox@durham.ac.uk
示例
*安装
ssc install beamplot
*导入 1978 年汽车交易的数据
�
sysuse auto, clear
*绘制以均值为支点的“跷跷板”
beamplot mpg, by(foreign) over(rep78)
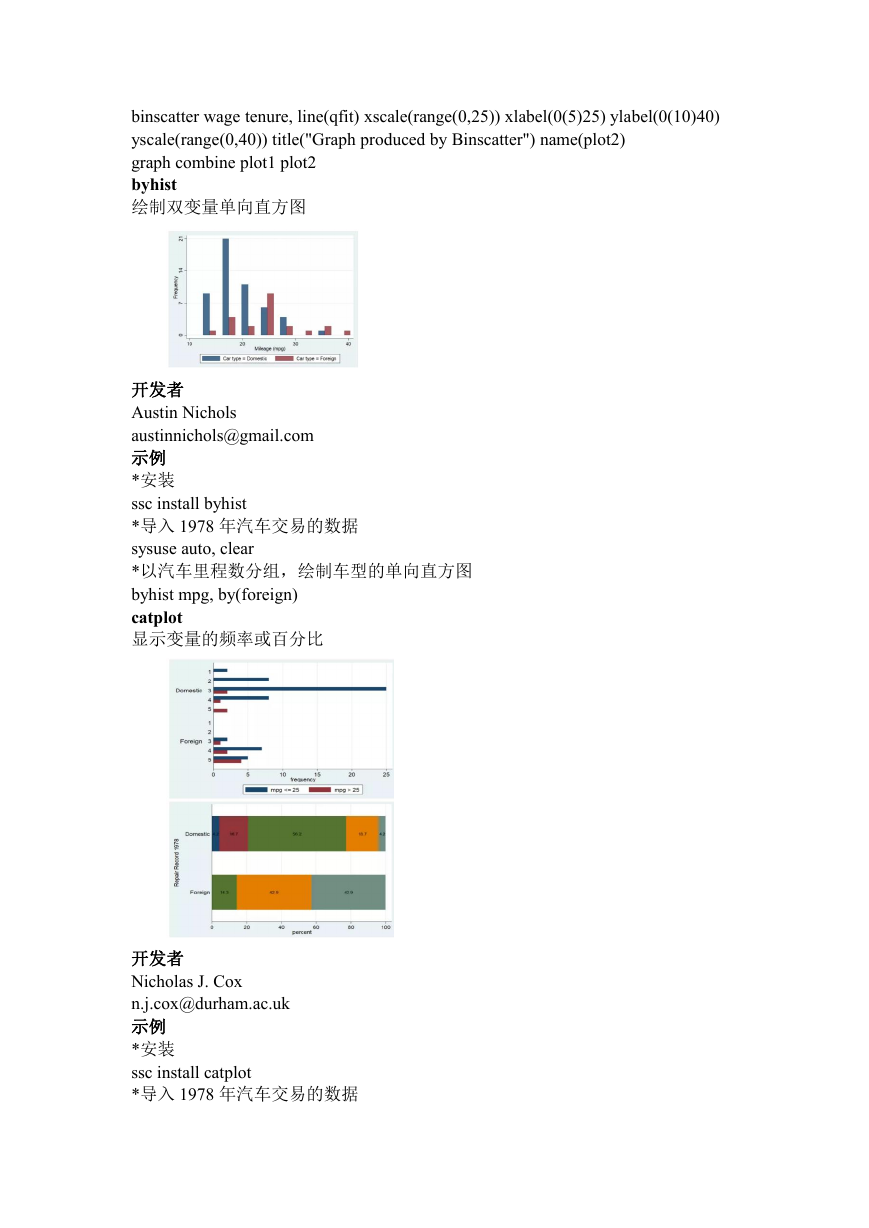
bihist
绘制双变量双向直方图
开发者
Austin Nichols
austinnichols@gmail.com
示例
*安装
ssc install bihist
*导入 1978 年汽车交易的数据
sysuse auto, clear
*以汽车里程数分组,绘制车型的双向直方图
bihist mpg, by(foreign)
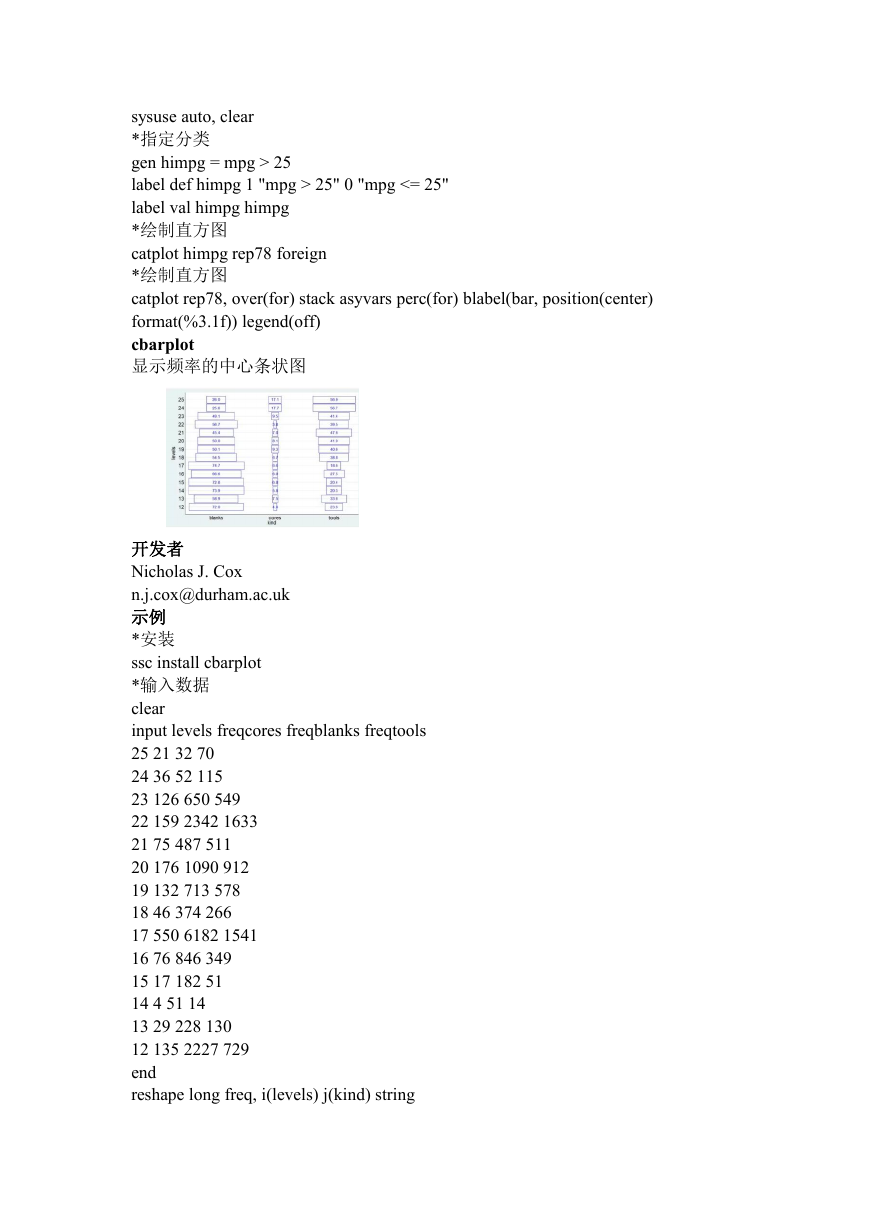
binscatter
解决大样本情况下,散点图过于拥挤无法直观解释的问题
开发者
Michael Stepner
stepner@mit.edu
示例
*安装
ssc install binscatter
*导入 1988 年女性调查的数据
sysuse nlsw88, clear
keep if inrange(age,35,44) & inrange(race,1,2)
*工作年限和工资之间的关系
scatter wage tenure,title("Graph produced by Scatter") name(plot1)
binscatter wage tenure
*二次拟合
�
binscatter wage tenure, line(qfit) xscale(range(0,25)) xlabel(0(5)25) ylabel(0(10)40)
yscale(range(0,40)) title("Graph produced by Binscatter") name(plot2)
graph combine plot1 plot2
byhist
绘制双变量单向直方图
开发者
Austin Nichols
austinnichols@gmail.com
示例
*安装
ssc install byhist
*导入 1978 年汽车交易的数据
sysuse auto, clear
*以汽车里程数分组,绘制车型的单向直方图
byhist mpg, by(foreign)
catplot
显示变量的频率或百分比
开发者
Nicholas J. Cox
n.j.cox@durham.ac.uk
示例
*安装
ssc install catplot
*导入 1978 年汽车交易的数据
�
sysuse auto, clear
*指定分类
gen himpg = mpg > 25
label def himpg 1 "mpg > 25" 0 "mpg <= 25"
label val himpg himpg
*绘制直方图
catplot himpg rep78 foreign
*绘制直方图
catplot rep78, over(for) stack asyvars perc(for) blabel(bar, position(center)
format(%3.1f)) legend(off)
cbarplot
显示频率的中心条状图
开发者
Nicholas J. Cox
n.j.cox@durham.ac.uk
示例
*安装
ssc install cbarplot
*输入数据
clear
input levels freqcores freqblanks freqtools
25 21 32 70
24 36 52 115
23 126 650 549
22 159 2342 1633
21 75 487 511
20 176 1090 912
19 132 713 578
18 46 374 266
17 550 6182 1541
16 76 846 349
15 17 182 51
14 4 51 14
13 29 228 130
12 135 2227 729
end
reshape long freq, i(levels) j(kind) string
�
*以百分比形式显示频率
cbarplot levels kind [fw=freq], percent(levels)
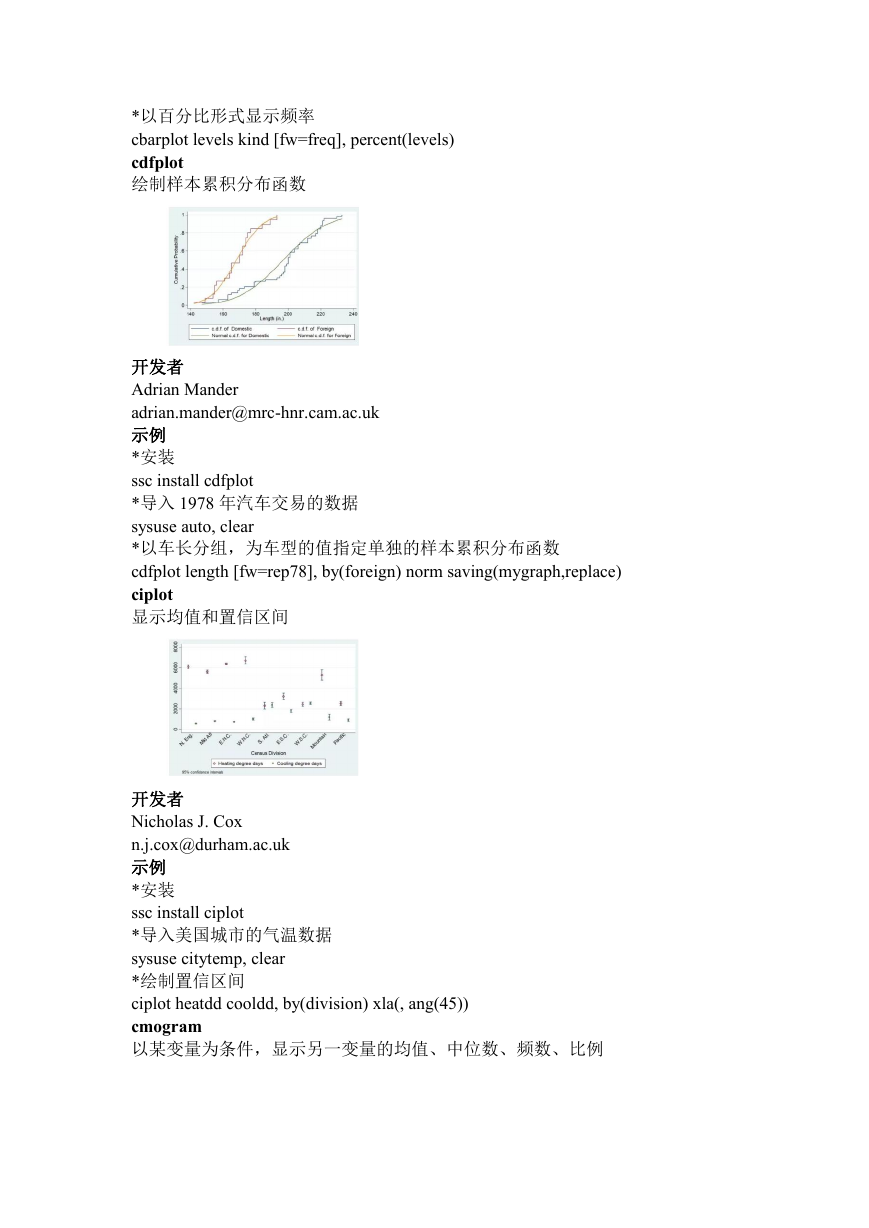
cdfplot
绘制样本累积分布函数
开发者
Adrian Mander
adrian.mander@mrc-hnr.cam.ac.uk
示例
*安装
ssc install cdfplot
*导入 1978 年汽车交易的数据
sysuse auto, clear
*以车长分组,为车型的值指定单独的样本累积分布函数
cdfplot length [fw=rep78], by(foreign) norm saving(mygraph,replace)
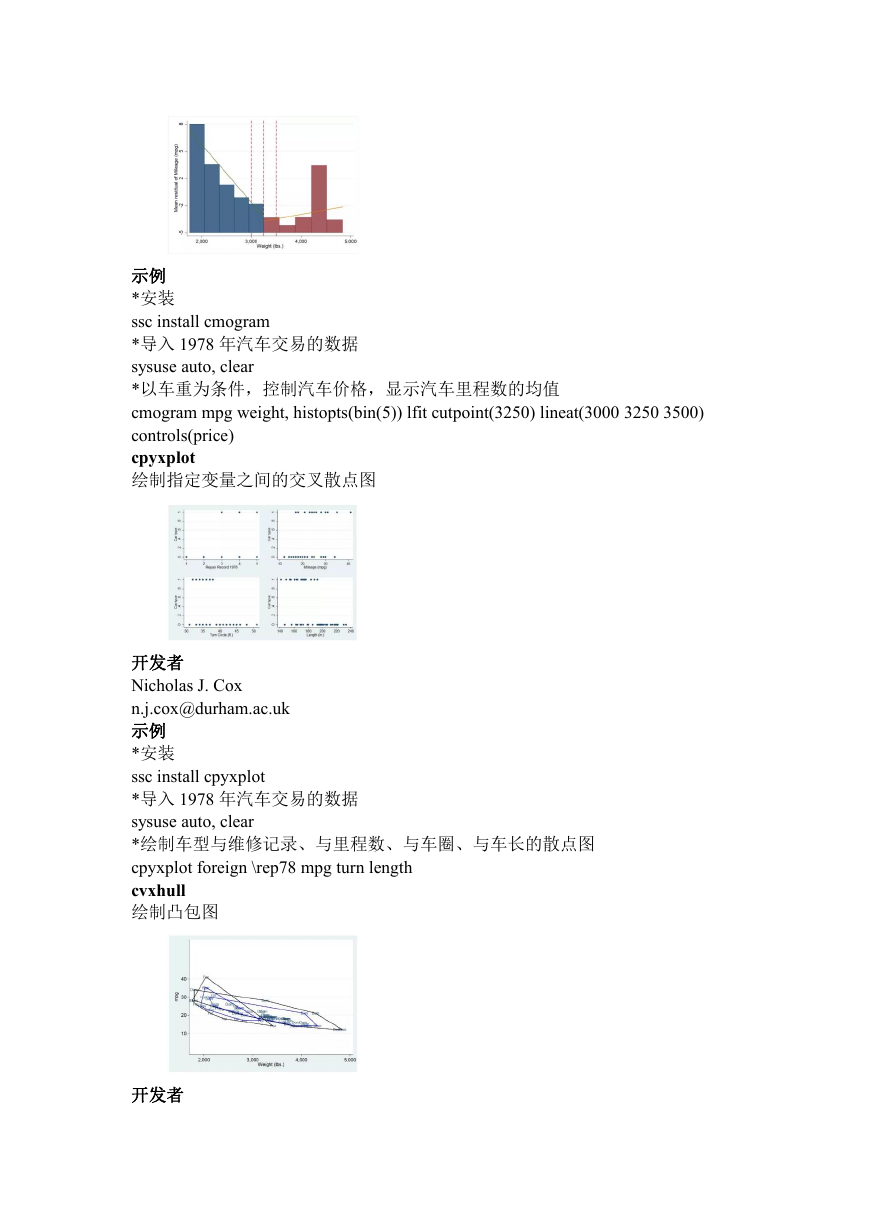
ciplot
显示均值和置信区间
开发者
Nicholas J. Cox
n.j.cox@durham.ac.uk
示例
*安装
ssc install ciplot
*导入美国城市的气温数据
sysuse citytemp, clear
*绘制置信区间
ciplot heatdd cooldd, by(division) xla(, ang(45))
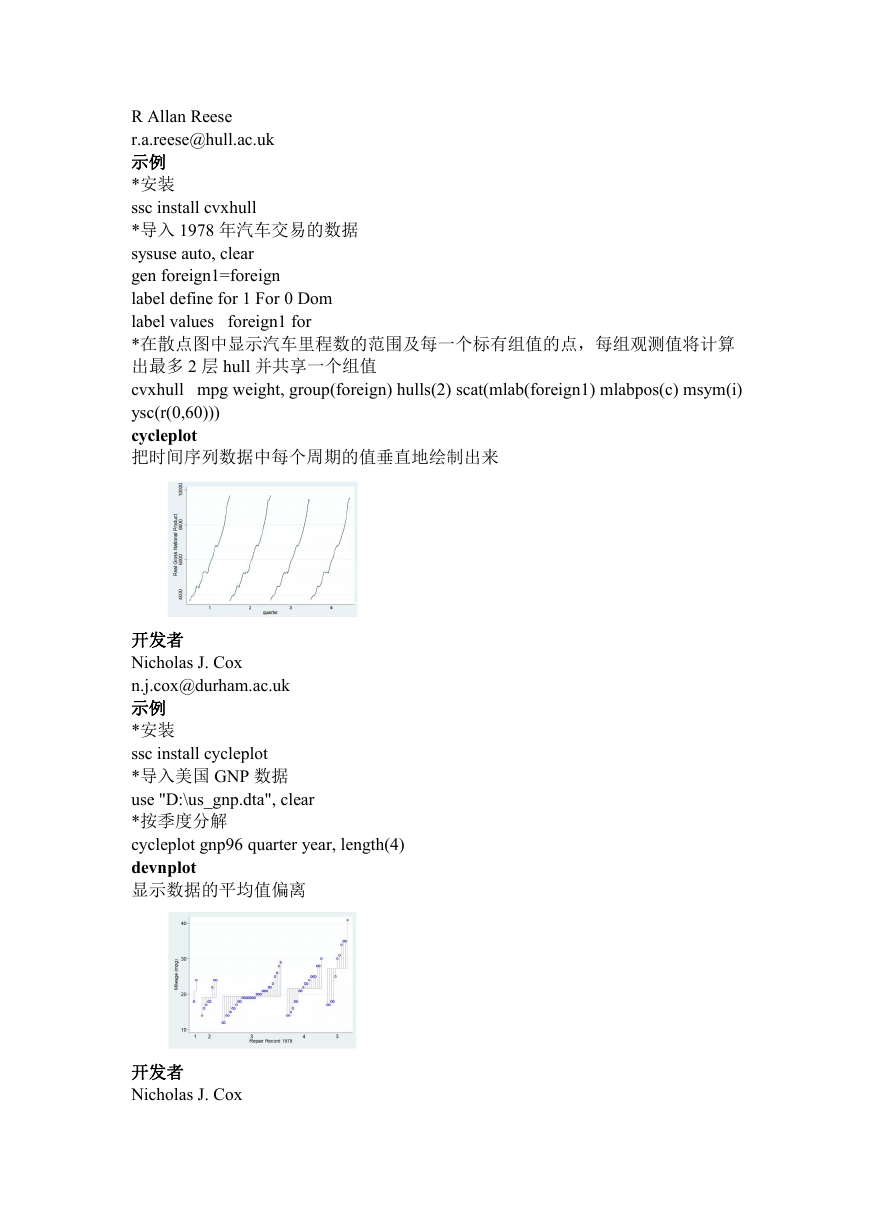
cmogram
以某变量为条件,显示另一变量的均值、中位数、频数、比例
�
示例
*安装
ssc install cmogram
*导入 1978 年汽车交易的数据
sysuse auto, clear
*以车重为条件,控制汽车价格,显示汽车里程数的均值
cmogram mpg weight, histopts(bin(5)) lfit cutpoint(3250) lineat(3000 3250 3500)
controls(price)
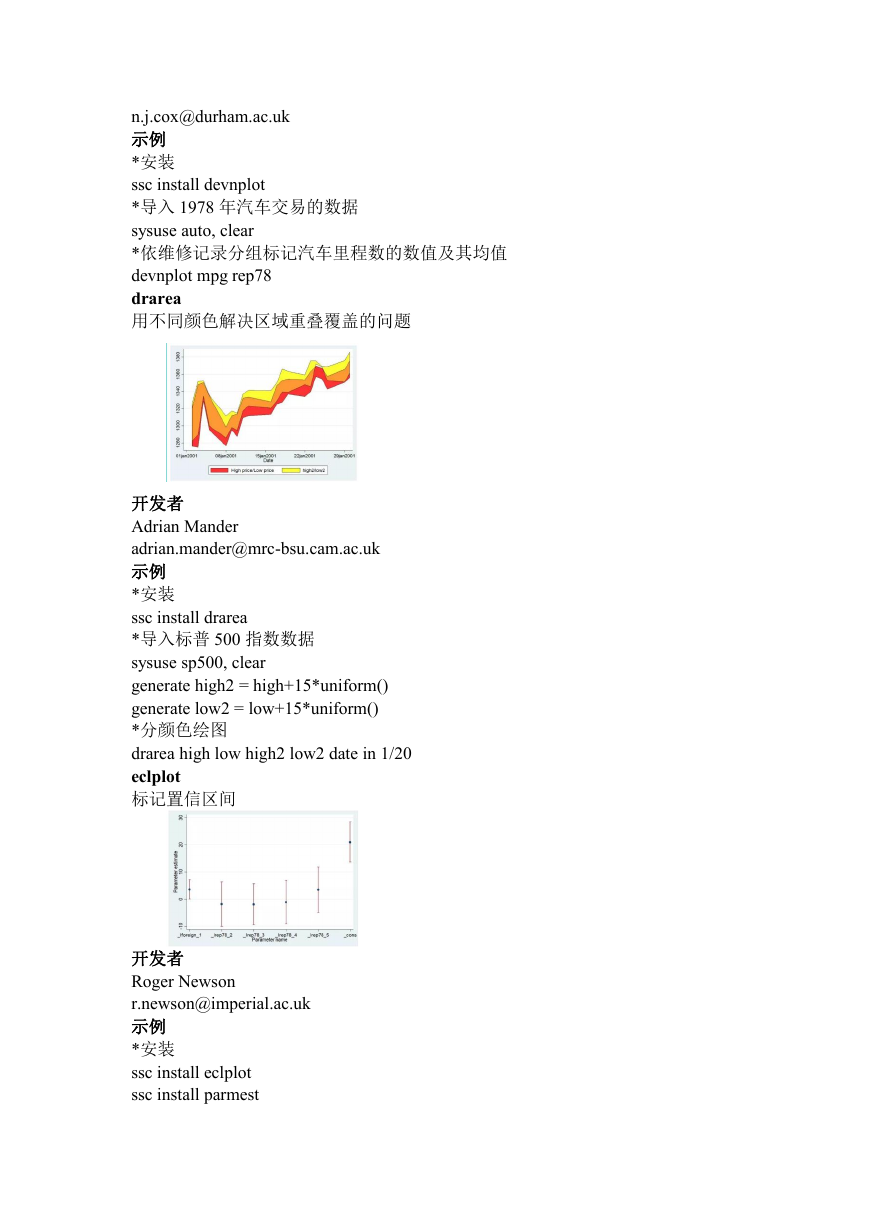
cpyxplot
绘制指定变量之间的交叉散点图
开发者
Nicholas J. Cox
n.j.cox@durham.ac.uk
示例
*安装
ssc install cpyxplot
*导入 1978 年汽车交易的数据
sysuse auto, clear
*绘制车型与维修记录、与里程数、与车圈、与车长的散点图
cpyxplot foreign \rep78 mpg turn length
cvxhull
绘制凸包图
开发者
�
R Allan Reese
r.a.reese@hull.ac.uk
示例
*安装
ssc install cvxhull
*导入 1978 年汽车交易的数据
sysuse auto, clear
gen foreign1=foreign
label define for 1 For 0 Dom
label values foreign1 for
*在散点图中显示汽车里程数的范围及每一个标有组值的点,每组观测值将计算
出最多 2 层 hull 并共享一个组值
cvxhull mpg weight, group(foreign) hulls(2) scat(mlab(foreign1) mlabpos(c) msym(i)
ysc(r(0,60)))
cycleplot
把时间序列数据中每个周期的值垂直地绘制出来
开发者
Nicholas J. Cox
n.j.cox@durham.ac.uk
示例
*安装
ssc install cycleplot
*导入美国 GNP 数据
use "D:\us_gnp.dta", clear
*按季度分解
cycleplot gnp96 quarter year, length(4)
devnplot
显示数据的平均值偏离
开发者
Nicholas J. Cox
�
n.j.cox@durham.ac.uk
示例
*安装
ssc install devnplot
*导入 1978 年汽车交易的数据
sysuse auto, clear
*依维修记录分组标记汽车里程数的数值及其均值
devnplot mpg rep78
drarea
用不同颜色解决区域重叠覆盖的问题
开发者
Adrian Mander
adrian.mander@mrc-bsu.cam.ac.uk
示例
*安装
ssc install drarea
*导入标普 500 指数数据
sysuse sp500, clear
generate high2 = high+15*uniform()
generate low2 = low+15*uniform()
*分颜色绘图
drarea high low high2 low2 date in 1/20
eclplot
标记置信区间
开发者
Roger Newson
r.newson@imperial.ac.uk
示例
*安装
ssc install eclplot
ssc install parmest
�


 2023年江西萍乡中考道德与法治真题及答案.doc
 2012年重庆南川中考生物真题及答案.doc
 2013年江西师范大学地理学综合及文艺理论基础考研真题.doc
 2020年四川甘孜小升初语文真题及答案I卷.doc
 2020年注册岩土工程师专业基础考试真题及答案.doc
 2023-2024学年福建省厦门市九年级上学期数学月考试题及答案.doc
 2021-2022学年辽宁省沈阳市大东区九年级上学期语文期末试题及答案.doc
 2022-2023学年北京东城区初三第一学期物理期末试卷及答案.doc
 2018上半年江西教师资格初中地理学科知识与教学能力真题及答案.doc
 2012年河北国家公务员申论考试真题及答案-省级.doc
 2020-2021学年江苏省扬州市江都区邵樊片九年级上学期数学第一次质量检测试题及答案.doc
 2022下半年黑龙江教师资格证中学综合素质真题及答案.doc