峰值信噪比(Peak signal-to-noise Ratio, PSNR)提供了一个衡量图像失真或是噪声水平的客
观标准,常用于图像压缩等领域压缩前后图像劣化程度的客观评价。评价结果以 dB(分贝)
为单位表示,两个图像间,PSNR 值越大,则越趋于无劣化,劣化程度较大时,PSNR 值趋
于 0dB。在正常情况下,PSNR 的普遍基准为 30dB,30dB 以下的图像劣化较为明显。而对
于 RGB 彩色图像来说,峰值信噪比的定义也类似,只是均方差是所有方差之和除以图像尺
寸再除以 3。图像压缩中典型的峰值信噪比值在 30 到 40dB 之间,愈高愈好。这里的 MAXI
表示图像颜色的最大数值,8 位采样点表示为 255;MSE 是原始图像和解码后图像的均方误
差(Mean Square Error),对两个 m×n 单色图像 I 和 K,如果一个为另外一个的噪声近似,
那么它们的的均方差定义为:
Peak signal-to-noise ratio
From Wikipedia, the free encyclopedia
Peak signal-to-noise ratio, often abbreviated PSNR, is an engineering term for the ratio between
the maximum possible power of a signal and the power of corrupting noise that affects the fidelity
of its representation. Because many signals have a very wide dynamic range, PSNR is usually
expressed in terms of the logarithmic decibel scale.
PSNR is most commonly used to measure the quality of reconstruction of lossy compression
codecs (e.g., for image compression). The signal in this case is the original data, and the noise is
the error introduced by compression. When comparing compression codecs, PSNR is an
approximation to human perception of reconstruction quality. Although a higher PSNR generally
indicates that the reconstruction is of higher quality, in some cases it may not. One has to be
extremely careful with the range of validity of this metric; it is only conclusively valid when it is
used to compare results from the same codec (or codec type) and same content.
PSNR is most easily defined via the mean squared error (MSE). Given a noise-free m×n
monochrome image I and its noisy approximation K, MSE is defined as:
The PSNR (in dB) is defined as:
Here, MAXI is the maximum possible pixel value of the image. When the pixels are represented
using 8 bits per sample, this is 255. More generally, when samples are represented using linear
�
PCM with B bits per sample, MAXI is 2B−1. For color images with three RGB values per pixel, the
definition of PSNR is the same except the MSE is the sum over all squared value differences
divided by image size and by three. Alternately, for color images the image is converted to a
different color space and PSNR is reported against each channel of that color space, e.g., YCbCr
or HSL.
Typical values for the PSNR in lossy image and video compression are between 30 and 50 dB,
provided the bit depth is 8 bits, where higher is better. For 16-bit data typical values for the PSNR
are between 60 and 80 dB. Acceptable values for wireless transmission quality loss are considered
to be about 20 dB to 25 dB.
In the absence of noise, the two images I and K are identical, and thus the MSE is zero. In this
case the PSNR is infinite (or undefined, see Division by zero).
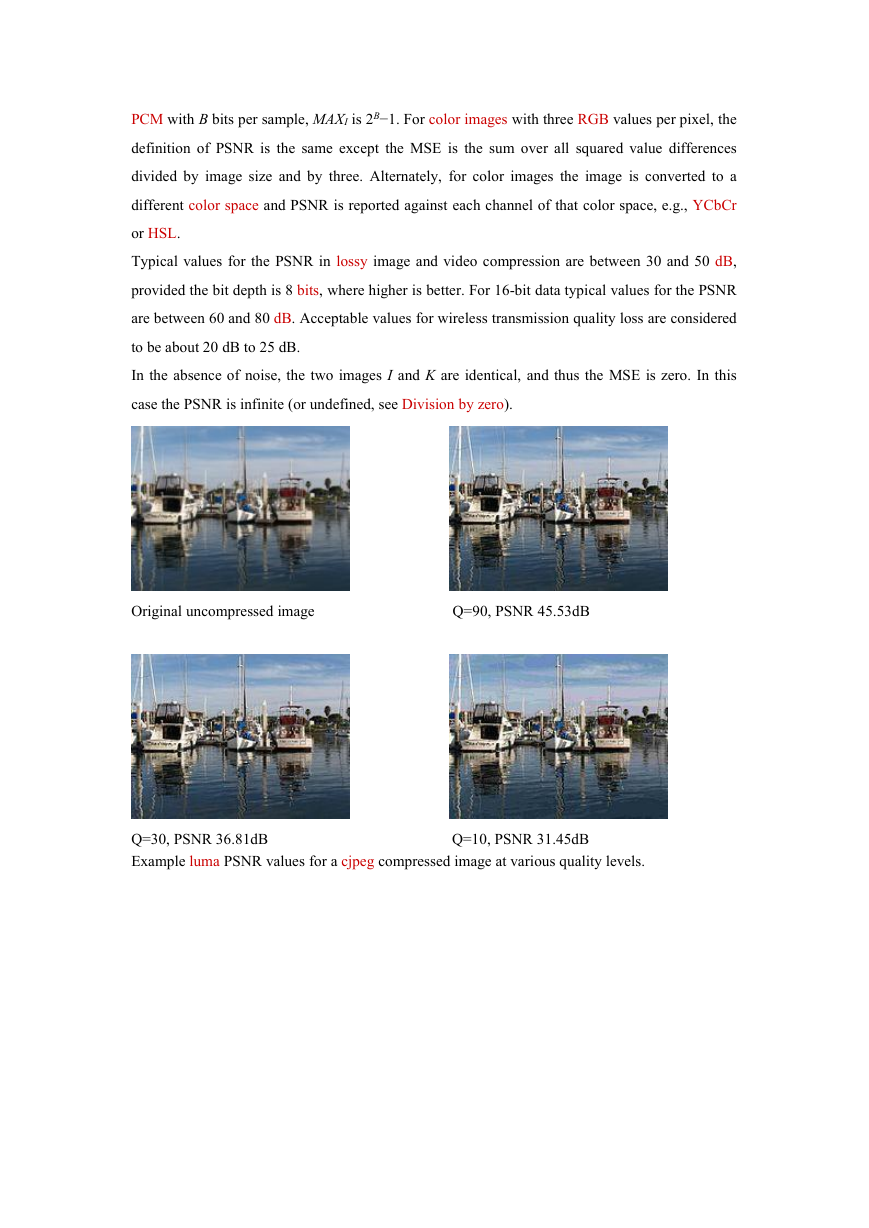
Original uncompressed image
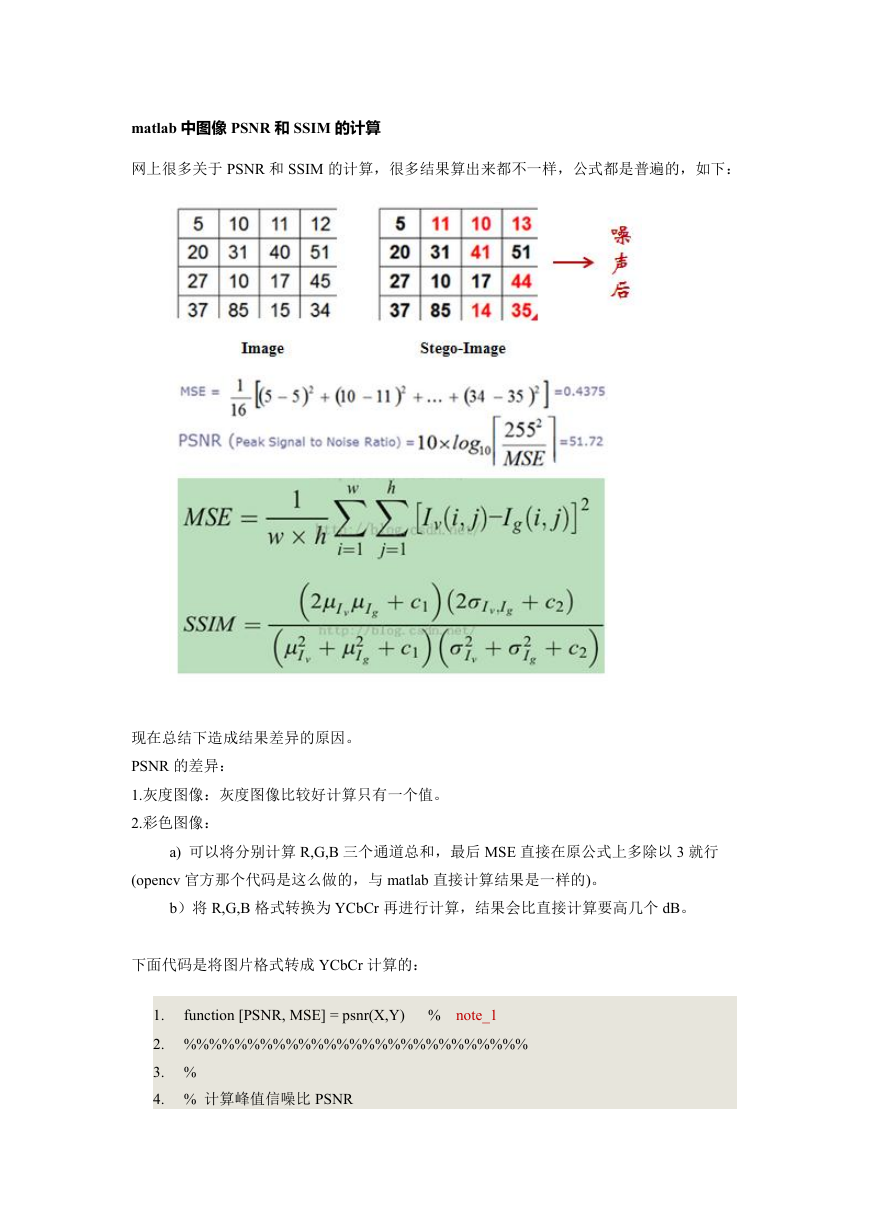
Q=90, PSNR 45.53dB
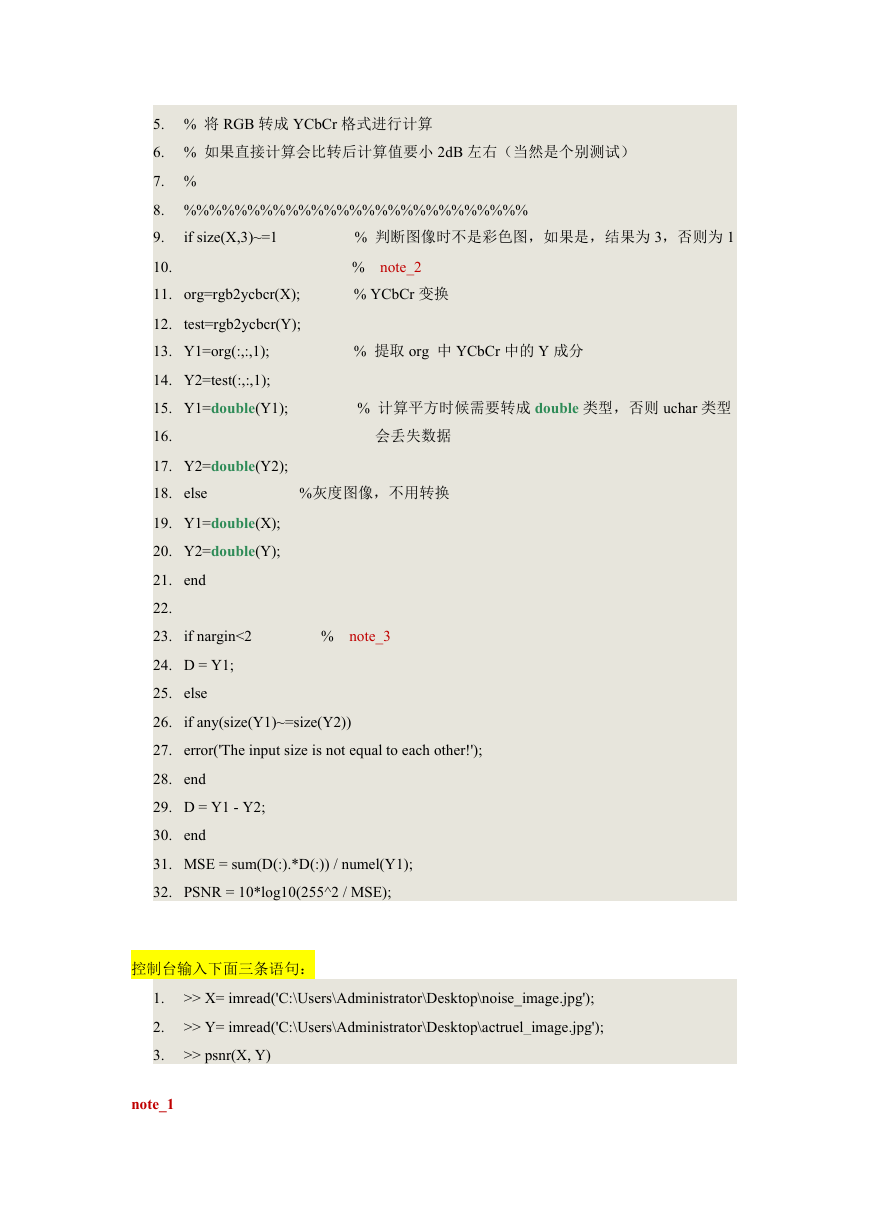
Q=30, PSNR 36.81dB
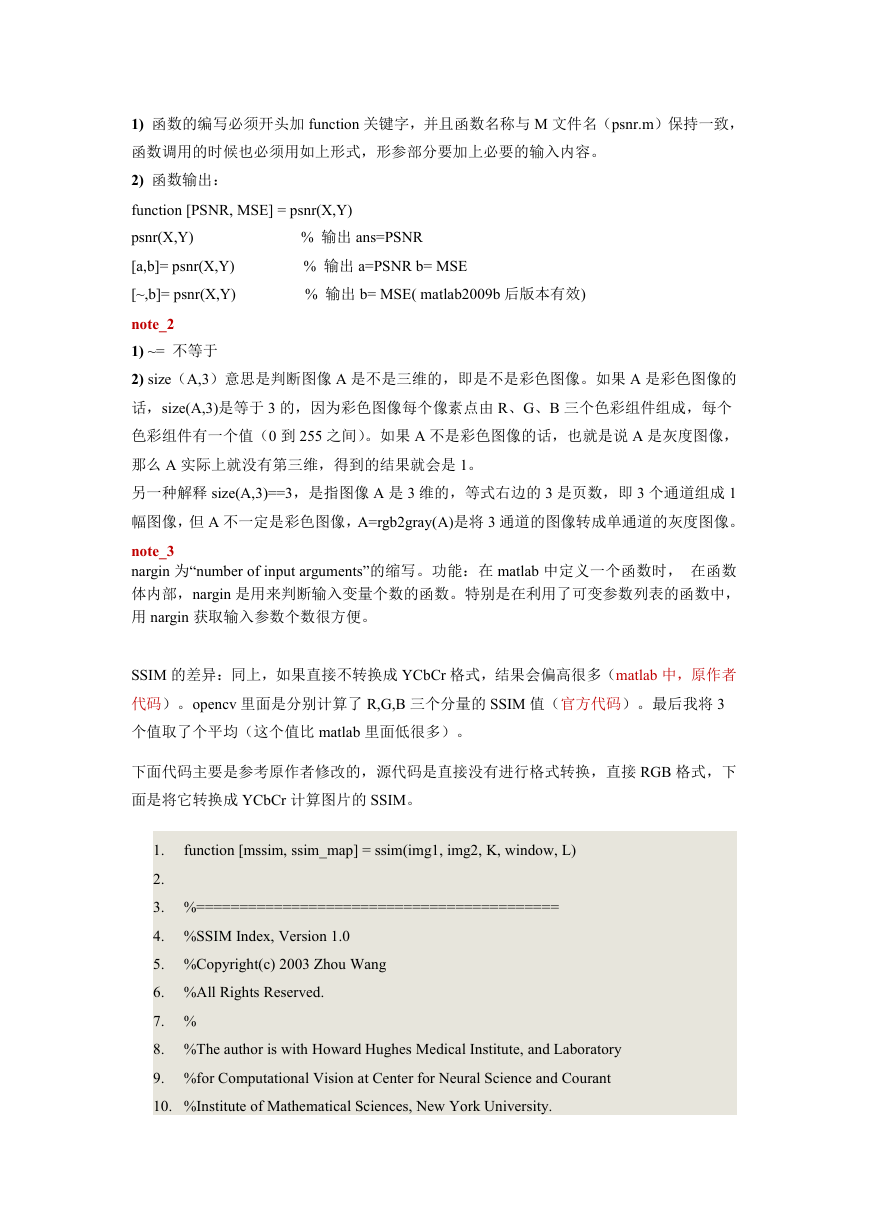
Example luma PSNR values for a cjpeg compressed image at various quality levels.
Q=10, PSNR 31.45dB
�
matlab 中图像 PSNR 和 SSIM 的计算
网上很多关于 PSNR 和 SSIM 的计算,很多结果算出来都不一样,公式都是普遍的,如下:
现在总结下造成结果差异的原因。
PSNR 的差异:
1.灰度图像:灰度图像比较好计算只有一个值。
2.彩色图像:
a) 可以将分别计算 R,G,B 三个通道总和,最后 MSE 直接在原公式上多除以 3 就行
(opencv 官方那个代码是这么做的,与 matlab 直接计算结果是一样的)。
b)将 R,G,B 格式转换为 YCbCr 再进行计算,结果会比直接计算要高几个 dB。
下面代码是将图片格式转成 YCbCr 计算的:
function [PSNR, MSE] = psnr(X,Y) % note_1
1.
2. %%%%%%%%%%%%%%%%%%%%%%%%%%%
3. %
4. % 计算峰值信噪比 PSNR
�
if size(X,3)~=1
% 判断图像时不是彩色图,如果是,结果为 3,否则为 1
% note_2
% YCbCr 变换
% 计算平方时候需要转成 double 类型,否则 uchar 类型
会丢失数据
%灰度图像,不用转换
% 提取 org 中 YCbCr 中的 Y 成分
5. % 将 RGB 转成 YCbCr 格式进行计算
6. % 如果直接计算会比转后计算值要小 2dB 左右(当然是个别测试)
7. %
8. %%%%%%%%%%%%%%%%%%%%%%%%%%%
9.
10.
11. org=rgb2ycbcr(X);
12.
test=rgb2ycbcr(Y);
13. Y1=org(:,:,1);
14. Y2=test(:,:,1);
15. Y1=double(Y1);
16.
17. Y2=double(Y2);
18. else
19. Y1=double(X);
20. Y2=double(Y);
21. end
22.
23.
24. D = Y1;
25. else
26.
27. error('The input size is not equal to each other!');
28. end
29. D = Y1 - Y2;
30. end
31. MSE = sum(D(:).*D(:)) / numel(Y1);
32. PSNR = 10*log10(255^2 / MSE);
if any(size(Y1)~=size(Y2))
if nargin<2
% note_3
控制台输入下面三条语句:
1.
2.
3.
>> X= imread('C:\Users\Administrator\Desktop\noise_image.jpg');
>> Y= imread('C:\Users\Administrator\Desktop\actruel_image.jpg');
>> psnr(X, Y)
note_1
�
% 输出 ans=PSNR
% 输出 a=PSNR b= MSE
% 输出 b= MSE( matlab2009b 后版本有效)
1) 函数的编写必须开头加 function 关键字,并且函数名称与 M 文件名(psnr.m)保持一致,
函数调用的时候也必须用如上形式,形参部分要加上必要的输入内容。
2) 函数输出:
function [PSNR, MSE] = psnr(X,Y)
psnr(X,Y)
[a,b]= psnr(X,Y)
[~,b]= psnr(X,Y)
note_2
1) ~= 不等于
2) size(A,3)意思是判断图像 A 是不是三维的,即是不是彩色图像。如果 A 是彩色图像的
话,size(A,3)是等于 3 的,因为彩色图像每个像素点由 R、G、B 三个色彩组件组成,每个
色彩组件有一个值(0 到 255 之间)。如果 A 不是彩色图像的话,也就是说 A 是灰度图像,
那么 A 实际上就没有第三维,得到的结果就会是 1。
另一种解释 size(A,3)==3,是指图像 A 是 3 维的,等式右边的 3 是页数,即 3 个通道组成 1
幅图像,但 A 不一定是彩色图像,A=rgb2gray(A)是将 3 通道的图像转成单通道的灰度图像。
note_3
nargin 为“number of input arguments”的缩写。功能:在 matlab 中定义一个函数时, 在函数
体内部,nargin 是用来判断输入变量个数的函数。特别是在利用了可变参数列表的函数中,
用 nargin 获取输入参数个数很方便。
SSIM 的差异:同上,如果直接不转换成 YCbCr 格式,结果会偏高很多(matlab 中,原作者
代码)。opencv 里面是分别计算了 R,G,B 三个分量的 SSIM 值(官方代码)。最后我将 3
个值取了个平均(这个值比 matlab 里面低很多)。
下面代码主要是参考原作者修改的,源代码是直接没有进行格式转换,直接 RGB 格式,下
面是将它转换成 YCbCr 计算图片的 SSIM。
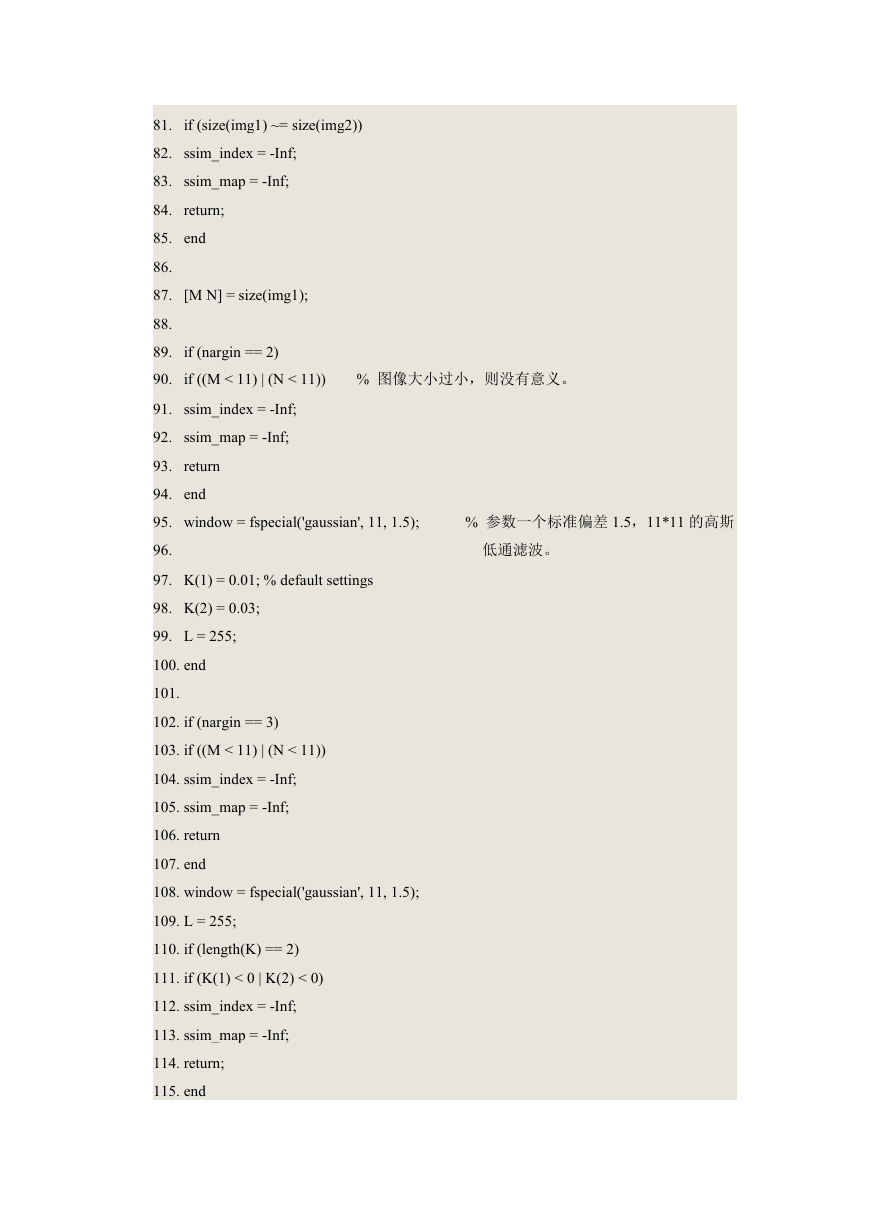
function [mssim, ssim_map] = ssim(img1, img2, K, window, L)
1.
2.
3. %==========================================
4. %SSIM Index, Version 1.0
5. %Copyright(c) 2003 Zhou Wang
6. %All Rights Reserved.
7. %
8. %The author is with Howard Hughes Medical Institute, and Laboratory
9. %for Computational Vision at Center for Neural Science and Courant
10. %Institute of Mathematical Sciences, New York University.
�
11. %
12. %----------------------------------------------------------------------
13. %Permission to use, copy, or modify this software and its documentation
14. %for educational and research purposes only and without fee is hereby
15. %granted, provided that this copyright notice and the original authors'
16. %names ap pearon all copies and supporting documentation. This program
17. %shall not be used, rewritten, or adapted as the basis of a commercial
18. %software or hardware product without first obtaining permission of the
19. %authors. The authors make no representations about the suitability of
20. %this software for any purpose. It is provided "as is" without express
21. %or implied warranty.
22. %----------------------------------------------------------------------
23. %
24. %This is an implementation of the algorithm for calculating the
25. %Structural SIMilarity (SSIM) index between two images. Please refer
26. %to the following paper:
27. %
28. %Z. Wang, A. C. Bovik, H. R. Sheikh, and E. P. Simoncelli, "Image
29. %quality assessment: From error visibility to structural similarity"
30. %IEEE Transactios on Image Processing, vol. 13, no. 4, pp.600-612,
31. %Apr. 2004.
32. %
33. %Kindly report any suggestions or corrections to zhouwang@ieee.org
34. %
35. %----------------------------------------------------------------------
36. %
37. %Input : (1) img1: the first image being compared
38. % (2) img2: the second image being compared
39. % (3) K: constants in the SSIM index formula (see the above
40. % reference). defualt value: K = [0.01 0.03]
41. % (4) window: local window for statistics (see the above
42. % reference). default widnow is Gaussian given by
43. % window = fspecial('gaussian', 11, 1.5);
44. % (5) L: dynamic range of the images. default: L = 255
45. %
�
46. %Output: (1) mssim: the mean SSIM index value between 2 images.
47. % If one of the images being compared is regarded as
48. % perfect quality, then mssim can be considered as the
49. % quality measure of the other image.
50. % If img1 = img2, then mssim = 1.
51. % (2) ssim_map: the SSIM index map of the test image. The map
52. % has a smaller size than the input images. The actual size:
53. % size(img1) - size(window) + 1.
54. %
55. %Default Usage:
56. % Given 2 test images img1 and img2, whose dynamic range is 0-255
57. %
58. % [mssim ssim_map] = ssim_index(img1, img2);
59. %
60. %Advanced Usage:
61. % User defined parameters. For example
62. %
63. % K = [0.05 0.05];
64. % window = ones(8);
65. % L = 100;
66. % [mssim ssim_map] = ssim_index(img1, img2, K, window, L);
67. %
68. %See the results:
69. %
70. % mssim %Gives the mssim value
71. % imshow(max(0, ssim_map).^4)
72. %
73. %===================================================
74.
75.
76. ssim_index = -Inf;
77. ssim_map = -Inf;
78.
79. end
80.
if (nargin < 2 | nargin > 5)
% Shows the SSIM index map
return;
�
% 图像大小过小,则没有意义。
% 参数一个标准偏差 1.5,11*11 的高斯
低通滤波。
[M N] = size(img1);
return;
return
if (size(img1) ~= size(img2))
if (nargin == 2)
if ((M < 11) | (N < 11))
81.
82. ssim_index = -Inf;
83. ssim_map = -Inf;
84.
85. end
86.
87.
88.
89.
90.
91. ssim_index = -Inf;
92. ssim_map = -Inf;
93.
94. end
95. window = fspecial('gaussian', 11, 1.5);
96.
97. K(1) = 0.01; % default settings
98. K(2) = 0.03;
99. L = 255;
100. end
101.
102. if (nargin == 3)
103. if ((M < 11) | (N < 11))
104. ssim_index = -Inf;
105. ssim_map = -Inf;
106. return
107. end
108. window = fspecial('gaussian', 11, 1.5);
109. L = 255;
110. if (length(K) == 2)
111. if (K(1) < 0 | K(2) < 0)
112. ssim_index = -Inf;
113. ssim_map = -Inf;
114. return;
115. end
�





 2023年江西萍乡中考道德与法治真题及答案.doc
 2012年重庆南川中考生物真题及答案.doc
 2013年江西师范大学地理学综合及文艺理论基础考研真题.doc
 2020年四川甘孜小升初语文真题及答案I卷.doc
 2020年注册岩土工程师专业基础考试真题及答案.doc
 2023-2024学年福建省厦门市九年级上学期数学月考试题及答案.doc
 2021-2022学年辽宁省沈阳市大东区九年级上学期语文期末试题及答案.doc
 2022-2023学年北京东城区初三第一学期物理期末试卷及答案.doc
 2018上半年江西教师资格初中地理学科知识与教学能力真题及答案.doc
 2012年河北国家公务员申论考试真题及答案-省级.doc
 2020-2021学年江苏省扬州市江都区邵樊片九年级上学期数学第一次质量检测试题及答案.doc
 2022下半年黑龙江教师资格证中学综合素质真题及答案.doc