logo资料库

Pro .NET Performance 无水印pdf.pdf

第1页 / 共361页
第2页 / 共361页
第3页 / 共361页
第4页 / 共361页
第5页 / 共361页
第6页 / 共361页
第7页 / 共361页
第8页 / 共361页
资料共361页,剩余部分请下载后查看
Pro .NET Per formance
Cover
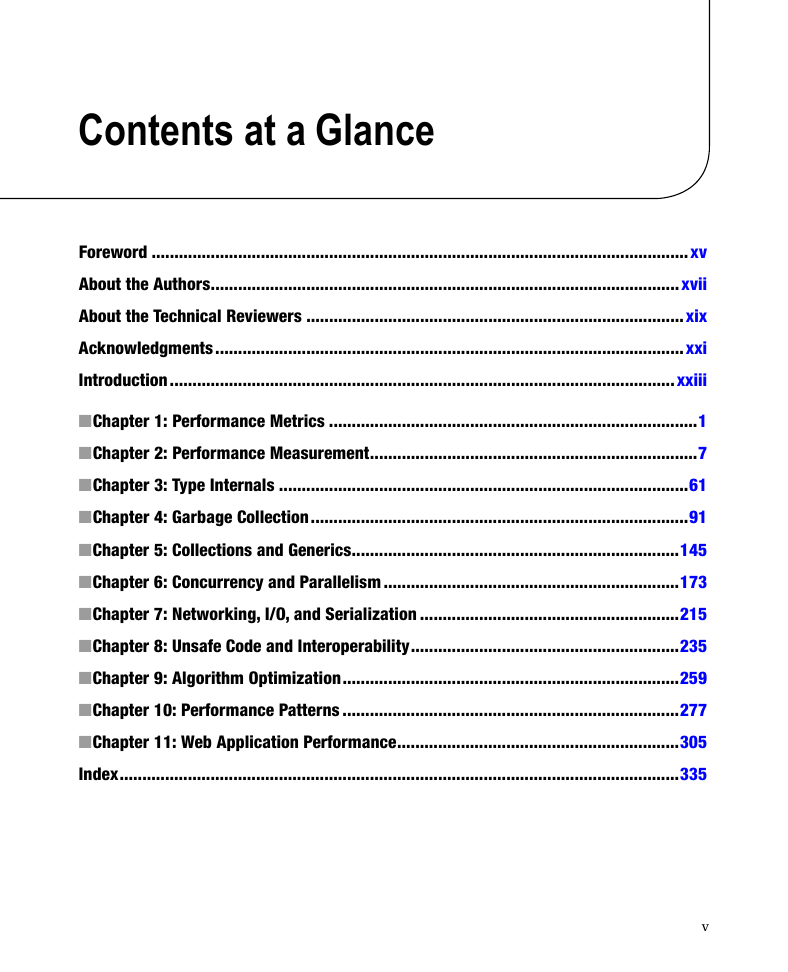
Contents at a Glance
Contents
Foreword
About the Authors
About the Technical Reviewers
Acknowledgments
Introduction
1: Performance Metrics
Performance Goals
Performance Metrics
Summary
2: Performance Measurement
Approaches to Performance Measurement
Built-in Windows Tools
Performance Counters
Performance Counter Logs and Alerts
Custom Performance Counters
Event Tracing for Windows (ETW)
Windows Performance Toolkit (WPT)
PerfMonitor
The PerfView Tool
Custom ETW Providers
Time Profilers
Visual Studio Sampling Profiler
Visual Studio Instrumentation Profiler
Advanced Uses of Time Profilers
Sampling Tips
Collecting Additional Data While Profiling
Profiler Guidance
Advanced Profiling Customization
Allocation Profilers
Visual Studio Allocation Profiler
CLR Profiler
Memory Profilers
ANTS Memory Profiler
SciTech .NET Memory Profiler
Other Profilers
Database and Data Access Profilers
Concurrency Profilers
I/O Profilers
Microbenchmarking
Poor Microbenchmark Example
Microbenchmarking Guidelines
Summary
3: Type Internals
An Example
Semantic Differences between Reference Types and Value Types
Storage, Allocation, and Deallocation
Reference Type Internals
The Method Table
Invoking Methods on Reference Type Instances
Dispatching Non-Virtual Methods
Dispatching Static and Interface Methods
Sync Blocks And The lock Keyword
Value Type Internals
Value Type Limitations
Virtual Methods on Value Types
Boxing
Avoiding Boxing on Value Types with the Equals Method
The GetHashCode Method
Best Practices for Using Value Types
Summary
4: Garbage Collection
Why Garbage Collection?
Free List Management
Reference-Counting Garbage Collection
Tracing Garbage Collection
Mark Phase
Local Roots
Static Roots
Other Roots
Performance Implications
Sweep and Compact Phases
Pinning
Garbage Collection Flavors
Pausing Threads for Garbage Collection
Pausing Threads during the Mark Phase
Pausing Threads during the Sweep Phase
Workstation GC
Concurrent Workstation GC
Non-Concurrent Workstation GC
Server GC
Switching Between GC Flavors
Generations
Generational Model Assumptions
.NET Implementation of Generations
Generation 0
Generation 1
Generation 2
Large Object Heap
References between Generations
Background GC
GC Segments and Virtual Memory
Finalization
Manual Deterministic Finalization
Automatic Non-Deterministic Finalization
Pitfalls of Non-Deterministic Finalization
The Dispose Pattern
Resurrection
Weak References
Interacting with the Garbage Collector
The System.GC Class
Diagnostic Methods
Notifications
Control Methods
Interacting with the GC using CLR Hosting
GC Triggers
Garbage Collection Performance Best Practices
Generational Model
Pinning
Finalization
Miscellaneous Tips and Best Practices
Value Types
Object Graphs
Pooling Objects
Paging and Allocating Unmanaged Memory
Static Code Analysis (FxCop) Rules
Summary
5: Collections and Generics
Generics
.NET Generics
Generic Constraints
Implementation of CLR Generics
Java Generics
C++ Templates
Generics Internals
Collections
Concurrent Collections
Cache Considerations
Custom Collections
Disjoint-Set (Union-Find)
Skip List
One-Shot Collections
Summary
6: Concurrency and Parallelism
Challenges and Gains
Why Concurrency and Parallelism?
From Threads to Thread Pool to Tasks
Task Parallelism
Throttling Parallelism in Recursive Algorithms
More Examples of Recursive Decomposition
Exceptions and Cancellation
Data Parallelism
Parallel.For and Parallel.ForEach
Parallel LINQ (PLINQ)
C# 5 Async Methods
Advanced Patterns in the TPL
Synchronization
Lock-Free Code
Windows Synchronization Mechanisms
Cache Considerations
General Purpose GPU Computing
Introduction to C++ AMP
Matrix Multiplication
N-Body Simulation
Tiles and Shared Memory
Summary
7: Networking, I/O, and Serialization
General I/O Concepts
Synchronous and Asynchronous I/O
I/O Completion Ports
NET Thread Pool
Copying Memory
Unmanaged Memory
Exposing Part of a Buffer
Scatter–Gather I/O
File I/O
Cache Hinting
Unbuffered I/O
Networking
Network Protocols
Pipelining
Streaming
Message Chunking
Chatty Protocols
Message Encoding and Redundancy
Network Sockets
Asynchronous Sockets
Socket Buffers
Nagle's Algorithm
Registered I/O
Data Serialization and Deserialization
Serializer Benchmarks
DataSet Serialization
Windows Communication Foundation
Throttling
Process Model
Caching
Asynchronous WCF Clients and Servers
Bindings
Summary
8: Unsafe Code and Interoperability
Unsafe Code
Pinning and GC Handles
Lifetime Management
Allocating Unmanaged Memory
Memory Pooling
P/Invoke
PInvoke.net and P/Invoke Interop Assistant
Binding
Marshaler Stubs
Blittable Types
Marshaling Direction, Value and Reference Types
Code Access Security
COM Interoperability
Lifetime Management
Apartment Marshaling
TLB Import and Code Access Security
NoPIA
Exceptions
C++/CLI Language Extensions
The marshal_as Helper Library
IL Code vs. Native Code
Windows 8 WinRT Interop
Best Practices for Interop
Summary
9: Algorithm Optimization
Taxonomy of Complexity
Big-Oh Notation
Turing Machines and Complexity Classes
The Halting Problem
NP-Complete Problems
Memoization and Dynamic Programming
Edit Distance
All-Pairs-Shortest-Paths
Approximation
Traveling Salesman
Maximum Cut
Probabilistic Algorithms
Probabilistic Maximum Cut
Fermat Primality Test
Indexing and Compression
Variable Length Encoding
Index Compression
Summary
10: Performance Patterns
JIT Compiler Optimizations
Standard Optimizations
Method Inlining
Range-Check Elimination
Tail Call
Startup Performance
Pre-JIT Compilation with NGen (Native Image Generator)
Multi-Core Background JIT Compilation
Image Packers
Managed Profile-Guided Optimization (MPGO)
Miscellaneous Tips for Startup Performance
Strong Named Assemblies Belong in the GAC
Make Sure Your Native Images Do Not Require Rebasing
Reduce the Total Number of Assemblies
Processor-Specific Optimization
Single Instruction Multiple Data (SIMD)
Instruction-Level Parallelism
Exceptions
Reflection
Code Generation
Generating Code from Source
Generating Code Using Dynamic Lightweight Code Generation
Summary
11: Web Application Performance
Testing the Performance of Web Applications
Visual Studio Web Performance Test and Load Test
HTTP Monitoring Tools
Web Analyzing Tools
Improving Web Performance on the Server
Cache Commonly Used Objects
Using Asynchronous Pages, Modules, and Controllers
Creating an Asynchronous Page
Creating an Asynchronous Controller
Tweaking the ASP.NET Environment
Turn Off ASP.NET Tracing and Debugging
Disable View State
Server-Side Output Cache
Pre-Compiling ASP.NET Applications
Fine-Tuning the ASP.NET Process Model
Configuring IIS
Output Caching
User-Mode Cache
Kernel-Mode Cache
Application Pool Configuration
Idle Timeouts
Processor Affinity
Web Garden
Optimizing the Network
Apply HTTP Caching Headers
Setting Cache Headers for Static Content
Setting Cache Headers for Dynamic Content
Turn on IIS Compression
Static Compression
Dynamic Compression
Configuring Compression
IIS Compression and Client Applications
Minification and Bundling
Use Content Delivery Networks (CDNs)
Scaling ASP.NET Applications
Scaling Out
ASP.NET Scaling Mechanisms
Scaling Out Pitfalls
Summary
Index

THE EXPERT’S VOICE® IN .NET
For your convenience Apress has placed some of the front matter material after the index. Please use the Bookmarks and Contents at a Glance links to access them.
Contents at a Glance Foreword ......................................................................................................................xv About the Authors .......................................................................................................xvii About the Technical Reviewers ...................................................................................xix Acknowledgments .......................................................................................................xxi Introduction ...............................................................................................................xxiii ■ Chapter 1: Performance Metrics .................................................................................1 ■ Chapter 2: Performance Measurement ........................................................................7 ■ Chapter 3: Type Internals ..........................................................................................61 ■ Chapter 4: Garbage Collection ...................................................................................91 ■ Chapter 5: Collections and Generics ........................................................................145 ■ Chapter 6: Concurrency and Parallelism .................................................................173 ■ Chapter 7: Networking, I/O, and Serialization .........................................................215 ■ Chapter 8: Unsafe Code and Interoperability ...........................................................235 ■ Chapter 9: Algorithm Optimization ..........................................................................259 ■ Chapter 10: Performance Patterns ..........................................................................277 ■ Chapter 11: Web Application Performance ..............................................................305 Index ...........................................................................................................................335 v
Introduction This book has come to be because we felt there was no authoritative text that covered all three areas relevant to .NET application performance: • • • Identifying performance metrics and then measuring application performance to verify whether it meets or exceeds these metrics. Improving application performance in terms of memory management, networking, I/O, concurrency, and other areas. Understanding CLR and .NET internals in sufficient detail to design high-performance applications and fix performance issues as they arise. We believe that .NET developers cannot achieve systematically high-performance software solutions without thoroughly understanding all three areas. For example, .NET memory management (facilitated by the CLR garbage collector) is an extremely complex field and the cause of significant performance problems, including memory leaks and long GC pause times. Without understanding how the CLR garbage collector operates, high-performance memory management in .NET is left to nothing but chance. Similarly, choosing the proper collection class from what the .NET Framework has to offer, or deciding to implement your own, requires comprehensive familiarity with CPU caches, runtime complexity, and synchronization issues. This book’s 11 chapters are designed to be read in succession, but you can jump back and forth between topics and fill in the blanks when necessary. The chapters are organized into the following logical parts: • • • • • Chapter 1 and Chapter 2 deal with performance metrics and performance measurement. They introduce the tools available to you to measure application performance. Chapter 3 and Chapter 4 dive deep into CLR internals. They focus on type internals and the implementation of CLR garbage collection—two crucial topics for improving application performance where memory management is concerned. Chapter 5, Chapter 6, Chapter 7, Chapter 8, and Chapter 11 discuss specific areas of the .NET Framework and the CLR that offer performance optimization opportunities—using collections correctly, parallelizing sequential code, optimizing I/O and networking operations, using interoperability solutions efficiently, and improving the performance of Web applications. Chapter 9 is a brief foray into complexity theory and algorithms. It was written to give you a taste of what algorithm optimization is about. Chapter 10 is the dumping ground for miscellaneous topics that didn’t fit elsewhere in the book, including startup time optimization, exceptions, and .NET Reflection. Some of these topics have prerequisites that will help you understand them better. Throughout the course of the book we assume substantial experience with the C# programming language and the .NET Framework, as well as familiarity with fundamental concepts, including: xxiii
■ IntroduCtIon • • • Windows: threads, synchronization, virtual memory Common Language Runtime (CLR): Just-In-Time (JIT) compiler, Microsoft Intermediate Language (MSIL), garbage collector Computer organization: main memory, cache, disk, graphics card, network interface There are quite a few sample programs, excerpts, and benchmarks throughout the book. In the interest of not making this book any longer, we often included only a brief part—but you can find the whole program in the companion source code on the book’s website. In some chapters we use code in x86 assembly language to illustrate how CLR mechanisms operate or to explain more thoroughly a specific performance optimization. Although these parts are not crucial to the book’s takeaways, we recommend dedicated readers to invest some time in learning the fundamentals of x86 assembly language. Randall Hyde’s freely available book “The Art of Assembly Language Programming” (http://www.artofasm.com/Windows/index.html) is an excellent resource. In conclusion, this book is full of performance measurement tools, small tips and tricks for improving minor areas of application performance, theoretical foundations for many CLR mechanisms, practical code examples, and several case studies from the authors’ experience. For almost ten years we have been optimizing applications for our clients and designing high-performance systems from scratch. During these years we trained hundreds of developers to think about performance at every stage of the software development lifecycle and to actively seek opportunities for improving application performance. After reading this book, you will join the ranks of high-performance .NET application developers and performance investigators optimizing existing applications. Sasha Goldshtein Dima Zurbalev Ido Flatow xxiv
Chapter 1 Performance Metrics Before we begin our journey into the world of .NET performance, we must understand the metrics and goals involved in performance testing and optimization. In Chapter 2, we explore more than a dozen profilers and monitoring tools; however, to use these tools, you need to know which performance metrics you are interested in. Different types of applications have a multitude of varying performance goals, driven by business and operational needs. At times, the application’s architecture dictates the important performance metrics: for example, knowing that your Web server has to serve millions of concurrent users dictates a multi-server distributed system with caching and load balancing. At other times, performance measurement results may warrant changes in the application’s architecture: we have seen countless systems redesigned from the ground up after stress tests were run—or worse, the system failed in the production environment. In our experience, knowing the system’s performance goals and the limits of its environment often guides you more than halfway through the process of improving its performance. Here are some examples we have been able to diagnose and fix over the last few years: • • • • • We discovered a serious performance problem with a powerful Web server in a hosted data center caused by a shared low-latency 4Mbps link used by the test engineers. Not understanding the critical performance metric, the engineers wasted dozens of days tweaking the performance of the Web server, which was actually functioning perfectly. We were able to improve scrolling performance in a rich UI application by tuning the behavior of the CLR garbage collector—an apparently unrelated component. Precisely timing allocations and tweaking the GC flavor removed noticeable UI lags that annoyed users. We were able to improve compilation times ten-fold by moving hard disks to SATA ports to work around a bug in the Microsoft SCSI disk driver. We reduced the size of messages exchanged by a WCF service by 90 %, considerably improving its scalability and CPU utilization, by tuning WCF’s serialization mechanism. We reduced startup times from 35 seconds to 12 seconds for a large application with 300 assemblies on outdated hardware by compressing the application’s code and carefully disentangling some of its dependencies so that they were not required at load time. These examples serve to illustrate that every kind of system, from low-power touch devices, high-end consumer workstations with powerful graphics, all the way through multi-server data centers, exhibits unique performance characteristics as countless subtle factors interact. In this chapter, we briefly explore the variety of performance metrics and goals in typical modern software. In the next chapter, we illustrate how these metrics can be measured accurately; the remainder of the book shows how they can be improved systematically. 1
CHAPTER 1 ■ PERfoRmAnCE mETRiCs Performance Goals Performance goals depend on your application’s realm and architecture more than anything else. When you have finished gathering requirements, you should determine general performance goals. Depending on your software development process, you might need to adjust these goals as requirements change and new business and operation needs arise. We review some examples of performance goals and guidelines for several archetypal applications, but, as with anything performance-related, these guidelines need to be adapted to your software’s domain. First, here are some examples of statements that are not good performance goals: • • • The application will remain responsive when many users access the Shopping Cart screen simultaneously. The application will not use an unreasonable amount of memory as long as the number of users is reasonable. A single database server will serve queries quickly even when there are multiple, fully-loaded application servers. The main problem with these statements is that they are overly general and subjective. If these are your performance goals, then you are bound to discover they are subject to interpretation and disagreements on their frame-of-reference. A business analyst may consider 100,000 concurrent users a “reasonable” number, whereas a technical team member may know the available hardware cannot support this number of users on a single machine. Conversely, a developer might consider 500 ms response times “responsive,” but a user interface expert may consider it laggy and unpolished. A performance goal, then, is expressed in terms of quantifiable performance metrics that can be measured by some means of performance testing. The performance goal should also contain some information about its environment—general or specific to that performance goal. Some examples of well-specified performance goals include: • The application will serve every page in the “Important” category within less than 300 ms (not including network roundtrip time), as long as not more than 5,000 users access the Shopping Cart screen concurrently. • • The application will use not more than 4 KB of memory for each idle user session. The database server’s CPU and disk utilization should not exceed 70%, and it should return responses to queries in the “Common” category within less than 75ms, as long as there are no more than 10 application servers accessing it. Note These examples assume that the “important” page category and “Common” query category are ■ well-known terms defined by business analysts or application architects. Guaranteeing performance goals for every nook and cranny in the application is often unreasonable and is not worth the investment in development, hardware, and operational costs. We now consider some examples of performance goals for typical applications (see Table 1-1). This list is by no means exhaustive and is not intended to be used as a checklist or template for your own performance goals—it is a general frame that establishes differences in performance goals when diverse application types are concerned. 2
External Web Server External Web Server Application Server Application Server Smart Client Application Smart Client Application Web Page Web Page Time from request start to full response generated should not exceed 300ms Virtual memory usage (including cache) should not exceed 1.3GB CPU utilization should not exceed 75% Time from double-click on desktop shortcut to main screen showing list of employees should not exceed 1,500ms CPU utilization when the application is idle should not exceed 1% Time for filtering and sorting the grid of incoming emails should not exceed 750ms, including shuffling animation Memory utilization of cached JavaScript objects for the “chat with representative” windows should not exceed 2.5MB CHAPTER 1 ■ PERfoRmAnCE mETRiCs Environment Constraints Not more than 300 concurrently active requests Not more than 300 concurrently active requests; not more than 5,000 connected user sessions Not more than 1,000 concurrently active API requests -- -- Not more than 200 incoming emails displayed on a single screen -- -- -- Table 1-1. Examples of Performance Goals for Typical Applications System Type Performance Goal Hard page fault rate should not exceed 2 hard page faults per second Not more than 1,000 concurrently active API requests Monitoring Service Monitoring Service Time from failure event to alert generated and dispatched should not exceed 25ms Disk I/O operation rate when alerts are not actively generated should be 0 Note Characteristics of the hardware on which the application runs are a crucial part of environment ■ constraints. for example, the startup time constraint placed on the smart client application in Table 1-1 may require a solid-state hard drive or a rotating hard drive speed of at least 7200RPm, at least 2GB of system memory, and a 1.2GHz or faster processor with ssE3 instruction support. These environment constraints are not worth repeating for every performance goal, but they are worth remembering during performance testing. 3
分享到:
收藏