Optics Communications 281 (2008) 4245–4253
Contents lists available at ScienceDirect
Optics Communications
j o u r n a l h o m e p a g e : w w w . e l s e v i e r . c o m / l o c a t e / o p t c o m
Multi-amplitude minimum shift keying modulation format for optical
communications
Le Nguyen Binh *
Centre for Telecommunications and Information Engineering, Department of Electrical and Computer Systems Engineering, Monash University, Clayton, Victoria 3168, Australia
Lehrstuhl für Nachrichen- und Übertragungstechnik, Technische Fakultaet der Christian Albretchs Universitaet zu Kiel,Kaiserstraße 2, D-24143 Kiel, Germany
a r t i c l e
i n f o
a b s t r a c t
Article history:
Received 14 February 2008
Received in revised form 11 April 2008
Accepted 11 April 2008
We present the multi-amplitude level minimum shift keying (M-ary MSK) modulation scheme for long
haul optically amplified transmission systems. New configurations of optical M-ary MSK transmitters
using two cascaded electro-optic phase modulators are proposed and its detailed operation principles
are expressed. The optical receiver for optical multi-amplitude MSK modulation format requires both
amplitude direct-detection and differential phase balanced-detection. Numerical results on spectral
haracteristics, dispersion tolerance and the relationship between amplitude and phase with launched
average power for long-haul transmission of multi-level MSK modulation format are presented. The dis-
persion tolerance shows that the 2-amplitude MSK at 80 Gb/s is well compared with 40 Gb/s binary MSK
modulation format.
Ó 2008 Elsevier B.V. All rights reserved.
1. Introduction
Recently, advanced modulation formats have attracted inten-
sive research for long haul optical transmission systems including
various amplitude and discrete differential phase modulation and
pulse shape formats (ASK-NRZ/RZ/CSRZ, DPSK and DQPSK-NRZ/
RZ/CSRZ). For the case of phase modulation the phases of the opti-
cal carrier are discretely coded with ‘‘0”, ‘‘p” (DPSK) or ‘‘0”, ‘‘p” and
‘‘p/2, �p/2” (DQPSK).
Although, the differential phase modulation techniques offer
better spectral properties, higher energy concentration in the
signal bands and more robustness to combat the non-linearity
impairments as compared to the amplitude modulation formats,
phase continuity would offer even better spectral efficiency and
at least 20 dB better in the suppression of the side lobes [1].
Minimum Shift Keying (MSK), exhibits a dual alternating frequency
between the two consecutive bit periods is considered to offer the
best scheme as this offers orthogonal property of the two-
frequency modulation of the carrier lightwaves embedded within
the consecutive bits. Furthermore it offers the most simplicity in
the implementation of the modulation in the photonic domain.
Single level MSK has been extensive investigated [2–4,8,9] but
there are no published works on multi-level or multi-amplitude
MSK but others [10–12]. The demand for pushing the bit rate
higher than 40–100 Gb/s ethernet has driven research into modu-
lation formats that would offer an effective higher bit rate using N
bits/symbol so that a symbol rate falls into the processing speed of
* Tel.: +49 8806311; fax: +49 8806303.
E-mail addresses: le.nguyen.binh@eng.monash.edu.au, lb@tf.uni-kiel.de
0030-4018/$ - see front matter Ó 2008 Elsevier B.V. All rights reserved.
doi:10.1016/j.optcom.2008.04.041
microwave digital circuitry. Multi-level modulation is thus attrac-
tive, especially for MSK modulation format, the M-ary MSK.
In this paper we thus present the generation and detection of
multi-amplitude level minimum shift keying modulation formats.
Novel structures of photonic transmitters using optical phase mod-
ulators are proposed. Differential non-coherent balanced receivers
are used for the detection of the phase evolution of multi-level
MSK optical signals in association with direct detection of the
amplitude levels. Transmission performance of 80 Gb/s 2-ampli-
tude MSK is achieved and equivalent to 40 Gb/s binary MSK. This
paper is thus organized as follows: Section 2 introduces the con-
cept of MSK and M-ary MSK modulation formats. Section 3 then
proposes the optical transmitter employing two cascaded optical
phase modulators (OPM), the operation principles and necessary
equations for generation of M-ary MSK optical signals. The detec-
tion of multi-amplitude MSK is also described with both the detec-
tion of the amplitude levels by direct detection and the detection of
the evolution of the continuous phase by balanced receiver in asso-
ciation with a delayed interferometer. Section 4 evaluates the
transmission performance of M-ary MSK by superimposing the
BER of both amplitude and phase error rates. 80 Gb/s 2-amplitude
MSK is compared with 40 Gb/s binary MSK modulation formats.
Section 5 makes some concluding remarks.
2. Multi-amplitude CPM (MACPM) and multi-amplitude MSK
(MAMSK)
One of the important digital modulation schemes is the mini-
mum shift keying (MSK), which combines many attractive charac-
teristics, including constant envelop, compact power spectrum,
�
4246
L.N. Binh / Optics Communications 281 (2008) 4245–4253
good error rate performance. In addition if multi-level amplitude is
incorporated the symbol rate that would be reduced and hence
more effective in long haul transmission and upgrading of one
specific channel of lower bit rate multi-wavelength optical trans-
port systems. This is the principal feature of the proposed modula-
tion scheme that we introduce in this section.
Multi-amplitude MSK (MAMSK) is a special case of MACPM
(multi-amplitude continuous phase modulation) that enables mul-
ti-level (PAM- or QAM-like) transmission scheme in combination
with the preservation of bandwidth-efficient transitional phase
continuity property of consecutive transmitted symbols (CPM-like
signals). The mapping scheme of data bits a and b to the continu-
ous changes of amplitudes and phase of the carriers in a dual-level
(2-amplitude levels) MSK is shown in Table 1.
In MACPM format, N-bit logic sequences are used for generating
signals which can be generally expressed as in Eq. (1) [1], thus the
optical signal s(t) can be represented as
sðtÞ ¼ AN cosðxct þ /Nðt; aÞÞ þ
where
Bm cosðxct þ /mðt; bmÞÞ
X
N�1
m¼1
X
n�1
ð1Þ
ð2Þ
ð3Þ
�
ak nT 6 t 6 ðn þ 1ÞT
/Nðt; aÞ ¼ phanqðt � nTÞ þ ph
k¼�1
/mðt; bmÞ ¼ pan h þ bmn þ 1
�
�
qðt � nTÞ
ak h þ bmk þ 1
mT 6 t 6 ðm þ 1ÞT
�
X
þ p
n�1
2
k¼�1
2
In a generalized MACPM transmitter, the values of logic se-
quences an and bmn are statistically independent and may be taken
from the set of {±1, ±3, ±5,. . .}. An and Bm are the amplitude levels of
the signal states, which are either in phase or p phase shift with the
largest level component at the end of nth symbol interval; q(t) is
the pulse shaping function and h is the frequency modulation in-
dex. Eqs. (2) and (4) show the constraints of consecutive phases
/m to maintaining the phase continuity characteristic of CPM
sequences.
In the special case of MAMSK, h = 1/2 and the phase shaping
function q(t�nT) is a periodic ramp signal with duty cycle of 4T.
Eqs. (2) and (4) are, therefore, simplified to Eqs. (5) and (7),
respectively.
n�1
X
�
þ ph
/Nðt; aÞ ¼ phan
t � nT
/mðt; bmÞ ¼ pIn h þ bmn þ 1
�
�
bk h þ bmk þ 1
mT 6 t 6 ðm þ 1ÞT
t � nT
�
X
ak nT 6 t 6 ðn þ 1ÞT
þ p
k¼�1
n�1
2
T
T
ð4Þ
ð5Þ
k¼�1
2
The optical MAMSK transmitter configuration with N = 2 and the
signal space trajectories in case of N = 2 and 3 following those of
standard MSK schemes [1].
Thus there are two requirements for a MAMSK transmitter:
firstly, it must provide the switching of the amplitude level and
the phase variation of the lightwaves and secondly the synchroni-
Table 1
Mapping of data information in dual-level MSK format
a
1
1
�1
�1
b
1
�1
1
�1
Remarks on signal constellation
Amplitude unchanged, phase continuously increased
Amplitude unchanged, phase continuously decreased
Amplitude changed, phase continuously increased
Amplitude changed, phase continuously decreased
zation of the continuity of the phase of the lightwave carrier at the
transitional instant between the symbols.
3. Optical MSK and multi-amplitude MSK transmitters
The optical MSK transmitters from Refs [2–4] can be integrated
in the proposed generation scheme of optical MAMSK signals.
However, in this paper, we propose a new simple-in-implementa-
tion optical MSK transmitter configuration employing two high-
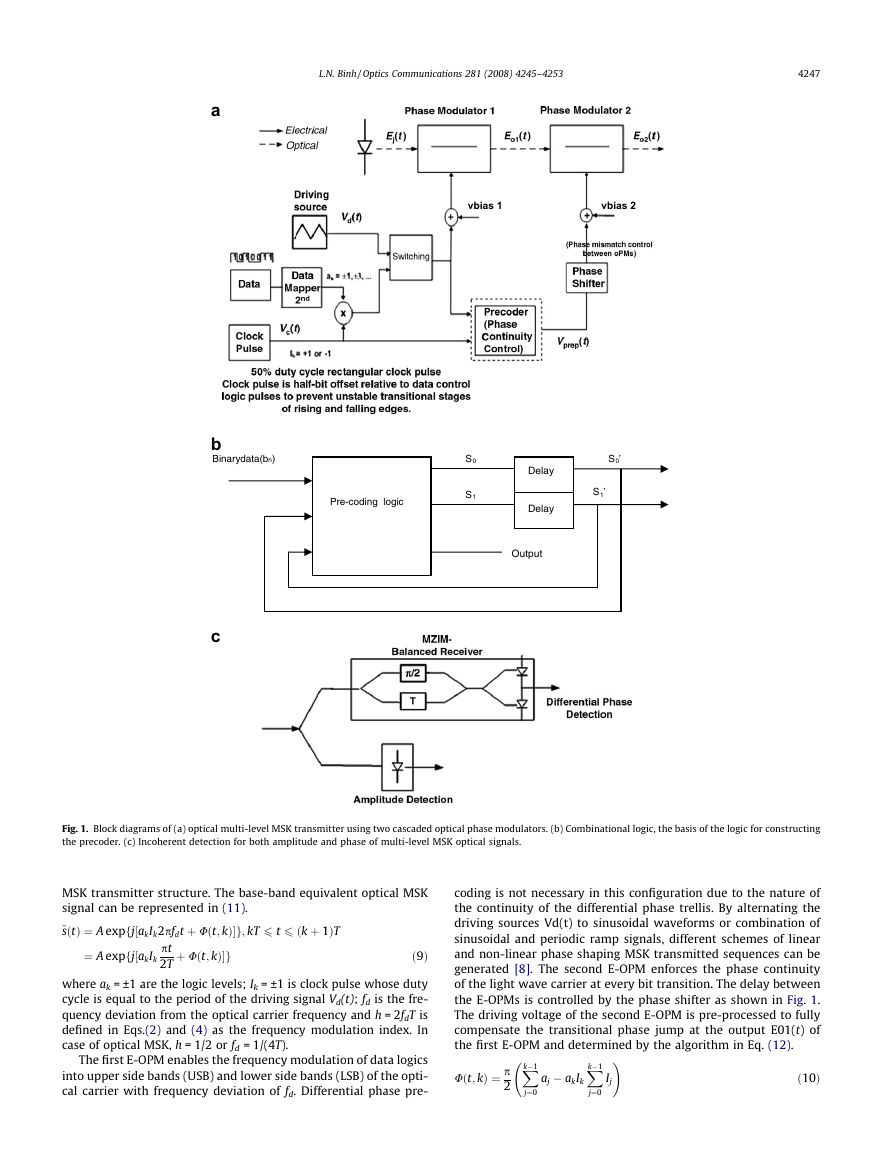
speed cascaded electro-optic phase modulators (E-OPMs) as shown
in the block diagrams of Fig. 1a.
The first OPM plays the role of modulating the binary data logic
into two carrier frequencies deviating from the optical carrier of
the laser source by a quarter of the bit rate. The second OPM
enforces the phase continuity of the lightwave carrier at every
bit transition. The driving voltage of this second OPM is pre-coded
in such a way that the phase discrepancy due to frequency modu-
lation of the first OPM is compensated, hence preserving the phase
continuity characteristic of MSK signal.
1 þ bnS0
1 þ bnS0
1 þ bnS0
0S0
0S0
0S0
0S0
1 þ bnS0
The mapping table of Table 1 can be used to derive the logic
table that we can then construct combinational logic diagram.
For positive half cycle cosine wave and positive half cycle sine
wave, the output is 1; for negative half cycle triangular wave (for
linear) (or cosine wave) and negative half cycle of the triangular
wave sine wave, the output is 0. Then, Karnaugh maps can then
be constructed to derive the logic gates within the pre-coding logic
block, based on the truth table. The following three pre-coding
logic equations can be derived for binary MSK (see Fig. 1b):
S0 ¼ bnS0
S1 ¼ S0
1 ¼ bnS0
Output ¼ S0
ð6Þ
ð7Þ
ð8Þ
For higher level it is not difficult to derive the logic states but
much easier by using logic block set of MATLAB Simulink1 on which
we have based our simulation model. These logical states S0
1 and
S0
0are then conditioned to appropriate voltage level which is then
fed to the switching circuit (see Fig. 1a) to control the timing of
the switching the sections of the triangular wave (or sine wave gen-
erator) to enforce the modulation of the phase of the carrier by driv-
ing the optical phase modulator. The amplitude of the carrier is set
by the mapper shown in Fig. 1a that would map the number of bits
into equivalent numbers as indicated.
1
1
Utilizing this double phase modulation configuration, different
types of linear and non-linear CPM phase shaping signals including
MSK, strongly-linear MSK and weakly nonlinear-sinusoidal MSK
can be generated [9]. The optical spectra of the modulation scheme
obtained confirm the bandwidth efficiency of this novel optical
MSK transmitter (shown later in Fig. 6). If the triangular wave gen-
erator of Fig. 1a is replaced by a sinusoidal wave then the phase
variation over the period of a symbol is not linear but nonlinear.
This phase nonlinearity is not high if the amplitude of the wave
is not large and in this case we term the modulation scheme as
weakly nonlinear MSK. On the other hand if the amplitude is high
then the phase variation is strongly departing from the linear trian-
gular trend and this case is termed as strongly nonlinear MSK
modulation.
E-OPMs and E-O interferometers operating at high frequency
using resonant-type electrodes have been studied and proposed
in [5,6]. In addition, high-speed electronic driving circuits evolved
with the ASIC technology using 0.1 lm GaAs P-HEMT or InP HEMTs
[7] enables the feasibility in realization of the proposed optical
1 See details of MATLAB Simulink at http://www.mathworks.com/
�
L.N. Binh / Optics Communications 281 (2008) 4245–4253
4247
vbias 1
vbias 2
Pre-coding logic
S0’
S1’
S0
S1
Delay
Delay
Output
a
b
Binarydata(bn)
c
Fig. 1. Block diagrams of (a) optical multi-level MSK transmitter using two cascaded optical phase modulators. (b) Combinational logic, the basis of the logic for constructing
the precoder. (c) Incoherent detection for both amplitude and phase of multi-level MSK optical signals.
MSK transmitter structure. The base-band equivalent optical MSK
signal can be represented in (11).
~sðtÞ ¼ A expfj½akIk2pfdt þ Uðt; kÞg; kT 6 t 6 ðk þ 1ÞT
¼ A expfj½akIk
pt
2T
þ Uðt; kÞg
ð9Þ
where ak = ±1 are the logic levels; Ik = ±1 is clock pulse whose duty
cycle is equal to the period of the driving signal Vd(t); fd is the fre-
quency deviation from the optical carrier frequency and h = 2fdT is
defined in Eqs.(2) and (4) as the frequency modulation index. In
case of optical MSK, h = 1/2 or fd = 1/(4T).
The first E-OPM enables the frequency modulation of data logics
into upper side bands (USB) and lower side bands (LSB) of the opti-
cal carrier with frequency deviation of fd. Differential phase pre-
coding is not necessary in this configuration due to the nature of
the continuity of the differential phase trellis. By alternating the
driving sources Vd(t) to sinusoidal waveforms or combination of
sinusoidal and periodic ramp signals, different schemes of linear
and non-linear phase shaping MSK transmitted sequences can be
generated [8]. The second E-OPM enforces the phase continuity
of the light wave carrier at every bit transition. The delay between
the E-OPMs is controlled by the phase shifter as shown in Fig. 1.
The driving voltage of the second E-OPM is pre-processed to fully
compensate the transitional phase jump at the output E01(t) of
the first E-OPM and determined by the algorithm in Eq. (12).
!
aj � akIk
Ij
ð10Þ
X
k�1
j¼0
Uðt; kÞ ¼ p
2
X
k�1
j¼0
�
4248
L.N. Binh / Optics Communications 281 (2008) 4245–4253
The second E-OPM receives the data gated signals which once ap-
plied to its electrode may create spikes if there are timing errors
of the synchronization of electronic signals. So in order to mitigate
the effects of overshooting at rising and falling edges of the elec-
tronic circuits, the clock pulse Vc(t) is offset by one bit delay with
the driving voltages Vd(t).
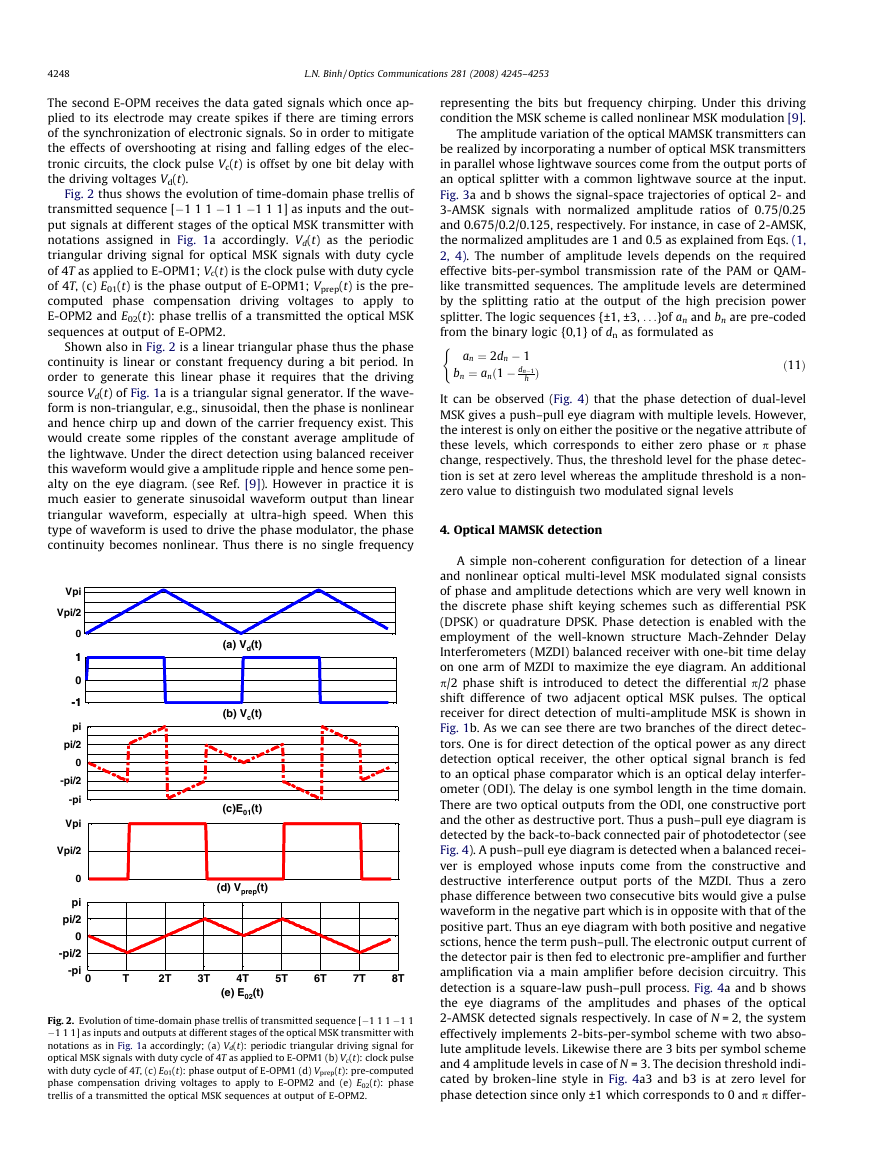
Fig. 2 thus shows the evolution of time-domain phase trellis of
transmitted sequence [�1 1 1 �1 1 �1 1 1] as inputs and the out-
put signals at different stages of the optical MSK transmitter with
notations assigned in Fig. 1a accordingly. Vd(t) as the periodic
triangular driving signal for optical MSK signals with duty cycle
of 4T as applied to E-OPM1; Vc(t) is the clock pulse with duty cycle
of 4T, (c) E01(t) is the phase output of E-OPM1; Vprep(t) is the pre-
computed phase compensation driving voltages to apply to
E-OPM2 and E02(t): phase trellis of a transmitted the optical MSK
sequences at output of E-OPM2.
Shown also in Fig. 2 is a linear triangular phase thus the phase
continuity is linear or constant frequency during a bit period. In
order to generate this linear phase it requires that the driving
source Vd(t) of Fig. 1a is a triangular signal generator. If the wave-
form is non-triangular, e.g., sinusoidal, then the phase is nonlinear
and hence chirp up and down of the carrier frequency exist. This
would create some ripples of the constant average amplitude of
the lightwave. Under the direct detection using balanced receiver
this waveform would give a amplitude ripple and hence some pen-
alty on the eye diagram. (see Ref. [9]). However in practice it is
much easier to generate sinusoidal waveform output than linear
triangular waveform, especially at ultra-high speed. When this
type of waveform is used to drive the phase modulator, the phase
continuity becomes nonlinear. Thus there is no single frequency
Vpi
Vpi/2
0
1
1
0
-1
-1
pi
pi/2
0
-pi/2
-pi
Vpi
Vpi/2
0
pi
pi/2
0
-pi/2
-pi
(a) Vd(t)
(b) Vc(t)
(c)E01(t)
(d) Vprep(t)
0
T
2T
3T
4T
5T
6T
7T
8T
(e) E02(t)
Fig. 2. Evolution of time-domain phase trellis of transmitted sequence [�1 1 1 �1 1
�1 1 1] as inputs and outputs at different stages of the optical MSK transmitter with
notations as in Fig. 1a accordingly; (a) Vd(t): periodic triangular driving signal for
optical MSK signals with duty cycle of 4T as applied to E-OPM1 (b) Vc(t): clock pulse
with duty cycle of 4T, (c) E01(t): phase output of E-OPM1 (d) Vprep(t): pre-computed
phase compensation driving voltages to apply to E-OPM2 and (e) E02(t): phase
trellis of a transmitted the optical MSK sequences at output of E-OPM2.
representing the bits but frequency chirping. Under this driving
condition the MSK scheme is called nonlinear MSK modulation [9].
The amplitude variation of the optical MAMSK transmitters can
be realized by incorporating a number of optical MSK transmitters
in parallel whose lightwave sources come from the output ports of
an optical splitter with a common lightwave source at the input.
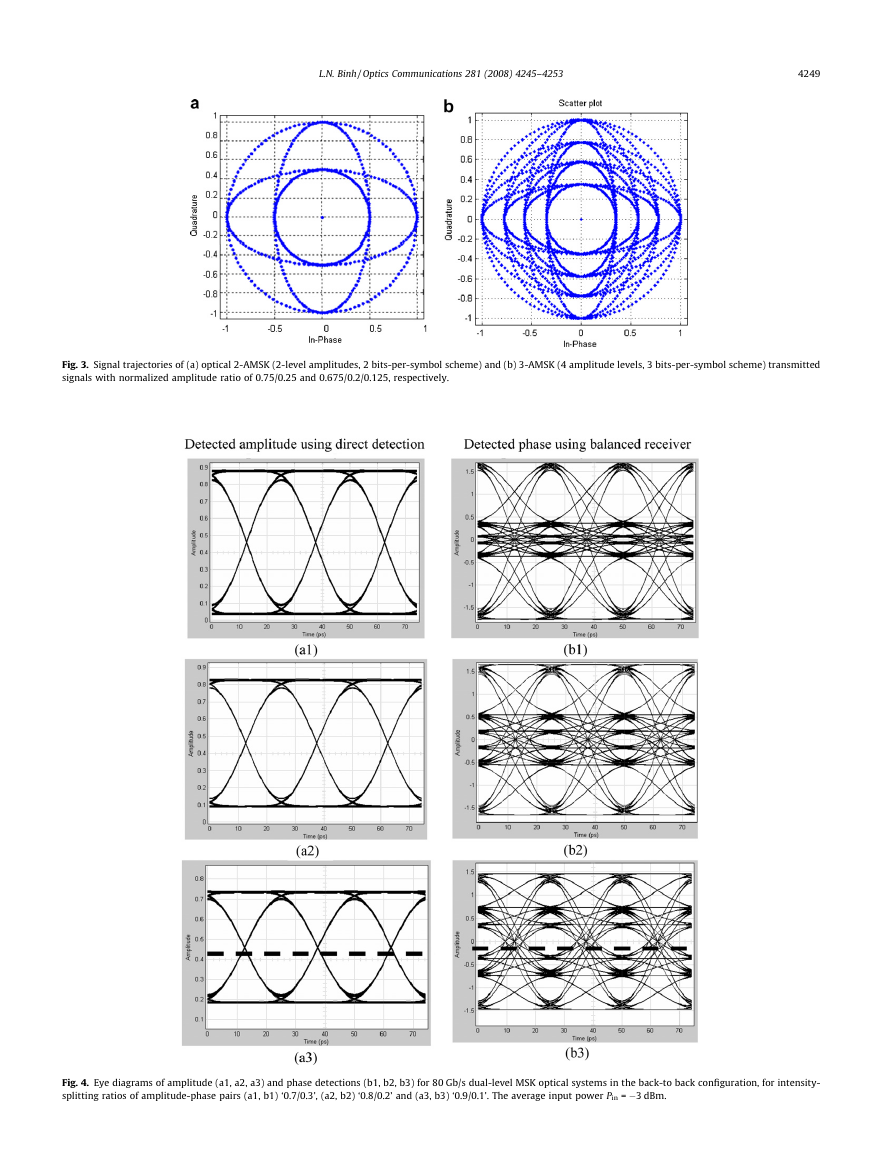
Fig. 3a and b shows the signal-space trajectories of optical 2- and
3-AMSK signals with normalized amplitude ratios of 0.75/0.25
and 0.675/0.2/0.125, respectively. For instance, in case of 2-AMSK,
the normalized amplitudes are 1 and 0.5 as explained from Eqs. (1,
2, 4). The number of amplitude levels depends on the required
effective bits-per-symbol transmission rate of the PAM or QAM-
like transmitted sequences. The amplitude levels are determined
by the splitting ratio at the output of the high precision power
splitter. The logic sequences {±1, ±3, . . .}of an and bn are pre-coded
from the binary logic {0,1} of dn as formulated as
(
an ¼ 2dn � 1
bn ¼ anð1 � dn�1
h Þ
ð11Þ
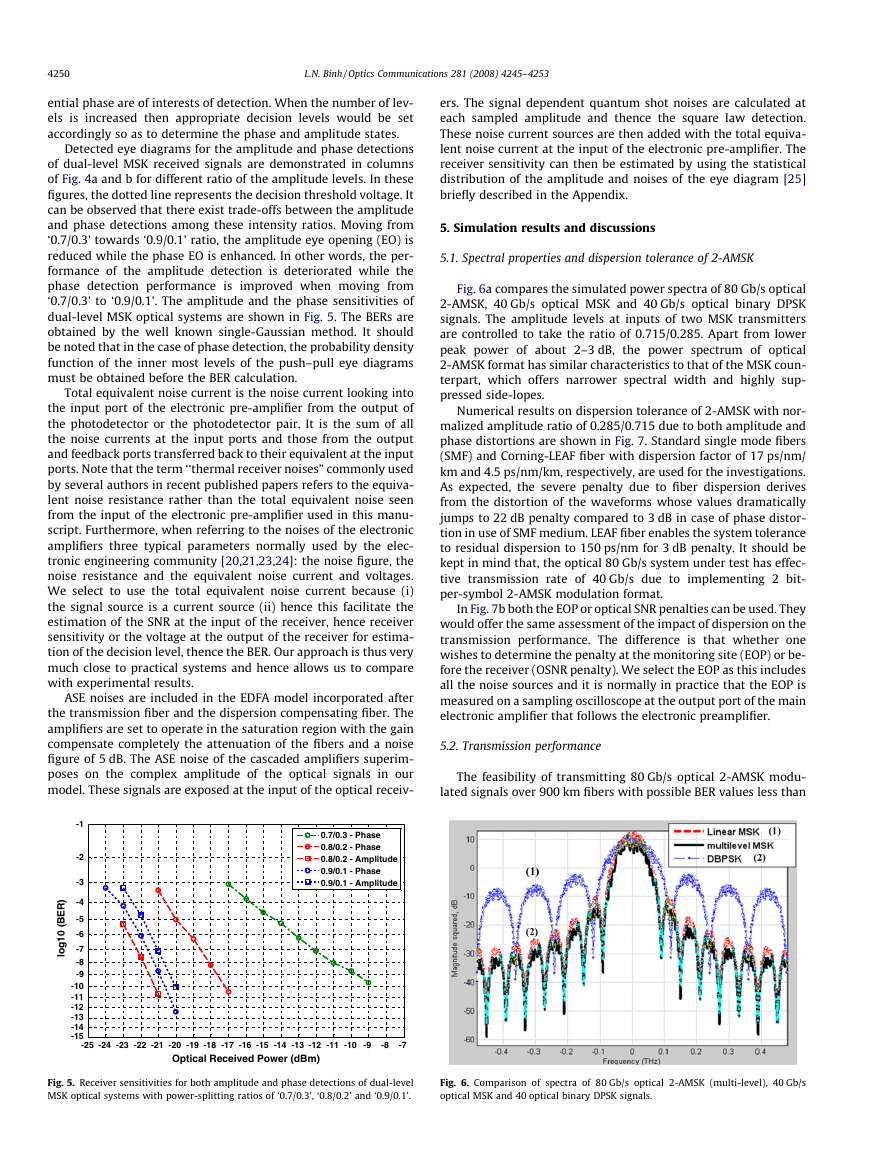
It can be observed (Fig. 4) that the phase detection of dual-level
MSK gives a push–pull eye diagram with multiple levels. However,
the interest is only on either the positive or the negative attribute of
these levels, which corresponds to either zero phase or p phase
change, respectively. Thus, the threshold level for the phase detec-
tion is set at zero level whereas the amplitude threshold is a non-
zero value to distinguish two modulated signal levels
4. Optical MAMSK detection
A simple non-coherent configuration for detection of a linear
and nonlinear optical multi-level MSK modulated signal consists
of phase and amplitude detections which are very well known in
the discrete phase shift keying schemes such as differential PSK
(DPSK) or quadrature DPSK. Phase detection is enabled with the
employment of the well-known structure Mach-Zehnder Delay
Interferometers (MZDI) balanced receiver with one-bit time delay
on one arm of MZDI to maximize the eye diagram. An additional
p/2 phase shift is introduced to detect the differential p/2 phase
shift difference of two adjacent optical MSK pulses. The optical
receiver for direct detection of multi-amplitude MSK is shown in
Fig. 1b. As we can see there are two branches of the direct detec-
tors. One is for direct detection of the optical power as any direct
detection optical receiver, the other optical signal branch is fed
to an optical phase comparator which is an optical delay interfer-
ometer (ODI). The delay is one symbol length in the time domain.
There are two optical outputs from the ODI, one constructive port
and the other as destructive port. Thus a push–pull eye diagram is
detected by the back-to-back connected pair of photodetector (see
Fig. 4). A push–pull eye diagram is detected when a balanced recei-
ver is employed whose inputs come from the constructive and
destructive interference output ports of the MZDI. Thus a zero
phase difference between two consecutive bits would give a pulse
waveform in the negative part which is in opposite with that of the
positive part. Thus an eye diagram with both positive and negative
sctions, hence the term push–pull. The electronic output current of
the detector pair is then fed to electronic pre-amplifier and further
amplification via a main amplifier before decision circuitry. This
detection is a square-law push–pull process. Fig. 4a and b shows
the eye diagrams of the amplitudes and phases of the optical
2-AMSK detected signals respectively. In case of N = 2, the system
effectively implements 2-bits-per-symbol scheme with two abso-
lute amplitude levels. Likewise there are 3 bits per symbol scheme
and 4 amplitude levels in case of N = 3. The decision threshold indi-
cated by broken-line style in Fig. 4a3 and b3 is at zero level for
phase detection since only ±1 which corresponds to 0 and p differ-
�
L.N. Binh / Optics Communications 281 (2008) 4245–4253
4249
Fig. 3. Signal trajectories of (a) optical 2-AMSK (2-level amplitudes, 2 bits-per-symbol scheme) and (b) 3-AMSK (4 amplitude levels, 3 bits-per-symbol scheme) transmitted
signals with normalized amplitude ratio of 0.75/0.25 and 0.675/0.2/0.125, respectively.
Fig. 4. Eye diagrams of amplitude (a1, a2, a3) and phase detections (b1, b2, b3) for 80 Gb/s dual-level MSK optical systems in the back-to back configuration, for intensity-
splitting ratios of amplitude-phase pairs (a1, b1) ‘0.7/0.3’, (a2, b2) ‘0.8/0.2’ and (a3, b3) ‘0.9/0.1’. The average input power Pin = �3 dBm.
�
4250
L.N. Binh / Optics Communications 281 (2008) 4245–4253
ential phase are of interests of detection. When the number of lev-
els is increased then appropriate decision levels would be set
accordingly so as to determine the phase and amplitude states.
Detected eye diagrams for the amplitude and phase detections
of dual-level MSK received signals are demonstrated in columns
of Fig. 4a and b for different ratio of the amplitude levels. In these
figures, the dotted line represents the decision threshold voltage. It
can be observed that there exist trade-offs between the amplitude
and phase detections among these intensity ratios. Moving from
‘0.7/0.3’ towards ‘0.9/0.1’ ratio, the amplitude eye opening (EO) is
reduced while the phase EO is enhanced. In other words, the per-
formance of the amplitude detection is deteriorated while the
phase detection performance is improved when moving from
‘0.7/0.3’ to ‘0.9/0.1’. The amplitude and the phase sensitivities of
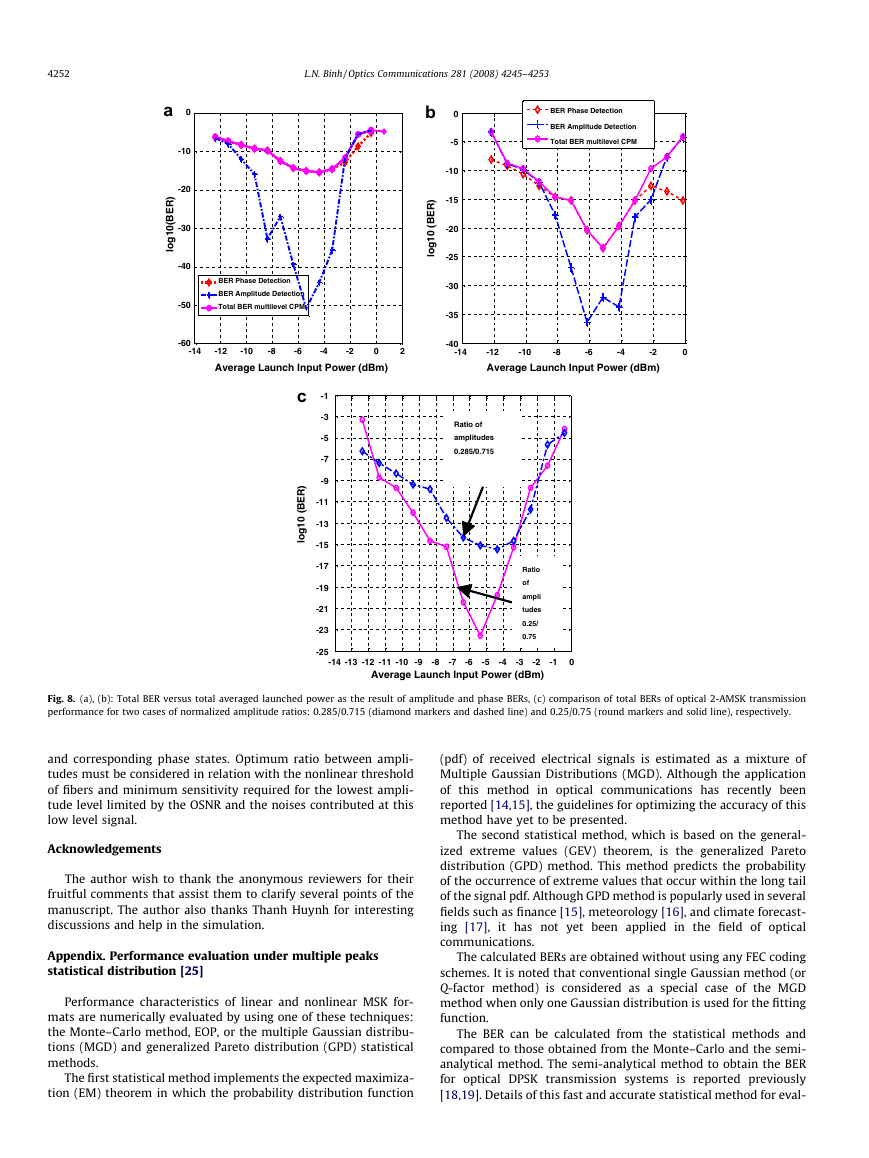
dual-level MSK optical systems are shown in Fig. 5. The BERs are
obtained by the well known single-Gaussian method. It should
be noted that in the case of phase detection, the probability density
function of the inner most levels of the push–pull eye diagrams
must be obtained before the BER calculation.
Total equivalent noise current is the noise current looking into
the input port of the electronic pre-amplifier from the output of
the photodetector or the photodetector pair. It is the sum of all
the noise currents at the input ports and those from the output
and feedback ports transferred back to their equivalent at the input
ports. Note that the term ‘‘thermal receiver noises” commonly used
by several authors in recent published papers refers to the equiva-
lent noise resistance rather than the total equivalent noise seen
from the input of the electronic pre-amplifier used in this manu-
script. Furthermore, when referring to the noises of the electronic
amplifiers three typical parameters normally used by the elec-
tronic engineering community [20,21,23,24]: the noise figure, the
noise resistance and the equivalent noise current and voltages.
We select to use the total equivalent noise current because (i)
the signal source is a current source (ii) hence this facilitate the
estimation of the SNR at the input of the receiver, hence receiver
sensitivity or the voltage at the output of the receiver for estima-
tion of the decision level, thence the BER. Our approach is thus very
much close to practical systems and hence allows us to compare
with experimental results.
ASE noises are included in the EDFA model incorporated after
the transmission fiber and the dispersion compensating fiber. The
amplifiers are set to operate in the saturation region with the gain
compensate completely the attenuation of the fibers and a noise
figure of 5 dB. The ASE noise of the cascaded amplifiers superim-
poses on the complex amplitude of the optical signals in our
model. These signals are exposed at the input of the optical receiv-
ers. The signal dependent quantum shot noises are calculated at
each sampled amplitude and thence the square law detection.
These noise current sources are then added with the total equiva-
lent noise current at the input of the electronic pre-amplifier. The
receiver sensitivity can then be estimated by using the statistical
distribution of the amplitude and noises of the eye diagram [25]
briefly described in the Appendix.
5. Simulation results and discussions
5.1. Spectral properties and dispersion tolerance of 2-AMSK
Fig. 6a compares the simulated power spectra of 80 Gb/s optical
2-AMSK, 40 Gb/s optical MSK and 40 Gb/s optical binary DPSK
signals. The amplitude levels at inputs of two MSK transmitters
are controlled to take the ratio of 0.715/0.285. Apart from lower
peak power of about 2–3 dB, the power spectrum of optical
2-AMSK format has similar characteristics to that of the MSK coun-
terpart, which offers narrower spectral width and highly sup-
pressed side-lopes.
Numerical results on dispersion tolerance of 2-AMSK with nor-
malized amplitude ratio of 0.285/0.715 due to both amplitude and
phase distortions are shown in Fig. 7. Standard single mode fibers
(SMF) and Corning-LEAF fiber with dispersion factor of 17 ps/nm/
km and 4.5 ps/nm/km, respectively, are used for the investigations.
As expected, the severe penalty due to fiber dispersion derives
from the distortion of the waveforms whose values dramatically
jumps to 22 dB penalty compared to 3 dB in case of phase distor-
tion in use of SMF medium. LEAF fiber enables the system tolerance
to residual dispersion to 150 ps/nm for 3 dB penalty. It should be
kept in mind that, the optical 80 Gb/s system under test has effec-
tive transmission rate of 40 Gb/s due to implementing 2 bit-
per-symbol 2-AMSK modulation format.
In Fig. 7b both the EOP or optical SNR penalties can be used. They
would offer the same assessment of the impact of dispersion on the
transmission performance. The difference is that whether one
wishes to determine the penalty at the monitoring site (EOP) or be-
fore the receiver (OSNR penalty). We select the EOP as this includes
all the noise sources and it is normally in practice that the EOP is
measured on a sampling oscilloscope at the output port of the main
electronic amplifier that follows the electronic preamplifier.
5.2. Transmission performance
The feasibility of transmitting 80 Gb/s optical 2-AMSK modu-
lated signals over 900 km fibers with possible BER values less than
)
R
E
B
(
0
1
g
o
l
-1
-2
-3
-4
0.7/0.3 - Phase
0.8/0.2 - Phase
0.8/0.2 - Amplitude
0.9/0.1 - Phase
0.9/0.1 - Amplitude
-5
-6
-7
-8
-9
-10
-11
-12
-13
-14
-15
-25 -24 -23 -22 -21 -20 -19 -18 -17 -16 -15 -14 -13 -12 -11 -10 -9
-8
-7
Optical Received Power (dBm)
Fig. 5. Receiver sensitivities for both amplitude and phase detections of dual-level
MSK optical systems with power-splitting ratios of ‘0.7/0.3’, ‘0.8/0.2’ and ‘0.9/0.1’.
Fig. 6. Comparison of spectra of 80 Gb/s optical 2-AMSK (multi-level), 40 Gb/s
optical MSK and 40 optical binary DPSK signals.
�
L.N. Binh / Optics Communications 281 (2008) 4245–4253
4251
)
B
d
(
y
t
l
a
n
e
P
n
e
p
O
e
y
E
i
s
n
o
i
t
r
o
t
s
D
e
s
a
h
P
d
n
a
e
d
u
t
i
l
p
m
A
f
o
24
22
20
18
16
14
12
10
8
6
4
2
0
-200
EOP Amp LEAF
EOP Amp SMF28
EOP Phase LEAF
EOP Phase SMF
-150
-100
-50
0
50
100
150
200
Residual Dispersion (ps/nm)
Fig. 7. Numerical results on dispersion tolerance of 80 Gb/s optical 2-AMSK
(effectively 40 Gb/s transmission rate) with normalized amplitude ratio of 0.285/
0.715 due to both waveform and phase distortions.
1e-12 is numerically demonstrated in Fig. 8. The simulation con-
sists of 80 Gbps random generator with 128-bit sequence, 10 spans
of 90 km Vascade fibers (60 km + 17 ps/nm/km and 30 km of
�34 ps/nm/km and also fully compensated dispersion slope), opti-
cal filter bandwidth of 80 GHz. The main reason for us to use
Vascade fibers because their dispersion and compensating proper-
ties are well matched over the spectral range of interests. Naturally
other types of fibers such as standard SMF, Corning LEAF can be
used together with dispersion compensating modules. The optical
amplifiers (Er: doped Fiber amplifier-EDFA) are incorporated with
a gain of 19 dB to compensate for the loss of the transmission fiber
and a noise figure of 5 dB. Accumulated noises of cascaded ampli-
fiers are measured in the model and compared with experimental
values which agree well with each other. The quantum shot noises
which are signal dependent are also built in the model and checked
with typical values in practice. These quantum shot noises are very
important in multi- amplitude level modulation because the con-
tribution of noises at each level would be different. Electronic noise
p
of the receiver is modelled with equivalent noise current density of
and dark current of 2 � 10 nA (2
electrical amplifier of 20 pA/
photodiodes for balanced receiver). Thus with the total equivalent
electronic noises as seen from the input of the electronic preampli-
fier, our transmission model really represents a very close to exper-
imental
in which the
polarization mode dispersion (PMD) and statistical fluctuation
due to environment can be controlled and suppressed.
transmission laboratory environment
ffiffiffiffiffiffi
Hz
This configuration yields the receiver sensitivity at BER = 1e-9
in back-to-back case to be approximately �23 dBm and
�25.5 dBm for 2-AMSK and MSK optical receivers respectively.
As explained above from Fig. 6, the peak power of 2-AMSK is
approximately 2–3 dB lower than that of its MSK counterpart.
The eye diagrams are obtained after a 9th order Bessel electrical fil-
ter with a bandwidth of 32 GHz. Launched peak input power is var-
ied from �10 to +3 dBm which corresponds to average powers
ranging from �12.5 dBm to �0.5 dBm. Fig. 8a and b shows the total
BER as the result of the performance of amplitude, phase detection
in case of normalized amplitude levels of 0.285/0.715 and 0.25/
0.75 ratios, respectively. In Fig. 8c, the plot of transmission perfor-
mance with diamond markers and dashed line represents the case
of normalized amplitude levels of 0.285/0.715 whereas round
markers and solid line curve are used in the 0.25/0.75 counterpart.
The optimal BERs of 1e-15 and 1e-23 are obtained at average input
power of �4.5 and �5.5 dBm, respectively. These results raise the
needs of optimizing the amplitude levels for the best BER of optical
2-AMSK signal transmission.
In our simulation model the nonlinear effects due to self phase
modulation, four wave mixing or stimulated Raman scattering are
included in the nonlinear Schroedinger equation and the split step
Fourier method that represents the evolution of the sampled
signals through the fibers. The amplitude of the lightwave signals
is set by varying the average optical power at the input of the
transmission fiber of the fist span. This power can set above or be-
low the nonlinear power threshold of the transmission fiber. The
penalty on the eye diagram can then be obtained.
Noises are superimposed on the signal amplitudes at each sam-
pled instant. The NF of EDFAs are set at 5 dB. The OSNR is set
depending on the optical power at the input of the transmission
fiber which is set below the nonlinear threshold (3 dBm). So OSNR
varies according to our study of dispersion tolerance of chromatic
dispersion or nonlinear impact. If it is at the region just below the
nonlinear threshold then the OSNR (0.1 nm) is about 13–19 dB.
Regarding the optimum receiver sensitivity of �5 dBm of the
proposed MAMSK modulation scheme, this can be compared with
the experimental results reported by Gnauck et al. [26] for on–off
keying and differential phase shift keying (DPSK) formats. The
most appropriate format to be used for comparison is the 67%
BAL DPSK which uses RZ DPSK with pulse width of 67% bit period,
note that no NRZ format. Note that no NRZ format was used in [26].
With the balanced receiver the optimum value is estimated at
�1 dBm for a BER of 1e-9 for 42.7 Gb/s Bal DPSK transmission over
a dispersion compensated loop of 330 km incorporating (4 � 2+1)
EDFAs plus Raman distributed amplification. After 1980 km trans-
mission the noises due to EDFAs are higher than our proposed
transmission system and thus higher launched power is required.
While with our sensitivity of �5 dBm, the BER is 1e-20 or lower
for a ratio of the amplitude levels of 0.25/0.75. This sensitivity level
is reasonable as under our simulation we expect the noises due to
the switching of the data stream in and out of the circulating loop
of [26] do not exist.
6. Conclusion
We have proposed a modulation scheme based on multi-ampli-
tude and continuous phase, the multi-amplitude minimum shift
keying scheme for effective enhancement of the transmission
capacity but detection at lower symbol rate. Also proposed is a
new configuration and simple implementation of optical MSK
transmitters using two cascaded E-OPMs which reduce the com-
plexity of photonic components for generation of multi-amplitude
MSK optical signals. These modular optical MSK transmitter
structures can then be integrated in parallel to form optical mul-
ti-amplitude MSK transmitters. The number of signal amplitude
levels and phase states can be easily increased by cascading or cas-
cading optical binary MSK transmitters. Comparison of spectral
properties compared to the MSK and DPSK counterparts and simu-
lated dispersion tolerance results demonstrate the effectiveness of
the modulation scheme. Numerical results of the transmission per-
formance over 900 km multi-span length have been presented for
two different cases of normalized amplitude ratios of the 2-AMSK
modulation format.
We have yet optimized the ratio of the amplitude levels. Ideally
the amplitude level should be 50:50 but due to the signal-depen-
dent quantum shot noises the noise contributed due to the upper
amplitude level
is higher than the lower level and we have
achieved the best receiver sensitivity at the ratio 0.285/0.75 for
dual level. Further works will be conducted for the optimization
of the amplitude level ratio and phase ratio.
Obviously higher number of amplitude levels can be designed
without difficulty. However the optical receivers must be re-
considered due to different contribution of noises at each level
�
4252
L.N. Binh / Optics Communications 281 (2008) 4245–4253
a
0
)
R
E
B
(
0
1
g
o
l
-10
-20
-30
-40
-50
-60
-14
b
)
R
E
B
(
0
1
g
o
l
0
-5
-10
-15
-20
-25
-30
-35
2
-40
-14
BER Phase Detection
BER Amplitude Detection
Total BER multilevel CPM
-10
-12
-2
Average Launch Input Power (dBm)
-8
-6
-4
0
BER Phase Detection
BER Amplitude Detection
Total BER multilevel CPM
-10
-12
Average Launch Input Power (dBm)
-8
-6
-4
-2
0
c
)
R
E
B
(
0
1
g
o
l
-1
-3
-5
-7
-9
-11
-13
-15
-17
-19
-21
-23
Ratio of
amplitudes
0.285/0.715
Ratio
of
ampli
tudes
0.25/
0.75
-25
-14 -13 -12 -11 -10 -9 -8 -7 -6 -5 -4 -3 -2 -1
0
Average Launch Input Power (dBm)
Fig. 8. (a), (b): Total BER versus total averaged launched power as the result of amplitude and phase BERs, (c) comparison of total BERs of optical 2-AMSK transmission
performance for two cases of normalized amplitude ratios: 0.285/0.715 (diamond markers and dashed line) and 0.25/0.75 (round markers and solid line), respectively.
and corresponding phase states. Optimum ratio between ampli-
tudes must be considered in relation with the nonlinear threshold
of fibers and minimum sensitivity required for the lowest ampli-
tude level limited by the OSNR and the noises contributed at this
low level signal.
Acknowledgements
The author wish to thank the anonymous reviewers for their
fruitful comments that assist them to clarify several points of the
manuscript. The author also thanks Thanh Huynh for interesting
discussions and help in the simulation.
Appendix. Performance evaluation under multiple peaks
statistical distribution [25]
Performance characteristics of linear and nonlinear MSK for-
mats are numerically evaluated by using one of these techniques:
the Monte–Carlo method, EOP, or the multiple Gaussian distribu-
tions (MGD) and generalized Pareto distribution (GPD) statistical
methods.
The first statistical method implements the expected maximiza-
tion (EM) theorem in which the probability distribution function
(pdf) of received electrical signals is estimated as a mixture of
Multiple Gaussian Distributions (MGD). Although the application
of this method in optical communications has recently been
reported [14,15], the guidelines for optimizing the accuracy of this
method have yet to be presented.
The second statistical method, which is based on the general-
ized extreme values (GEV) theorem, is the generalized Pareto
distribution (GPD) method. This method predicts the probability
of the occurrence of extreme values that occur within the long tail
of the signal pdf. Although GPD method is popularly used in several
fields such as finance [15], meteorology [16], and climate forecast-
ing [17],
it has not yet been applied in the field of optical
communications.
The calculated BERs are obtained without using any FEC coding
schemes. It is noted that conventional single Gaussian method (or
Q-factor method) is considered as a special case of the MGD
method when only one Gaussian distribution is used for the fitting
function.
The BER can be calculated from the statistical methods and
compared to those obtained from the Monte–Carlo and the semi-
analytical method. The semi-analytical method to obtain the BER
for optical DPSK transmission systems is reported previously
[18,19]. Details of this fast and accurate statistical method for eval-
�



 2023年江西萍乡中考道德与法治真题及答案.doc
 2012年重庆南川中考生物真题及答案.doc
 2013年江西师范大学地理学综合及文艺理论基础考研真题.doc
 2020年四川甘孜小升初语文真题及答案I卷.doc
 2020年注册岩土工程师专业基础考试真题及答案.doc
 2023-2024学年福建省厦门市九年级上学期数学月考试题及答案.doc
 2021-2022学年辽宁省沈阳市大东区九年级上学期语文期末试题及答案.doc
 2022-2023学年北京东城区初三第一学期物理期末试卷及答案.doc
 2018上半年江西教师资格初中地理学科知识与教学能力真题及答案.doc
 2012年河北国家公务员申论考试真题及答案-省级.doc
 2020-2021学年江苏省扬州市江都区邵樊片九年级上学期数学第一次质量检测试题及答案.doc
 2022下半年黑龙江教师资格证中学综合素质真题及答案.doc