User Manual for
T A S S E L
T A S S E L
-Trait Analysis by aSSociation, Evolution and Linkage
Version 3
The Buckler Lab at Cornell University
(December 22, 2011)
www.maizegenetics.net/tassel
�
Disclaimer: While the Buckler Lab at Cornell University has performed extensive testing and results are,
in general, reliable, correct or appropriate results are not guaranteed for any specific set of data. It is
strongly recommended that users validate TASSEL results with other software.
Further help: Additional help is available beyond this document. Users are welcome to report bugs,
request new features through the TASSEL website. Questions are also welcome to our current team
members. For more quick and precise answers, please address your questions to the most pertinent
person:
Tassel User Group
(recommended)
General Information
http://groups.google.com/group/tassel
tassel@googlegroups.com
Ed Buckler (Project leader)
Data import, GDPC, Pipeline
Statistical analysis
esb33@cornell.edu
Terry Casstevens
tmc46@cornell.edu
Peter Bradbury
pjb39@cornell.edu
Zhiwu Zhang
zz19@cornell.edu
Contributors: Yogesh Ramdoss, Michael E. Oak, and Karin J. Holmberg, N. Stevens, and Yang Zhang.
ii
The TASSEL project is supported by the National Science Foundation and the USDA-ARS.
Main Web Site: http://www.maizegenetics.net/tassel
Open source code: http://sourceforge.net/projects/tassel
Modified version of the PAL library is used: http://www.cebl.auckland.ac.nz/pal-project
Database access is achieved by GDPC middleware http://www.maizegenetics.net/gdpc
�
Table of Contents
INSTALLATION
INTRODUCTION
1.1.1 WEB START
1.1.2 STAND-ALONE
1.1.3 OPEN SOURCE CODE
1
GETTING STARTED
1.1
1.2
PANELS
2
DATA MODE
2.1
GDPC
2.2
LOAD
2.2.1 BLOB
2.2.2 HAPMAP
2.2.3 PLINK
2.2.4 FLAPJACK
2.2.5 POLYMORPHISM
2.2.6 PHYLIP
2.2.7 NUMERICAL DATA
2.2.8 SQUARE NUMERICAL MATRIX
2.2.9 GENETIC MAP
2.3
EXPORT
2.4
SITES
2.5
SITE NAMES
2.6
TAXA
2.7
TRAITS
2.8
2.9
TRANSFORM
2.10
SYNONYMIZE TAXA NAMES
2.11
UNION JOIN
2.12
3
ANALYSIS MODE
INTERSECTION JOIN
IMPUTE SNPS
2.9.1 GENOTYPE NUMERICALIZATION
2.9.2 TRANSFORM AND/OR STANDARDIZE DATA
2.9.3 IMPUTE PHENOTYPE
2.9.4 PCA
iii
6
7
7
7
8
8
8
10
10
11
12
12
12
13
13
14
14
16
16
16
17
18
19
19
20
20
20
21
22
23
23
25
26
27
�
3.1
DIVERSITY
3.2
LINKAGE DISEQUILIBRIUM
3.3
CLADOGRAM
3.4
SNP EXTRACT
3.5
KINSHIP
3.6
GENERAL LINEAR MODEL
3.7
MIXED LINEAR MODEL
3.8
RIDGE REGRESSION
4
RESULT MODE
4.1
TABLE
4.2
TREE PLOT
4.3
2D PLOT
4.4
LD PLOT
4.5
CHART
5
MENUS
5.1
FILE MENU
5.2
CONTINGENCY TEST
5.3
PREFERENCES
6
TUTORIAL
6.1
MISSING PHENOTYPE IMPUTATION
6.2
PRINCIPAL COMPONENT ANALYSIS
6.3
ESTIMATION OF KINSHIP USING GENETIC MARKERS
6.4
ASSOCIATION ANALYSIS USING GLM
6.5
ASSOCIATION ANALYSIS USING MLM
6.6
7
APPENDIX
6.6.1 CONNECTING WITH A DATABASE
6.6.2 DATA QUERY
6.6.3 IMPORTING GDPC DATA INTO TASSEL
6.6.4 SAVING GDPC QUERY RESULTS
5.1.1 SAVE DATA TREE
5.1.2 OPEN DATA TREE
5.1.3 SAVE DATA TREE AS…
5.1.4 OPEN DATA TREE…
5.1.5 SAVE SELECTED AS…
IMPORTING DATA FROM A DATABASE (VIA GDPC)
iv
27
28
29
29
30
30
32
34
36
36
36
37
38
39
41
41
41
41
41
41
41
42
42
43
43
45
49
50
54
57
57
58
61
63
64
�
JAVA.LANG.OUTOFMEMORYERROR” APPEARS?
WHAT SHOULD I DO?
7.1
NUCLEOTIDE CODES (DERIVED FROM IUPAC)
7.2
TASSEL TUTORIAL DATA SETS
7.3
BIOGRAPHY OF TASSEL
7.4
FREQUENTLY ASKED QUESTIONS
1.
WHAT DO I DO IF TASSEL MISBEHAVES?
2.
WHERE DO I TURN FOR MORE INFORMATION?
3.
HOW DO I JOIN THE FUN: TASSEL ON SOURCEFORGE?
4.
HOW DO I CHANGE THE AMOUNT OF MEMORY USED? WHAT DO I DO WHEN THE “EXCEPTION
5.
WHEN I CLICK ON THE MOST CURRENT VERSION OF TASSEL WEB START, A PREVIOUS VERSION APPEARS.
6.
WHAT SHOULD I SUBSTITUTE FOR MISSING VALUES IN TASSEL?
7.
8.
HOW CAN I CREATE A TASSEL ICON ON DESKTOP?
9.
WHY DO I GET EMPTY SQUARES IN MLM ASSOCIATION ANALYSIS?
10.
WHY SHOULD I EXCLUDE ONE COLUMN OF THE POPULATION STRUCTURE?
11.
CAN KINSHIP REPLACE POPULATION STRUCTURE?
12.
WHY DO TASSEL AND SPAGEDI GIVE DIFFERENT KINSHIP ESTIMATES?
13.
CAN I GET MARKER R SQUARE USING SAS PROC MIXED OR TASSEL MLM?
14.
DOES MLM FIND MORE ASSOCIATIONS THAN GLM?
15.
DO I NEED MULTIPLE TEST CORRECTION FOR THE P VALUE FROM TASSEL?
16.
CAN TASSEL HANDLE DIPLOID GENOTYPE DATA?
17.
HOW TO CITE TASSEL?
IS IT POSSIBLE TO CHANGE DATA NAMES IN THE DATA TREE?
REFERENCES
INDEX
64
65
66
68
68
68
68
68
69
69
69
69
69
69
69
70
70
70
70
70
70
71
73
v
�
INTRODUCTION
While TASSEL has changed considerably since its initial public release in 2001, its primary function
continues to be providing tools to investigate the relationship between phenotypes and genotypes1. As
indicated by its title – Trait Analysis by aSSociation, Evolution and Linkage – TASSEL has multiple
functions, including association study, evaluating evolutionary relationships, analysis of linkage
disequilibrium, principal component analysis, cluster analysis, missing data imputation and data
visualization.
One of the design elements driving TASSEL development has been the need to analyze ever larger sets of
data2. For example, the MLM (mixed linear model) function for association analysis originally used an
EM (expectation-maximization) algorithm, which is a common method for solving mixed models but is
relatively slow. Subsequently developers implemented the EMMA algorithm to increase computing
speed3. Model compression was added to that to improve speed and statistical power for association
study4. Another technique that optimizes variance components once and then uses the estimates to test
markers now provides the ability to screen the large numbers of markers used in genome-wide association
studies (GWAS). The method was independently described by Zhang et al. and Kang et al. in 2010. This
method was named P3D by Zhang et al.4 and EMMAX by Kang et al.5
TASSEL was designed for a wide range of users, including those not expert in statistics or computer
science. A GWAS using the mixed linear model method to incorporate information about population
structure6-8 and cryptic relationships9 can be performed by in a few steps by “clicking” on the proper
choices using a graphic interface. All the processes necessary for the analysis are performed
automatically, including importing phenotypic and genotype data, imputing missing data (phenotype or
genotype), filtering markers on minor allele frequency, generating principal components and a kinship
matrix to represent population structure and cryptic relationships, optimizing compression level and
performing GWAS.
The command-line version of TASSEL, called the Pipeline, provides users the ability to program tasks
using a script instead of the graphic user interface (GUI). This feature allows researchers to define tasks
using a few lines of code and provides the ability to use TASSEL as part of an analysis pipeline or to
perform simulation studies.
Due to the increasing availability of open data sources, TASSEL utilizes a data browser from the
Genomic Diversity and Phenotype Connection (GDPC) project10 to provide an interface to relational
databases. As a result, TASSEL users can access any data source that provides a GDPC service. Using
this middleware, which provides a common graphical interface, TASSEL users can avoid writing SQL
queries to access data. Currently, GDPC provides connections to Panzea, Gramene, Germinate, and GRIN
(USDA’s Germplasm Resources Information Network).
TASSEL is written in Java, thereby enabling its use with virtually any operating system. It can be
installed using Java Web Start technology by simply clicking on a link at www.maizegenetics.net/tassel.
A stand-alone version of TASSEL can also be downloaded to use in pipeline mode or in any situation
where the user wishes to start the software from a command line.
6
�
1 Getting Started
A quick way to get started using TASSEL is to load the tutorial data and try performing analyses.
However, because some of the necessary steps may not be intuitive, we recommend that new users follow
the tutorial at end of this manual. The objective of this section is to provide information necessary to
install and start TASSEL software and to provide a brief overview of the interface.
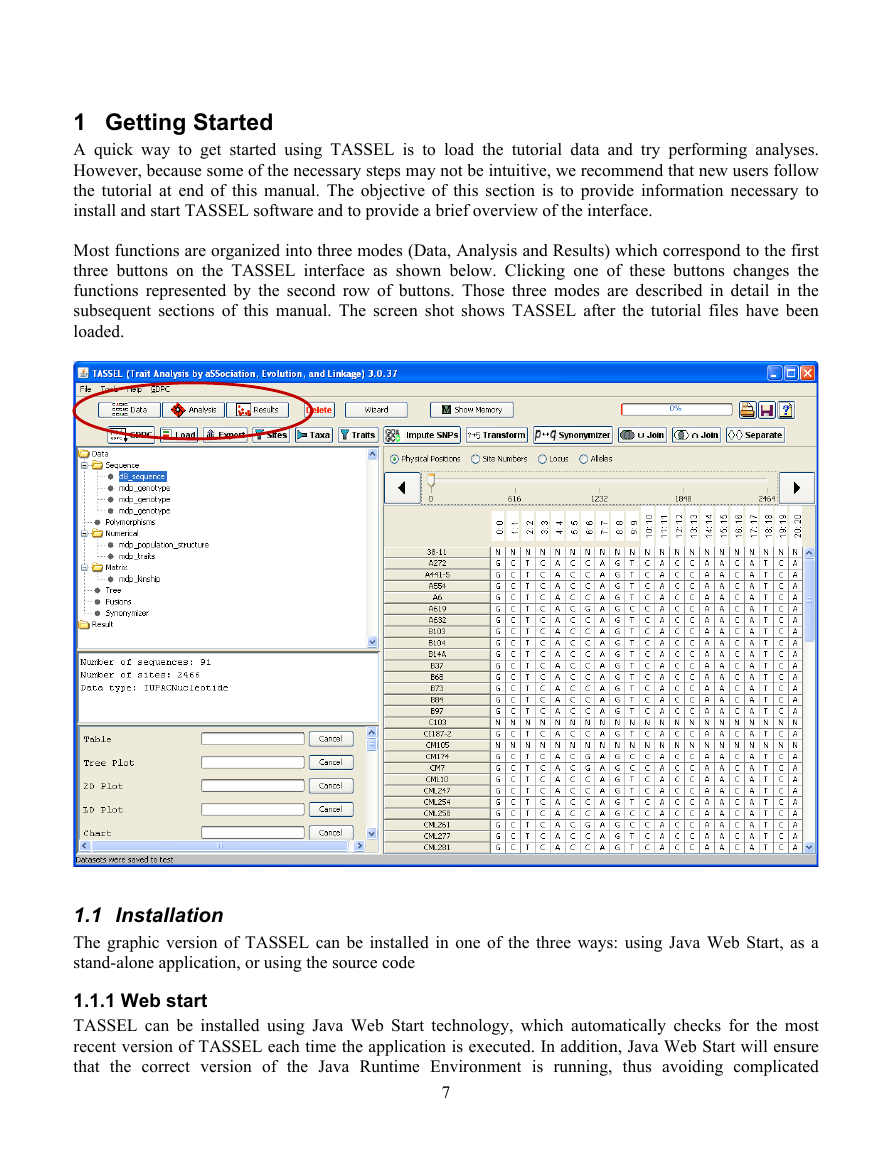
Most functions are organized into three modes (Data, Analysis and Results) which correspond to the first
three buttons on the TASSEL interface as shown below. Clicking one of these buttons changes the
functions represented by the second row of buttons. Those three modes are described in detail in the
subsequent sections of this manual. The screen shot shows TASSEL after the tutorial files have been
loaded.
1.1 Installation
The graphic version of TASSEL can be installed in one of the three ways: using Java Web Start, as a
stand-alone application, or using the source code
1.1.1 Web start
TASSEL can be installed using Java Web Start technology, which automatically checks for the most
recent version of TASSEL each time the application is executed. In addition, Java Web Start will ensure
that the correct version of the Java Runtime Environment is running, thus avoiding complicated
7
�
installation and upgrade procedures. Users should use Web Start unless they have a specific reason to use
one of the other installation methods.
To begin, Java Web Start (JWS) must be installed (prior to the installation of TASSEL). JWS is included
as part of Java Runtime Environment (JRE) 5.0 and above. PC’s and Mac’s will most likely have JWS
already installed. If you need to install Java, the most recent version is available at http://www.java.com.
The easiest way to tell if it is installed on your computer is to try running TASSEL from the following
link:
http://www.maizegenetics.net/tassel
If you will be using TASSEL frequently and would prefer to launch the application from your desktop
rather than by revisiting the website, Java Web Start can be used to manually launch TASSEL each time
and/or to create a shortcut. Access the Java Application Cache Viewer by going to Start > Settings >
Control Panel > Java. From the General tab, click on Settings in the Temporary Internet Files section
and then click on View Applications… and the Java Application Cache Viewer will appear. (Another
way of achieving this is by going to Start > Run and typing in javaws). The TASSEL icon should now
be visible and can be used to launch the application. Shortcuts can be created from the menu of the Java
Application Cache Viewer: Application > Install Shortcuts.
1.1.2 Stand-alone
Downloading a “stand-alone” version is recommended for anyone who has a slow Internet connection.
While Java Web Start is a very good way of deploying software, it does not ask the user before attempting
to download updates. Thus, a slow Internet connection may start a download process that requires an
unreasonable amount of time to complete. If you are not interested in disabling your network connection
each time before starting TASSEL, we recommend downloading the stand-alone version which does not
attempt to update the program. However, given that TASSEL is a Java application, a Java Runtime
Environment (version 1.6.0 or greater) is still required. To get the stand-alone version, download
tassel3.0_standalone.zip from the TASSEL web site. To run the stand-alone version, double-click on the
JAR file (sTASSEL.jar). Alternatively, from a command prompt (in Windows go to Start > Run and type
in “cmd” or “command”), change into the tassel3.0_standalone directory and execute this command:
start_tassel.bat (For Windows)
start_tassel.pl (For UNIX)
1.1.3 Open source code
Open source code for the TASSEL software package is available at: http://sourceforge.net/projects/tassel.
The package uses a number of other libraries that are included in the TASSEL distribution. These include
a modified version of the PAL library (http://www.cebl.auckland.ac.nz/pal-project/), the COLT library
(http://dsd.lbl.gov/~hoschek/colt/), and jFreeChart (http://www.jfree.org/jfreechart/). GDPC middleware
(http://www.maizegenetics.net/gdpc) provides database access.
1.2 Panels
TASSEL is organized into five main panels. (1) The Control Panel at the top contains menus and buttons
to control functions. (2) The Data Tree Panel is located beneath the Control Panel on the left side. This
panel organizes data sets and results. Data set(s) displayed in the Data Tree Panel must first be selected
before a desired function or analysis can be performed. To select multiple data sets, press the CTRL key
while selecting the data sets. (3) The Report Panel is located below the Data Tree Panel. It displays
8
�




 2023年江西萍乡中考道德与法治真题及答案.doc
 2012年重庆南川中考生物真题及答案.doc
 2013年江西师范大学地理学综合及文艺理论基础考研真题.doc
 2020年四川甘孜小升初语文真题及答案I卷.doc
 2020年注册岩土工程师专业基础考试真题及答案.doc
 2023-2024学年福建省厦门市九年级上学期数学月考试题及答案.doc
 2021-2022学年辽宁省沈阳市大东区九年级上学期语文期末试题及答案.doc
 2022-2023学年北京东城区初三第一学期物理期末试卷及答案.doc
 2018上半年江西教师资格初中地理学科知识与教学能力真题及答案.doc
 2012年河北国家公务员申论考试真题及答案-省级.doc
 2020-2021学年江苏省扬州市江都区邵樊片九年级上学期数学第一次质量检测试题及答案.doc
 2022下半年黑龙江教师资格证中学综合素质真题及答案.doc