Speedy evacuation plan to leave the Louvre
When a large building is in danger, it is the most important to guide the inside crowd to
evacuate safely as quickly as possible. By employing the obtained information of the Louvre,
we want to design an evacuation plan to allow inside crowd egress through an optimal exit in
order to empty the building as quickly as possible. Our aim is to identify the bottlenecks in
the process of visitors’ movement. Once the museum face an emergency, our model should
be employed to direct the people evacuate from the danger building.
In accordance with the structure of the Louvre, we draw a directed graph to indicate
the path of evacuation based on the graph theory. In order to have all occupants to leave
the building as quickly and safely as possible, Floyd-Warshall algorithm is used to search
for the shortest path from pavilion groups to exits. By running the algorithm, we get the
evacuation matrix, which can be used by staff to guide visitors safely reach the exits through
each planned paths. Now visitors will queue up at the exits when evacuation, in view of
queuing theory, the queuing parameters such as the queue length and the waiting time
matter a lot. Apart from exits, 46th/53th/101th stairs with large flow of people are also
bottlenecks. For dredging these bottlenecks, particle swarm optimization is used for
optimization of the model. After optimization, the ultimate average evacuation time is 3
seconds, the average queue length at exits is 3 meters, and the waiting time of queues is 3
seconds, which are 10% less than before.
Moreover, it is necessary to make this evacuation model capable of dealing with various
threats.
In the face of fire, we need to let fire fighters get to the fire point as quickly as
possible to protect tourists and collections, so it is necessary to open fire fighter channels at
the four main entrances and make use of additional unknown entrances. In addition, provided
that an explosion occurs on the stairs or if evacuation exits are destroyed artificially, we can
use the evacuation model to redesign the evacuation routes quickly and efficiently.
After the sensitivity analysis of the model, we can confidently provide a few of evacuation
guidance to leave Louvre or other crowded large structures, so that more people can survive
after an emergency.
Keywords: Graph Theory; Floyd-Warshall Algorithm; Queuing Theory; Particle Swar-
m Optimization Algorithm
�
Contents
1 Introduction
2 Assumptions
3 Notations
4 Evacuation Model
4.1 Basic Information of Louvre . . . . . . . . . . . . . . . . . . . . . . . . . . .
4.2 Graph Theory . . . . . . . . . . . . . . . . . . . . . . . . . . . . . . . . . . .
4.3 Floyd-Warshall Algorithm . . . . . . . . . . . . . . . . . . . . . . . . . . . .
4.4 Queuing Theory . . . . . . . . . . . . . . . . . . . . . . . . . . . . . . . . . .
4.5 Bottlenecks
. . . . . . . . . . . . . . . . . . . . . . . . . . . . . . . . . . . .
1
1
2
2
2
4
5
8
9
4.6 Particle Swarm Optimization . . . . . . . . . . . . . . . . . . . . . . . . . .
10
5 Responses for Threats
5.1 Conflagration . . . . . . . . . . . . . . . . . . . . . . . . . . . . . . . . . . .
5.2 Explosion . . . . . . . . . . . . . . . . . . . . . . . . . . . . . . . . . . . . .
5.3 Blockage of exits
. . . . . . . . . . . . . . . . . . . . . . . . . . . . . . . . .
6 Sensitivity Analysis
7 Strengthens and Weaknesses of Models
7.1 Weaknesses
. . . . . . . . . . . . . . . . . . . . . . . . . . . . . . . . . . . .
8 Recommendations for Emergency Management
8.1 The Application Scope of Evacuation plan . . . . . . . . . . . . . . . . . . .
8.2 Reporting procedure . . . . . . . . . . . . . . . . . . . . . . . . . . . . . . .
8.3 Emergency measure . . . . . . . . . . . . . . . . . . . . . . . . . . . . . . . .
8.4 Training and Exercise . . . . . . . . . . . . . . . . . . . . . . . . . . . . . . .
13
13
14
15
16
17
17
17
17
17
17
18
�
Team # 1917800
Page 1 of 19
1
Introduction
Because of the recent terrorist attacks in France, our team is helping to design evacuation
plans at the Louvre in Paris. There are four main entrances and other entrances that are
not safe but helpful for the evacuation plans. After identifying potential bottlenecks and
security threats in the museum, our team establish a evacuation model in order to allow the
museum leaders to explore a range of options to evacuate visitors from the museum, while
also allowing emergency personnel to enter the building as quickly as possible.
The overview of our work:
• According to the characteristics of the interior structure of the museum, we draw a
directed graph to indicate the path of evacuation, and then use Freud algorithm to
search for the shortest path. Because visitors will arrive at the exit in a short period
of time, the exit is bound to line up, this time the use of queuing theory knowledge,
calculate the four main exits of the queuing team length and queuing waiting time.
In order to prevent the staircase and outlet blockage time is too long, we use particle
swarm optimization algorithm to clear these two bottlenecks, to achieve the initial
optimization of the model.
• To make the models we build more adaptable, we analyzed three of threats and made e-
vacuation plans in different threat situations, and showed that evacuation plans changed
dynamically when threats changed.
• Because the evacuation plan is affected by too many factors, we analyze the sensitivity of
the model and enumerate the influence of different factors on the model, thus reflecting
the superiority of our model.
• Based on the results of our work, we propose policy and procedural recommendations
for emergency management of the Louvre.
2 Assumptions
• Visitors evacuate from the nearest stairs.
• Do not use the elevator when visitors evacuate.
• The Louvre buildings meet the basic requirements of France fire safety regulations
�
Team # 1917800
3 Notations
Page 2 of 19
Notations
vn
vsi
xij
lij
tij
µ
λj
s
Lj
tj
hij
xk
Pbest
Gbest
Vk
w
nmax
ni
c1, c2
M
vm
nj
RSET
dj
tj
Table 1: Notation
Definition
n pavilions
exit nodes
the total population of the nth Pavilion
the distance from node i to node j
he time for visitors to evacuate from ith pavilion to jth exit
the number of passing visitors per time
the number of arrival visitors per time at exit i
the maximum number of simultaneous imports and exports
the queue length at exit i
the longest evacuation time at exit j
the shortest path from node i to exit j
the k-th particle(k = 1, 2, ..., m) position
the best position where particles went through
the best position where the entirety went through
the velocity of particles
the weighting coefficient
the whole iteration
the current iteration
earning factors
any large positive integer
the velocity of firefighters
the entry rate of firefighters
the safe evacuation time
the distance from the exit j to the fire point
the required time from exit j to the fire point
4 Evacuation Model
4.1 Basic Information of Louvre
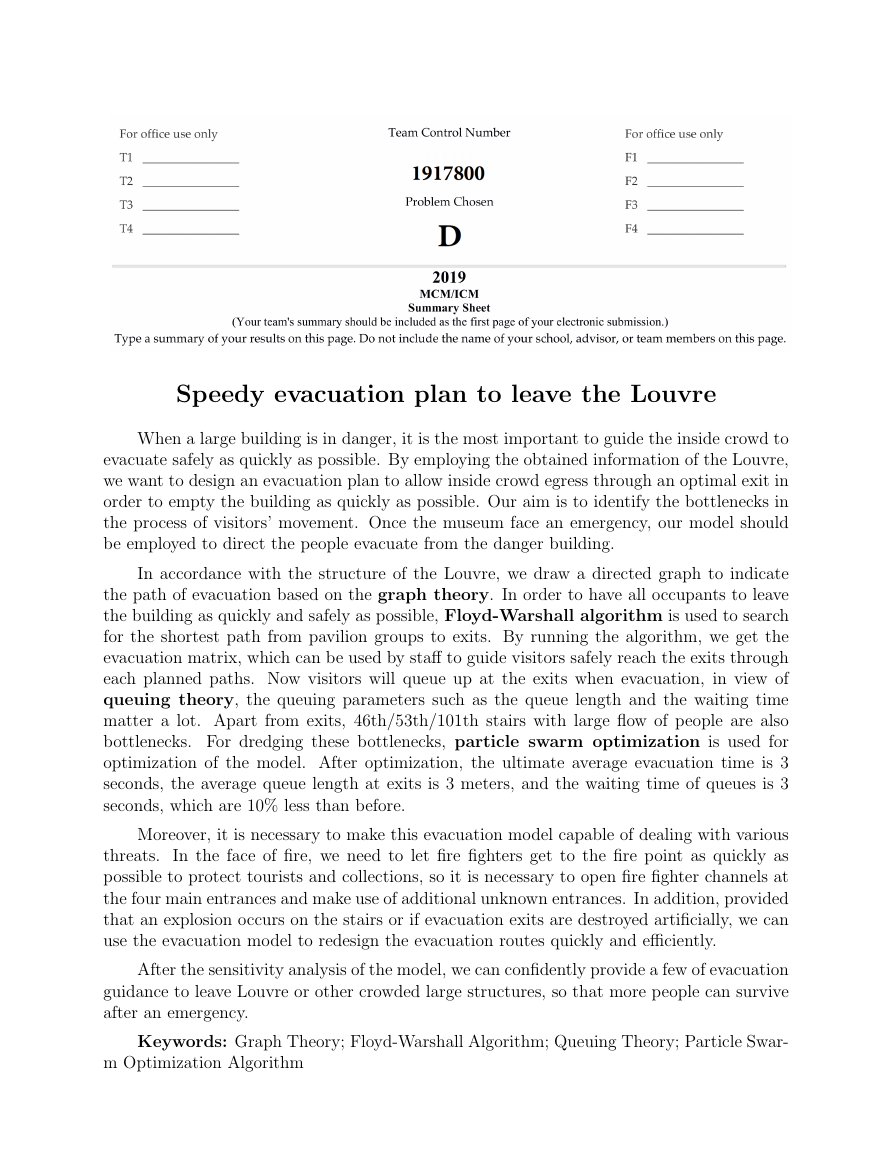
In Louvre, there are four main entrances: the Pyramid entrance, the Passage Richelieu
entrance, the Portes Des Lions entrance and the Carrousel du Louvre entrance which could
all be treated as the evacuation exits shown in Figure 1.
�
Team # 1917800
Page 3 of 19
Figure 1: Four Main Entrances of Louvre
In order to calculate the flow of people in the evacuation channels, we need to know
the number of people in each pavilion. Because the popularity of the pavilion varies, the
flow of people will vary, which will affect the evacuation plan [10]. The following tables and
explanations show the popularity of different pavilions and the proportion of people in them.
Table 2: The Proportion of Visitors in the Most Popular Pavilions
Floors
Ground floor
1st floor
1st floor
Pavilions
345
703
711
Treasures
Venus de Milo
Victoire de Samothrace
Mona Lisa
The number of people in those pavilions where the above-mentioned treasures are located
accounts for 10% of the total number.
Table 3: The Proportion of Visitors in Popular Pavilions
Floors
Lower ground floor
Ground floor
1st floor
2nd floor
Pavilions
102 133 169 174 183 186
219 236 403 417
503 635 700 706 708 716 717
811 845 848 940
�
Team # 1917800
Page 4 of 19
Of the 16 pavilions displayed above, each pavilion accounts for 2.5% of the total number.
There are 31 other less popular pavilions, each of which accounts for 1% of the total number
[2] [9] [7].
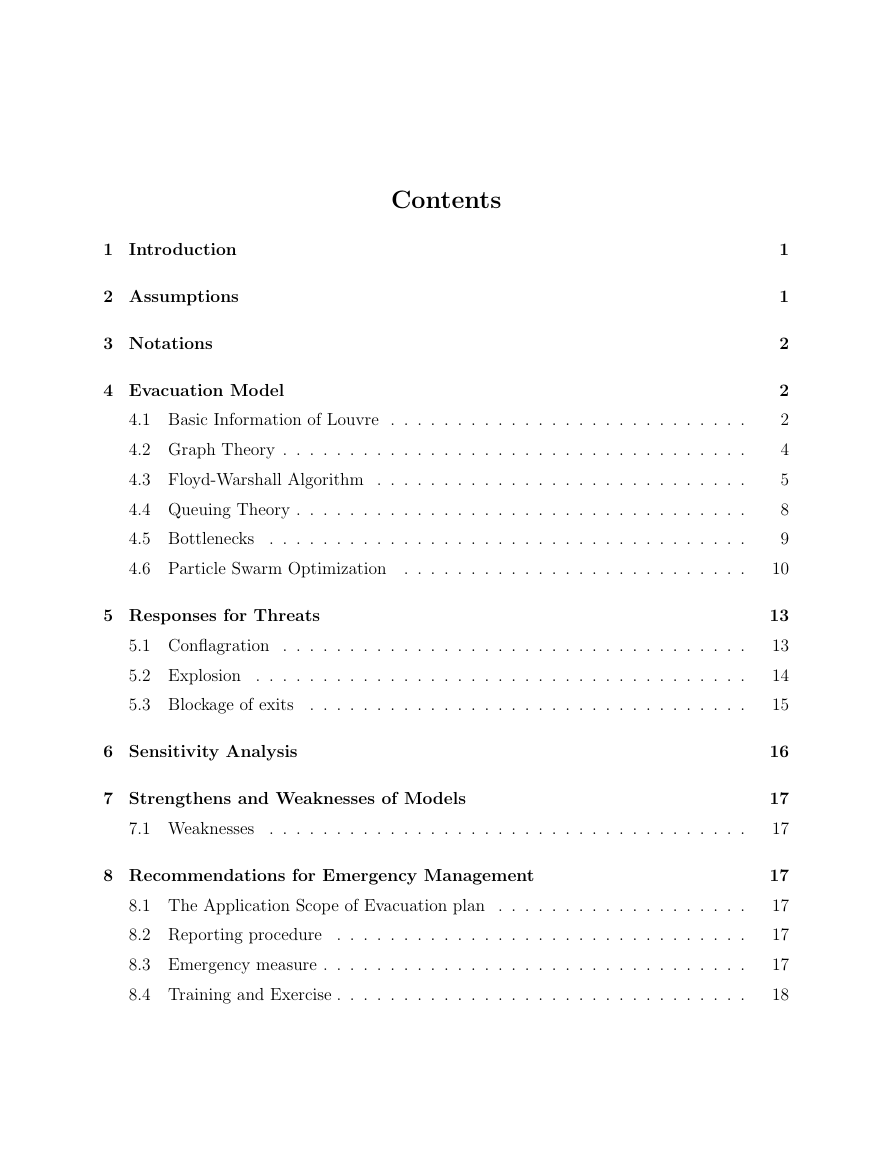
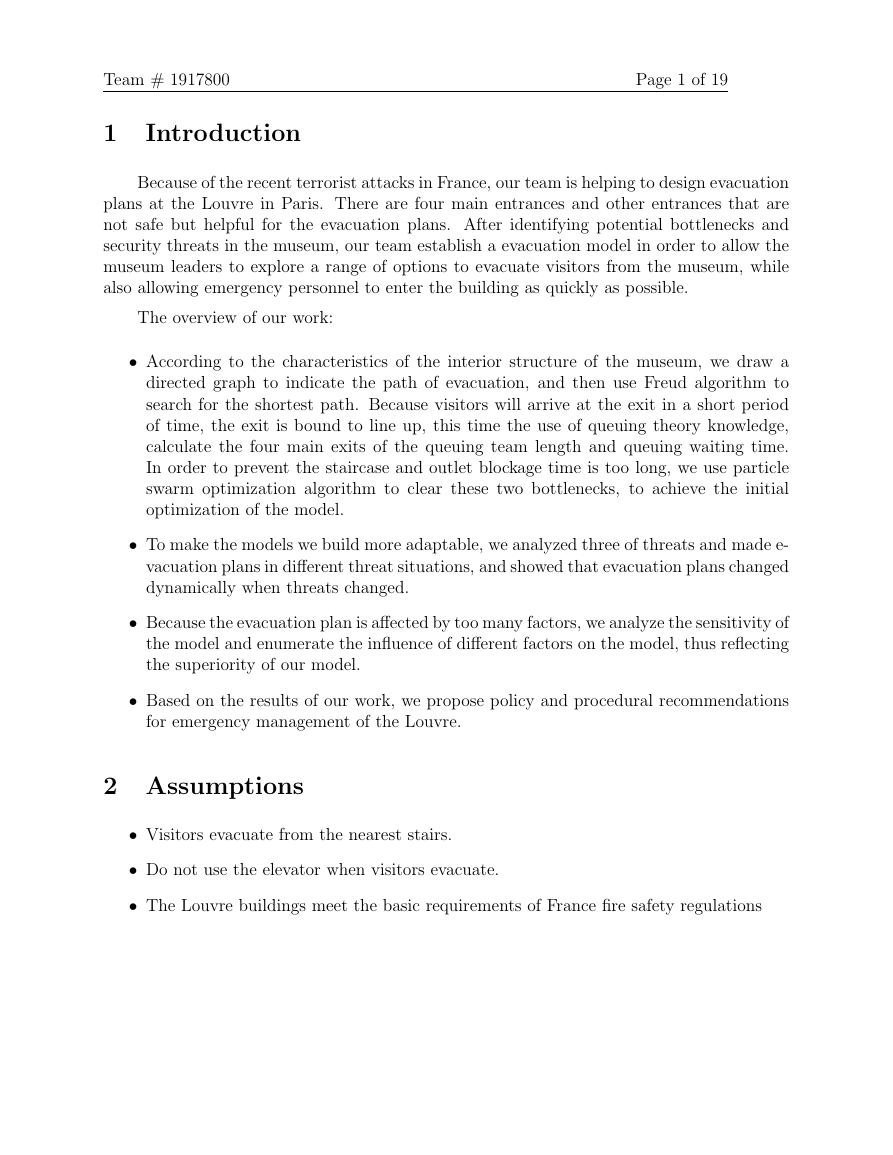
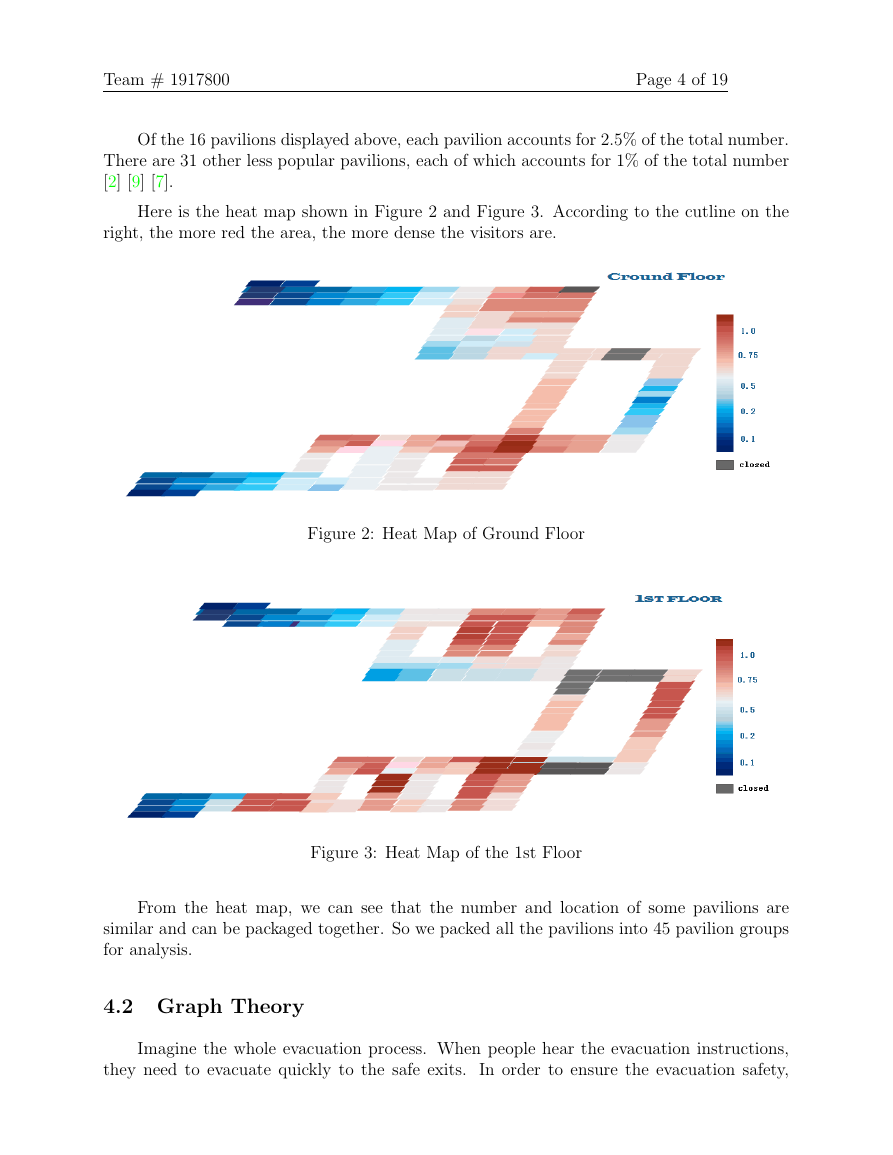
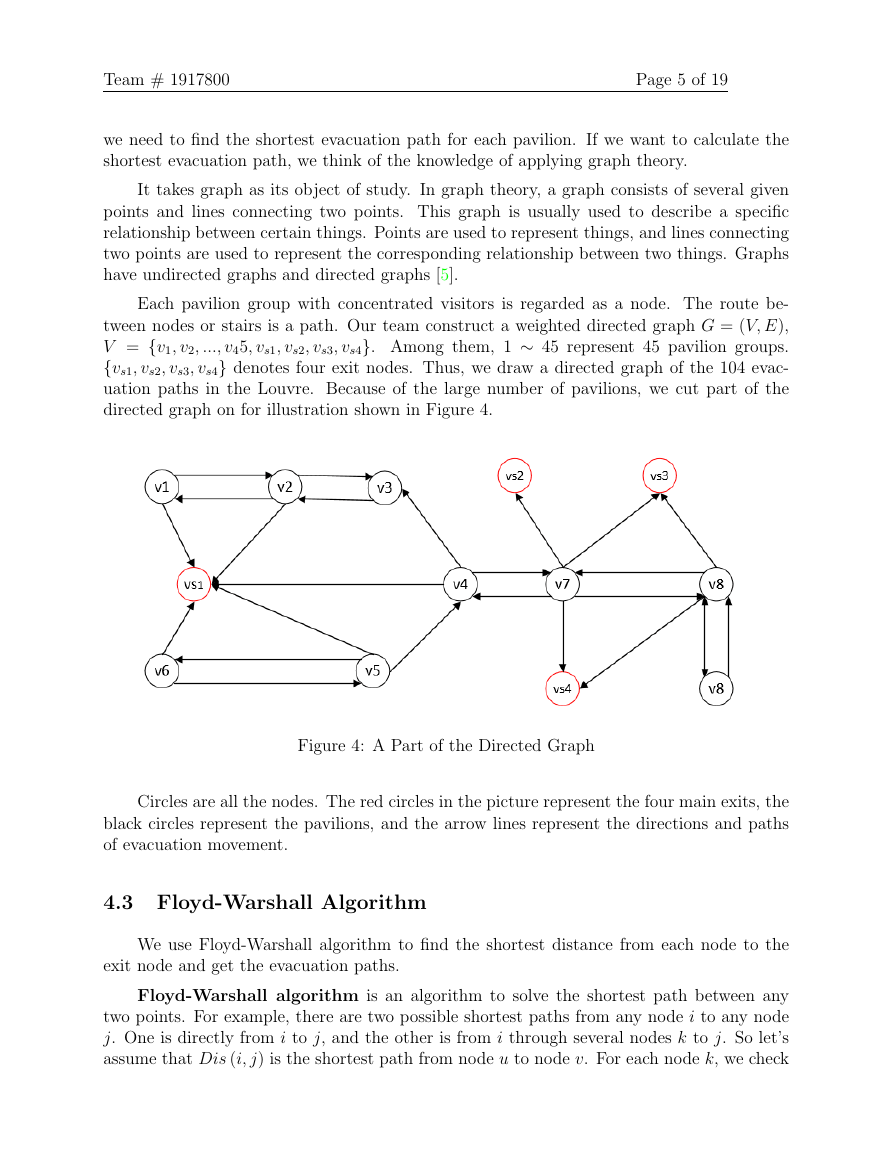
Here is the heat map shown in Figure 2 and Figure 3. According to the cutline on the
right, the more red the area, the more dense the visitors are.
Figure 2: Heat Map of Ground Floor
Figure 3: Heat Map of the 1st Floor
From the heat map, we can see that the number and location of some pavilions are
similar and can be packaged together. So we packed all the pavilions into 45 pavilion groups
for analysis.
4.2 Graph Theory
Imagine the whole evacuation process. When people hear the evacuation instructions,
they need to evacuate quickly to the safe exits. In order to ensure the evacuation safety,
�
Team # 1917800
Page 5 of 19
we need to find the shortest evacuation path for each pavilion. If we want to calculate the
shortest evacuation path, we think of the knowledge of applying graph theory.
It takes graph as its object of study. In graph theory, a graph consists of several given
points and lines connecting two points. This graph is usually used to describe a specific
relationship between certain things. Points are used to represent things, and lines connecting
two points are used to represent the corresponding relationship between two things. Graphs
have undirected graphs and directed graphs [5].
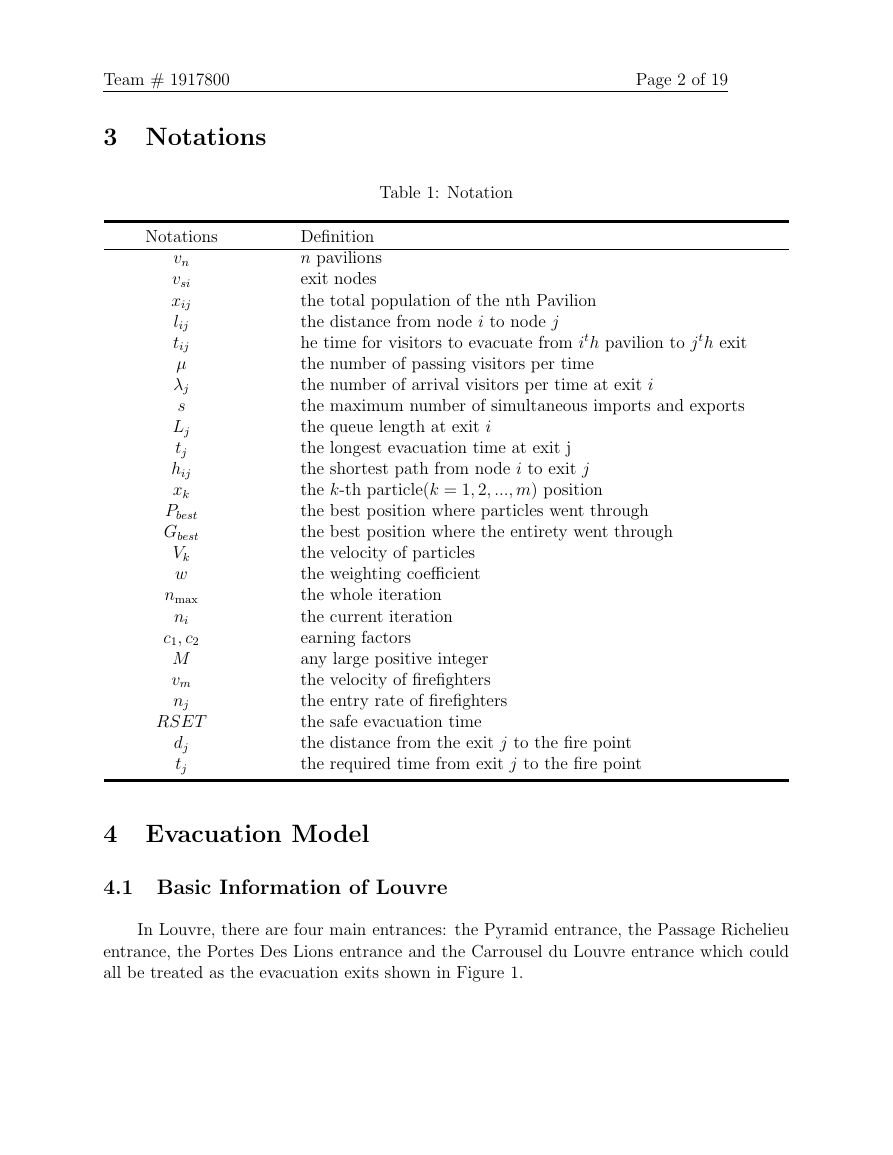
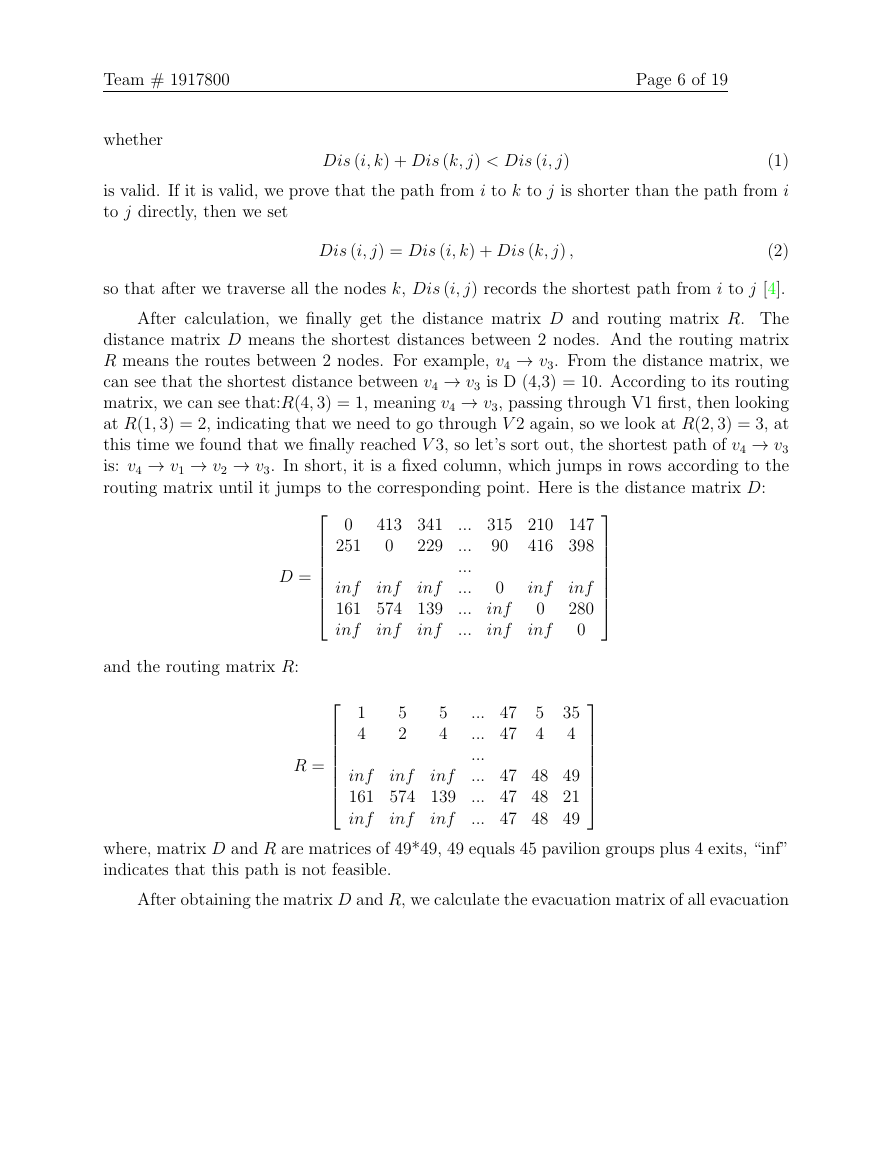
Each pavilion group with concentrated visitors is regarded as a node. The route be-
tween nodes or stairs is a path. Our team construct a weighted directed graph G = (V, E),
V = {v1, v2, ..., v45, vs1, vs2, vs3, vs4}. Among them, 1 ∼ 45 represent 45 pavilion groups.
{vs1, vs2, vs3, vs4} denotes four exit nodes. Thus, we draw a directed graph of the 104 evac-
uation paths in the Louvre. Because of the large number of pavilions, we cut part of the
directed graph on for illustration shown in Figure 4.
Figure 4: A Part of the Directed Graph
Circles are all the nodes. The red circles in the picture represent the four main exits, the
black circles represent the pavilions, and the arrow lines represent the directions and paths
of evacuation movement.
4.3 Floyd-Warshall Algorithm
We use Floyd-Warshall algorithm to find the shortest distance from each node to the
exit node and get the evacuation paths.
Floyd-Warshall algorithm is an algorithm to solve the shortest path between any
two points. For example, there are two possible shortest paths from any node i to any node
j. One is directly from i to j, and the other is from i through several nodes k to j. So let’s
assume that Dis (i, j) is the shortest path from node u to node v. For each node k, we check
�
Team # 1917800
whether
Page 6 of 19
Dis (i, k) + Dis (k, j) < Dis (i, j)
(1)
is valid. If it is valid, we prove that the path from i to k to j is shorter than the path from i
to j directly, then we set
Dis (i, j) = Dis (i, k) + Dis (k, j) ,
(2)
so that after we traverse all the nodes k, Dis (i, j) records the shortest path from i to j [4].
After calculation, we finally get the distance matrix D and routing matrix R. The
distance matrix D means the shortest distances between 2 nodes. And the routing matrix
R means the routes between 2 nodes. For example, v4 → v3. From the distance matrix, we
can see that the shortest distance between v4 → v3 is D (4,3) = 10. According to its routing
matrix, we can see that:R(4, 3) = 1, meaning v4 → v3, passing through V1 first, then looking
at R(1, 3) = 2, indicating that we need to go through V 2 again, so we look at R(2, 3) = 3, at
this time we found that we finally reached V 3, so let’s sort out, the shortest path of v4 → v3
is: v4 → v1 → v2 → v3. In short, it is a fixed column, which jumps in rows according to the
routing matrix until it jumps to the corresponding point. Here is the distance matrix D:
D =
and the routing matrix R:
413 341 ... 315 210 147
0
416 398
90
0
251
229 ...
...
inf inf inf ...
161 574 139 ...
inf inf inf ...
0
0
inf
inf inf
inf inf
280
0
1
4
5
2
5
4
... 47
... 47
...
5
4
35
4
inf inf inf ... 47 48 49
161 574 139 ... 47 48 21
inf inf inf ... 47 48 49
R =
where, matrix D and R are matrices of 49*49, 49 equals 45 pavilion groups plus 4 exits, “inf”
indicates that this path is not feasible.
After obtaining the matrix D and R, we calculate the evacuation matrix of all evacuation
�



 2023年江西萍乡中考道德与法治真题及答案.doc
 2012年重庆南川中考生物真题及答案.doc
 2013年江西师范大学地理学综合及文艺理论基础考研真题.doc
 2020年四川甘孜小升初语文真题及答案I卷.doc
 2020年注册岩土工程师专业基础考试真题及答案.doc
 2023-2024学年福建省厦门市九年级上学期数学月考试题及答案.doc
 2021-2022学年辽宁省沈阳市大东区九年级上学期语文期末试题及答案.doc
 2022-2023学年北京东城区初三第一学期物理期末试卷及答案.doc
 2018上半年江西教师资格初中地理学科知识与教学能力真题及答案.doc
 2012年河北国家公务员申论考试真题及答案-省级.doc
 2020-2021学年江苏省扬州市江都区邵樊片九年级上学期数学第一次质量检测试题及答案.doc
 2022下半年黑龙江教师资格证中学综合素质真题及答案.doc