Available online at www.sciencedirect.com
Image and Vision Computing 26 (2008) 1196–1206
www.elsevier.com/locate/imavis
Automatic object and image alignment using Fourier Descriptors
Weisheng Duan a, Falko Kuester b,*, Jean-Luc Gaudiot c, Omar Hammami d
a Ion Beam Application S.A., Avenue Albert Einstein, 4, B-1348 Louvain-La-Neuve, Belgium
b Department of Structural Engineering, University of California San Diego, La Jolla, CA 92093-0436, USA
c Department of Electrical Engineering and Computer Science, University of California Irvine, Irvine, CA 92697-2625, USA
d E´ cole Nationale Supe´ rieure de Techniques Avance´es, 32 Boulevard Victor, 75739 Paris Cedex 15, France
Received 8 September 2004; received in revised form 5 November 2007; accepted 19 January 2008
Abstract
This paper presents a new edge-based technique for image alignment, combining Fourier Descriptors (FD) and the Iterative Closest
Point (ICP) computation into an accurate and robust processing pipeline. Once edges are identified in the reference and target images,
Fourier Descriptors are used to simultaneously determine edge correspondence and estimate the transformation parameters. Subse-
quently, an ICP computation is applied to further improve the alignment results. Using Fourier Descriptors in combination with a reli-
able distance matrix, corresponding edge pairs can be reliably detected for all identified edges.
Ó 2008 Published by Elsevier B.V.
Keywords: Image alignment; Edge detection; Fourier Descriptors; Correspondence; Transformation; Iterative Closest Point
1. Introduction
Fast, reliable and accurate image alignment algorithms
are fundamentally important to a broad range of domains,
including computer vision, remote sensing, and biomedical
imaging. The aim is to find transformations between image
pairs, that allow us to compensate for spatial and temporal
variations within the observed environment. The observed
changes may result from movement of the vision-based
sensor, the use of multiple sensors, movement of objects
or features within the scene, or a combination thereof. In
many cases, image alignment is the first step before further
image comparisons and analysis can take place. For exam-
ple, computer vision and remote sensing applications may
require identification, correlation, and tracking of selected
objects to aid in navigation and scene recovery. More com-
plex challenges are raised in the field of biomedical imag-
ing, where the alignment of
images acquired with
* Corresponding author. Tel.: +1 858 534 9953; fax: +1 858 822 4633.
E-mail addresses: wduan@iba.be (W. Duan), fkuester@ucsd.edu
(F. Kuester), gaudiot@uci.edu (J.-L. Gaudiot), hammami@ensta.fr
(O. Hammami).
0262-8856/$ - see front matter Ó 2008 Published by Elsevier B.V.
doi:10.1016/j.imavis.2008.01.009
different imaging techniques such as MRI, fMRI, CT,
and PET poses a challenging and time consuming problem.
New techniques that can aid with the rapid identification of
relevant features and co-registration of data sets obtained
with different imaging modalities will greatly aid in the
analysis and subsequent diagnosis of diseases.
Typically, we have two images to which we shall refer as
the reference image and the target image, respectively. The
task of the image alignment process is to find the spatial
transformation between the target image and the reference
that puts the target image into the best possible spatial cor-
respondence with the reference image. Following the
notion of common alignment algorithm [1], image align-
ment methods can be broadly divided into two main cate-
gories: (i) area-based techniques and (ii) feature-based
techniques.
In this paper, we propose a simple, accurate, and robust
algorithm, which is based on edge features. It may be
divided into four steps, (1) identification of features or
object edges contained in the two images utilizing an
appropriate edge detection algorithm, (2) correlation of
the detected edges to determine the corresponding pairs
that represent the same object, (3) initial estimation of fea-
�
W. Duan et al. / Image and Vision Computing 26 (2008) 1196–1206
1197
ture transformations based on edge correspondence, and
(4) refinement of the estimate using an Iterative Closest
Point (ICP) method, which makes the alignment, adding
accuracy and robustness. In this paper, we have generalized
Fourier Descriptors and exploited them for edge corre-
spondence (Step 2) as well as the transformation estimation
(Step 3), allowing us to perform two crucial computational
steps at the same time. This results in a clean and efficient
algorithm for image alignment.
2. Related work
Recently, researchers have paid close attention to image
alignment and a broad range of methods has been devel-
oped in two major categories: (1) area-based methods
and (2) feature-based methods. Area-based methods such
as mutual information methods [2,3] work directly with
the raw image data and remove the need for image fea-
tures, making these methods particularly interesting. How-
ever, the use of raw data without any reduction makes
them calculation intensive, especially when an entire image
is used. Therefore, we have focused our work on the fea-
ture-based methods.
[4] proposed a refinement process,
Three types of features, region features, line features
and point features [1] are used by most feature-based
methods. Generally,
region features are detected by
image segmentation techniques, which can significantly
image alignment quality. Goshtasby
influence the final
et al.
in which the
image alignment is done iteratively with segmentation
to improve the final alignment quality. Line features
can be extracted by standard edge detectors, such as
Canny [5] and Laplacian of Gaussian [6]. Corners are
widely used as the point features for image alignment
and many corner detectors exist [7]. However, the num-
ber of detected corners can be very high and the posi-
tions of the detected corners are not always accurate
resulting in a slow and less robust alignment process.
Compared to regions and corners, edges (line features)
are more distinct, stable, easier to detect and are natural
features for image alignment. Edge-based image align-
ment methods commonly use shape descriptors to deter-
mine the correspondence among the detected edges. In
[4], Goshtasby et al. proposed a method using shape
matrices, while in [8], Li et al. applied a method based
on chain-code correlation. A widely cited approach in
the literature is based on Invariant Moments based
descriptors [9,10]. While all of these methods can provide
relatively reliable correspondence results, the use of Fou-
rier Descriptors [11] is appealing due to its simplicity.
As a shape representation method, Fourier Descriptors
are usually used for content-based image retrieval
[12].
Because they are simple, insensitive to translation, rotation,
and scaling, we apply them to image alignment as the edge
similarity measurement. It should be noted that Fourier
Descriptors can also be used to estimate the transformation
between the target image and the reference image, which
greatly simplifies the image alignment process. This estima-
tion also solves the initialization problem of the standard
Iterated Closest Point (ICP) algorithm [13,14], which is
well known for giving accurate and robust alignments for
2D and 3D point sets. The combination of Fourier
Descriptors with ICP provides an elegant, accurate, and
robust image alignment method.
3. Image alignment using Fourier Descriptors
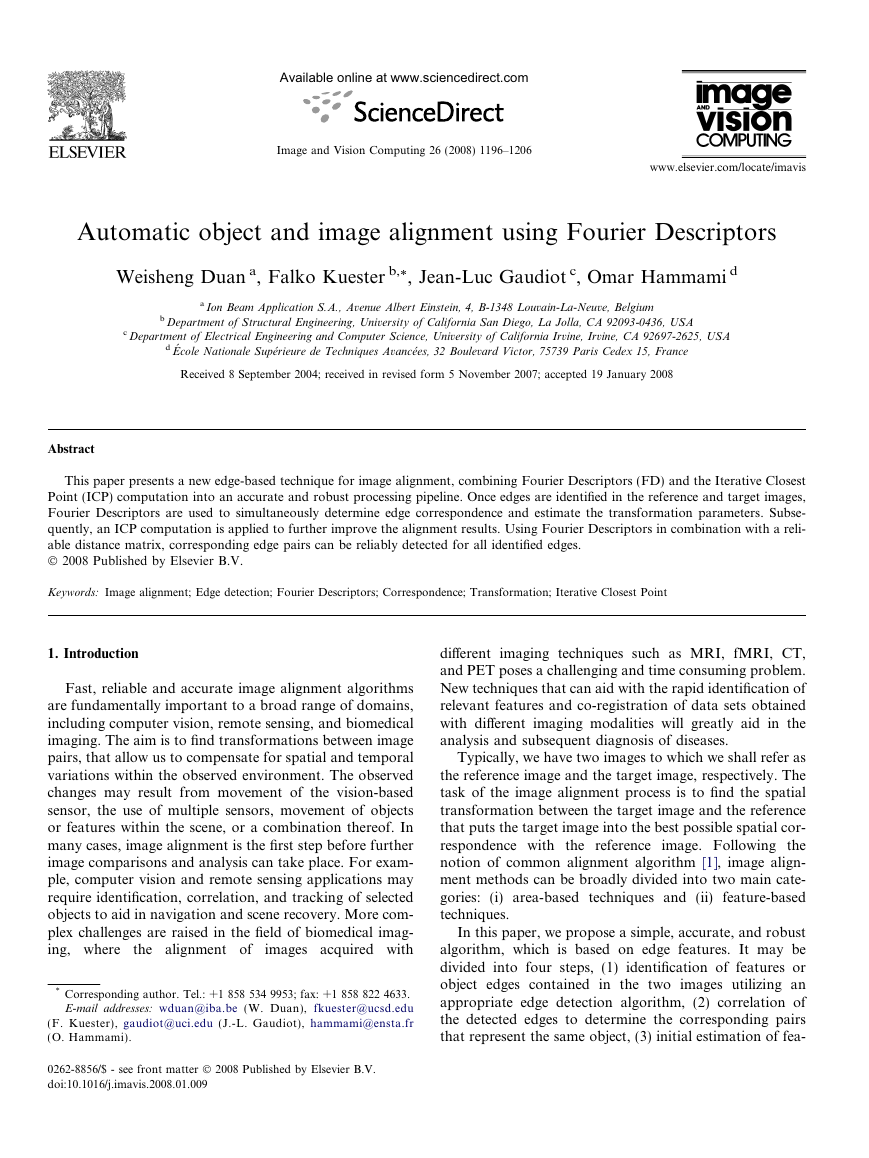
An overview of our method is shown in Fig. 1 and high-
lights the use of Fourier Descriptors in combination with
ICP computation. As stated earlier, Fourier Descriptors
are used to determine the correspondence of detected edges
as well as to estimate the transformation between the target
image and the reference image, while ICP is applied to
refine the transformation.
3.1. Edge detection and linking
Edges are considered natural and easily detectable image
features, providing compact and rich information in images
including object location, shape, size, and texture. The
selection of an edge-based image alignment criterion allows
us to leverage from mature edge detection techniques such
as Canny [5] and Laplacian of Gaussian [6].
The Canny edge detector [5], which was designed to be
an optimal edge detector, was used for our first processing
step. The Canny method is optimal since it finds edges by
looking for global maxima of the image’s gradient. Strong
and weak edges are detected, using two different thresholds
and weak edges appear in the output only if they are con-
nected to strong edges. This method is therefore less likely
than others to be deceived by noise, and more likely to
detect true weak edges. While Canny gives us a reliable
edge image, the pixels in the edge image are independent
and as a result, the object information in images cannot
be directly offered by the Canny detector. This necessitates
an edge linking step [15] following edge detection. Using an
edge linking method, we then can assemble edge pixels into
meaningful object boundaries.
To summarize, with the selection of proper parameters,
the Canny edge detector followed by an edge linking pro-
cess identifies appropriate edges for use in our image align-
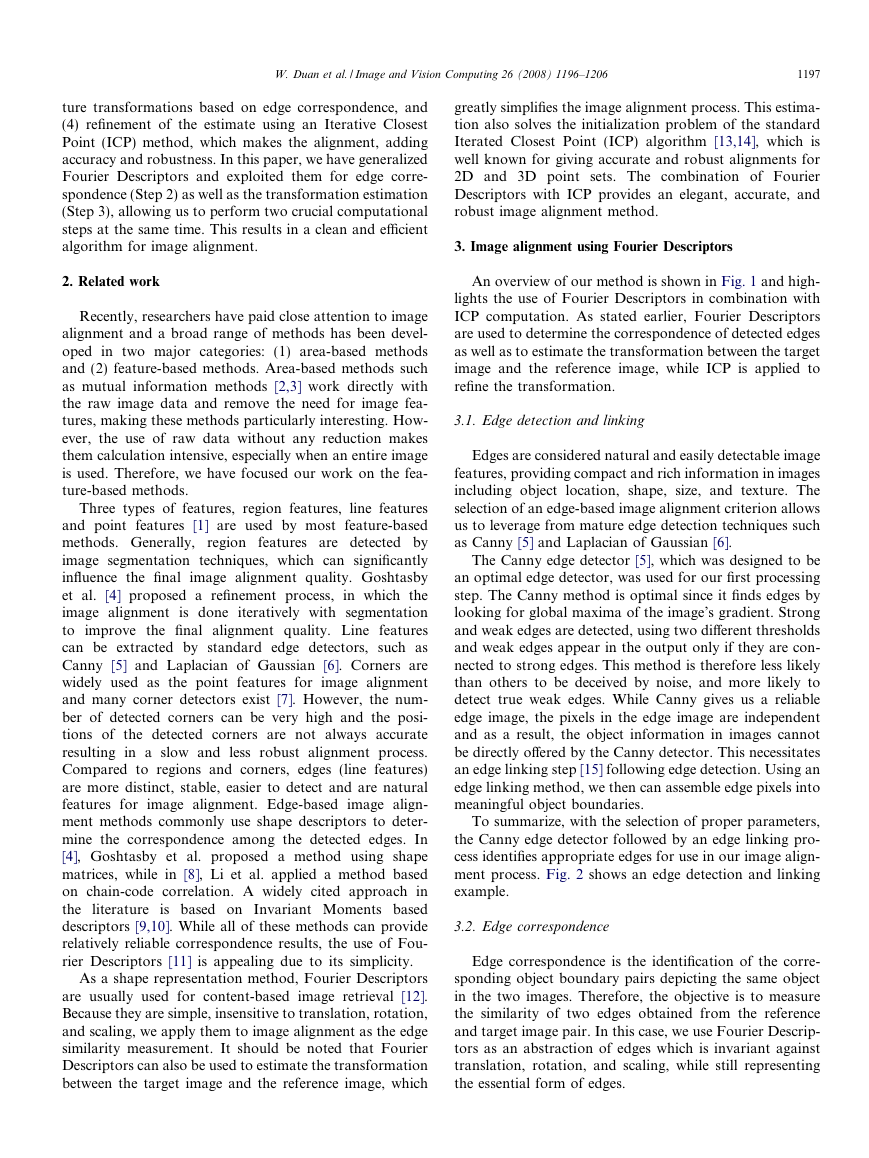
ment process. Fig. 2 shows an edge detection and linking
example.
3.2. Edge correspondence
Edge correspondence is the identification of the corre-
sponding object boundary pairs depicting the same object
in the two images. Therefore, the objective is to measure
the similarity of two edges obtained from the reference
and target image pair. In this case, we use Fourier Descrip-
tors as an abstraction of edges which is invariant against
translation, rotation, and scaling, while still representing
the essential form of edges.
�
1198
W. Duan et al. / Image and Vision Computing 26 (2008) 1196–1206
Fig. 1. An overview of the image alignment process.
a
b
c
50
100
150
200
250
300
50
100
150
200
250
Fig. 2. Edge detection and linking example. (a) Original image (256 � 301). (b) Edge detection by Canny method. Parameters used: low threshold 0.3, high
threshold 0.6, sigma 0.6. (c) The linked edges. One color presents one lined edge.
3.2.1. Fourier Descriptors
This method was first introduced by Zahn and Roskies
[11]. Among many existing shape representation methods,
Fourier Descriptors (FDs) achieve both good representa-
tion and good normalization and directly support corre-
spondence analysis.
where n ¼ �N =2; . . . ; N =2 � 1. Using Discrete Fourier
Transformation (DFT), zðnÞ can be transformed into the
frequency domain. Without any loss, the result can be
transformed back into the spatial domain via the Inverse
Discrete Fourier Transformation (IDFT). DFT and IDFT
are defined as aðkÞ and zðnÞ, respectively:
Definition. Let C be an edge composed of N points
pðnÞ ¼ ðxðnÞ; yðnÞÞ [16]. From these points, we can define
a discrete complex function zðnÞ as zðnÞ ¼ xðnÞ þ jyðnÞ,
aðkÞ ¼ 1
N
zðnÞe�j2pkn=N
k ¼ �N =2; . . . ; N =2 � 1
ð1Þ
X
N =2�1
n¼�N =2
�
X
N =2�1
k¼�N =2
zðnÞ ¼
aðkÞej2pkn=N
n ¼ �N =2; . . . ; N =2 � 1
ð2Þ
W. Duan et al. / Image and Vision Computing 26 (2008) 1196–1206
1199
The coefficients aðkÞ are also called Fourier coefficients.
They contain the information about the edges in the Fou-
rier domain.
3.2.1.1. Properties and normalization. Certain geometric
transformations of the edge function zðnÞ can be related
to simple operations of aðkÞ in the Fourier domain. Trans-
lation affects only the center coefficient að0Þ, while the
other coefficients retain their values. Scaling of the edge
with a factor s leads to a scaling of all the coefficients
aðkÞ by the same factor. Rotating the edge by an angle b
yields a constant phase shift of b in the Fourier domain
for all aðkÞ [12].
The Fourier coefficients aðkÞ must be normalized to
make them invariant to the translation, rotation, and scal-
ing of objects. According to the properties of FDs, omit-
ting the Fourier coefficient að0Þ and using the other
coefficients að�N =2Þ . . . að�1Þ að1Þ . . . aðN =2 � 1Þ, FDs will
be invariant against translation. Taking the magnitude of
each Fourier coefficient makes FDs rotation invariant;
dividing all Fourier coefficients by the magnitude of að1Þ
could make FDs scaling-invariant. The normalized FDs
used
is
and
correspondence.
determine
then
to
edge
similarity
3.2.2. Correspondence identification method
Given any detected edge pair, one edge from each
image, we define their similarity by the Euclidean dis-
tance between their normalized Fourier Descriptors.
One immediate problem is that,
in most cases, these
two edges contain a different number of points, and so
their Fourier Descriptors are not of the same size, and
therefore, the Euclidean distance cannot be calculated
directly. To solve this problem the longer edge is first
sampled such that it has the same number of points as
the shorter one before applying Fourier Descriptors to
these two edges. Experiments showed that this sampling
method works much better than interpolating the shorter
edge to align it with the longer one. Finally, the normal-
ized distance between these two edges is calculated by
dividing their total distance by the point number of the
sampled edge.
To get the most reliable correspondence, a distance
matrix is computed. In this matrix D, the element dij
is the normalized distance between edge Ci in the refer-
ence image and edge Cj in the target image. When dij is
simultaneously minimal in its row (the ith row) and its
column (the jth column), i.e., when Ci is the most sim-
ilar edge in the reference image for Cj and at the same
time Cj is the most similar edge in the target image for
Ci, we decide that the correspondence between edge Ci
and edge Cj
is reliable and obtain one corresponding
edge pair.
3.2.3. Correspondence reliability rank
After finding all the reliable corresponding edge pairs,
the corresponding edge pairs are then ranked by the nor-
malized distance. This allows the first edge pair to become
the most reliable pair among the corresponding pairs with
the last one being the least reliable.
3.2.4. Edge correspondence pseudo-code
The pseudo-code for the edge correspondence determi-
nation can then be formulated as:
for each edge in reference image
for each edge in target image
sample the longer edge
calculate the normalized Fourier Descriptors of
these two edges
calculate the Euclidean distance between the two
Fourier Descriptors
normalize the Euclidean distance with the number of
edge points
end for
end for
for each edge J in reference image
find its most similar edge K in target image (smallest
normalized distance)
for K, in the reference image, find its most similar edge
J0
if J ¼ J0; J and K are reliable corresponding edges
if J 6¼ J0, go to next edge
end for
rank the corresponding edge pairs by the normalized
distance
3.3. Transformation parameters estimation
By exploiting the characteristics of Fourier Descriptors,
the transformation parameters between the target image
and the reference image can be estimated from any corre-
sponding edge pair. To determine edge correspondence
the Fourier Descriptors are normalized as described in Sec-
tion 3.2.1. Without normalization, the FD can also be used
to recover the transformation parameters. For example,
suppose a1 and a2 are the Fourier Descriptors of two cor-
responding edges, then a1ð0Þ and a2ð0Þ are the centroid
points of the two edges. The translation between these
two edges could be obtained by t ¼ a1ð0Þ � a2ð0Þ and the
scaling factor s ¼j a1ð1Þ j = j a2ð1Þ j. To get the rotation
angle b, the orientation of the basic ellipse /e [12] is used,
which is defined by the Fourier coefficients að1Þ ¼ r1ej/1
and að�1Þ ¼ r�1ej/�1 , as
zeðnÞ ¼ að�1Þe�j2pn=N þ að1Þej2pn=N
ð3Þ
e
/ ¼ ð/1 � /�1Þ=2, we can rewrite
With the abbreviation
e
e
this as
/þj2pn=NÞ
/þj2pn=NÞ þ r1ejð
zeðnÞ ¼ ejð/�1þ/1Þ=2½r�1e�jð
ð4Þ
�
1200
W. Duan et al. / Image and Vision Computing 26 (2008) 1196–1206
which shows that the orientation /e of the basic ellipse is:
ð5Þ
/e ¼ ð/�1 þ /1Þ=2
Now, the rotation angle b between the two corresponding
edges can be obtained from b ¼ /1e � /2e.
This method leads to an ambiguity of p radians, which
can be eliminated with an additional test discussed in the
next section.
As a result we can simultaneously determine edge corre-
spondence and estimate transformation parameters (trans-
lation,
scale) utilizing Fourier Descriptors.
Combination of the second and third alignment step sim-
plifies the algorithm and improves overall performance.
rotation,
3.4. Refinement of the transformation
From the estimated transformation parameters, we can
derive the transformation matrix and use it to align the tar-
get image with the reference. This alignment can be further
refined with the Iterative Closest Point (ICP) technique
[13], which is widely used for aligning 2D and 3D point
sets. The ICP algorithm has many advantages; it is simple,
general-purpose, and also highly accurate. However, one
must provide a good initial estimate for the transformation
before initiating it. In our case a reliable transformation
estimate can be easily obtained using the Fourier Descrip-
tors, which makes ICP very attractive for the refinement of
our image alignment.
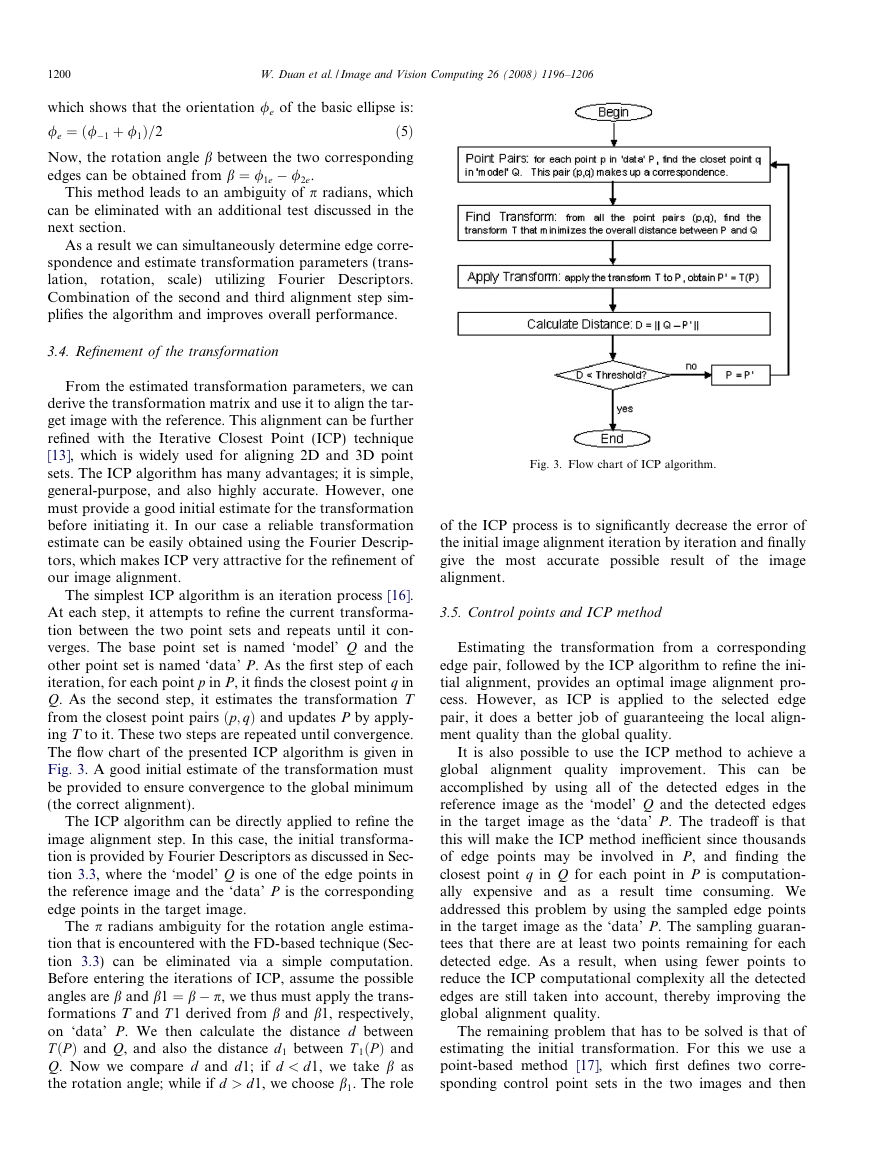
The simplest ICP algorithm is an iteration process [16].
At each step, it attempts to refine the current transforma-
tion between the two point sets and repeats until it con-
verges. The base point set is named ‘model’ Q and the
other point set is named ‘data’ P. As the first step of each
iteration, for each point p in P, it finds the closest point q in
Q. As the second step, it estimates the transformation T
from the closest point pairs ðp; qÞ and updates P by apply-
ing T to it. These two steps are repeated until convergence.
The flow chart of the presented ICP algorithm is given in
Fig. 3. A good initial estimate of the transformation must
be provided to ensure convergence to the global minimum
(the correct alignment).
The ICP algorithm can be directly applied to refine the
image alignment step. In this case, the initial transforma-
tion is provided by Fourier Descriptors as discussed in Sec-
tion 3.3, where the ‘model’ Q is one of the edge points in
the reference image and the ‘data’ P is the corresponding
edge points in the target image.
The p radians ambiguity for the rotation angle estima-
tion that is encountered with the FD-based technique (Sec-
tion 3.3) can be eliminated via a simple computation.
Before entering the iterations of ICP, assume the possible
angles are b and b1 ¼ b � p, we thus must apply the trans-
formations T and T 1 derived from b and b1, respectively,
on ‘data’ P. We then calculate the distance d between
TðPÞ and Q, and also the distance d 1 between T 1ðPÞ and
Q. Now we compare d and d1; if d < d1, we take b as
the rotation angle; while if d > d1, we choose b1. The role
Fig. 3. Flow chart of ICP algorithm.
of the ICP process is to significantly decrease the error of
the initial image alignment iteration by iteration and finally
give the most accurate possible result of
the image
alignment.
3.5. Control points and ICP method
Estimating the transformation from a corresponding
edge pair, followed by the ICP algorithm to refine the ini-
tial alignment, provides an optimal image alignment pro-
cess. However, as ICP is applied to the selected edge
pair, it does a better job of guaranteeing the local align-
ment quality than the global quality.
It is also possible to use the ICP method to achieve a
global alignment quality improvement. This can be
accomplished by using all of the detected edges in the
reference image as the ‘model’ Q and the detected edges
in the target image as the ‘data’ P. The tradeoff is that
this will make the ICP method inefficient since thousands
of edge points may be involved in P, and finding the
closest point q in Q for each point in P is computation-
ally expensive and as a result
time consuming. We
addressed this problem by using the sampled edge points
in the target image as the ‘data’ P. The sampling guaran-
tees that there are at least two points remaining for each
detected edge. As a result, when using fewer points to
reduce the ICP computational complexity all the detected
edges are still taken into account, thereby improving the
global alignment quality.
The remaining problem that has to be solved is that of
estimating the initial transformation. For this we use a
point-based method [17], which first defines two corre-
sponding control point sets in the two images and then
�
W. Duan et al. / Image and Vision Computing 26 (2008) 1196–1206
1201
derives the transformation parameters from them. In fact,
the transformation parameters can be efficiently estimated
[18] once the corresponding control points have been
defined.
We define the corresponding control points as the cen-
troid points of the detected edges, that is, two centroid
points of one corresponding edge pair compose one corre-
sponding control point pair. This provides a reliable yet
simple estimate of the transformation. Alternatively, we
also could use the transformation estimation from any pair
of corresponding edges based on the Fourier Descriptors
method.
In summary, the combination of Fourier Descriptors
with the ICP method operates as follows:
(1) Edge detection and linking
(2) Edge correspondence identification using Fourier
Descriptors
(3) Control point selection from the centroid points of
corresponding edges
(4) Transformation estimation based on control points
or one corresponding edge pair
(5) Sampling of edge points in the target image and
application of ICP method to refine the estimated
transformation
It should be mentioned that if the detected edges in the
images are the boundaries of the objects, then the same
objects in the target image and in the reference image are
well aligned by our algorithm.
4. Results
The proposed algorithm for image alignment was imple-
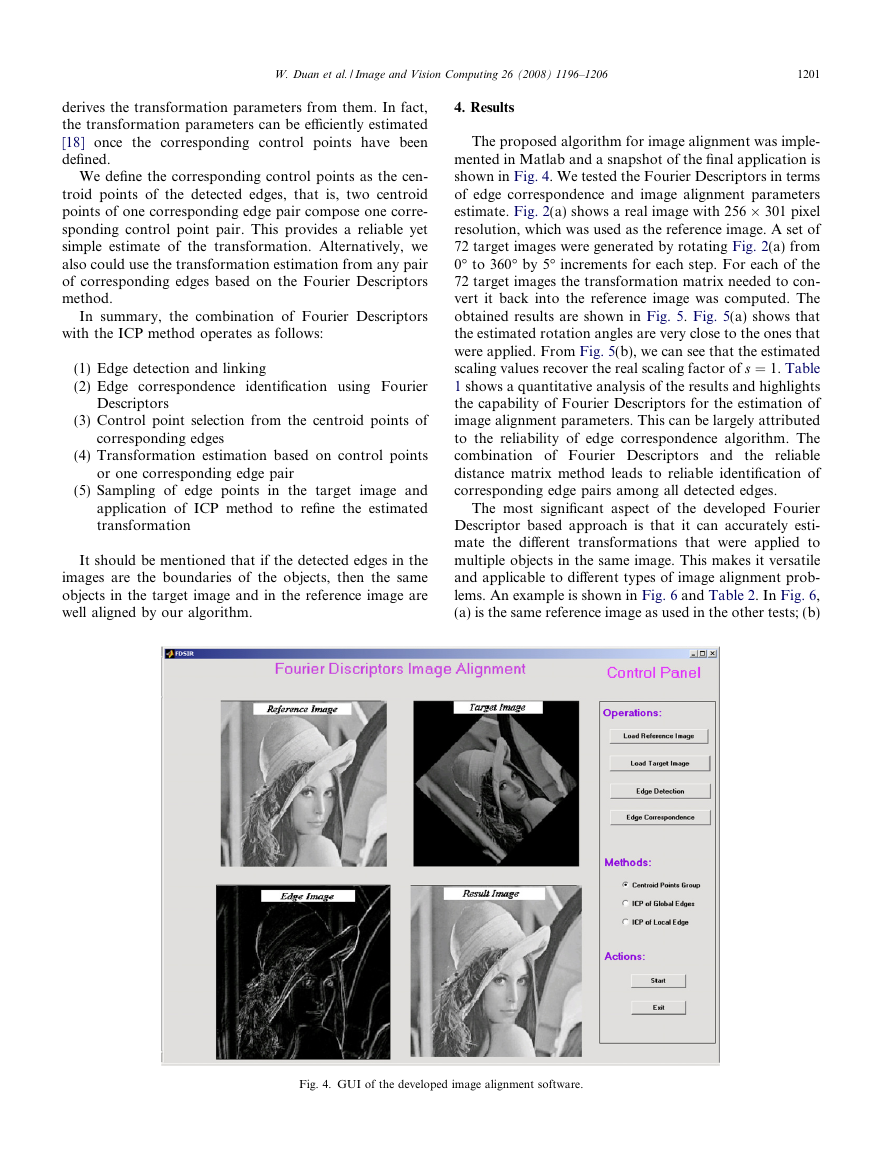
mented in Matlab and a snapshot of the final application is
shown in Fig. 4. We tested the Fourier Descriptors in terms
of edge correspondence and image alignment parameters
estimate. Fig. 2(a) shows a real image with 256 � 301 pixel
resolution, which was used as the reference image. A set of
72 target images were generated by rotating Fig. 2(a) from
0° to 360° by 5° increments for each step. For each of the
72 target images the transformation matrix needed to con-
vert it back into the reference image was computed. The
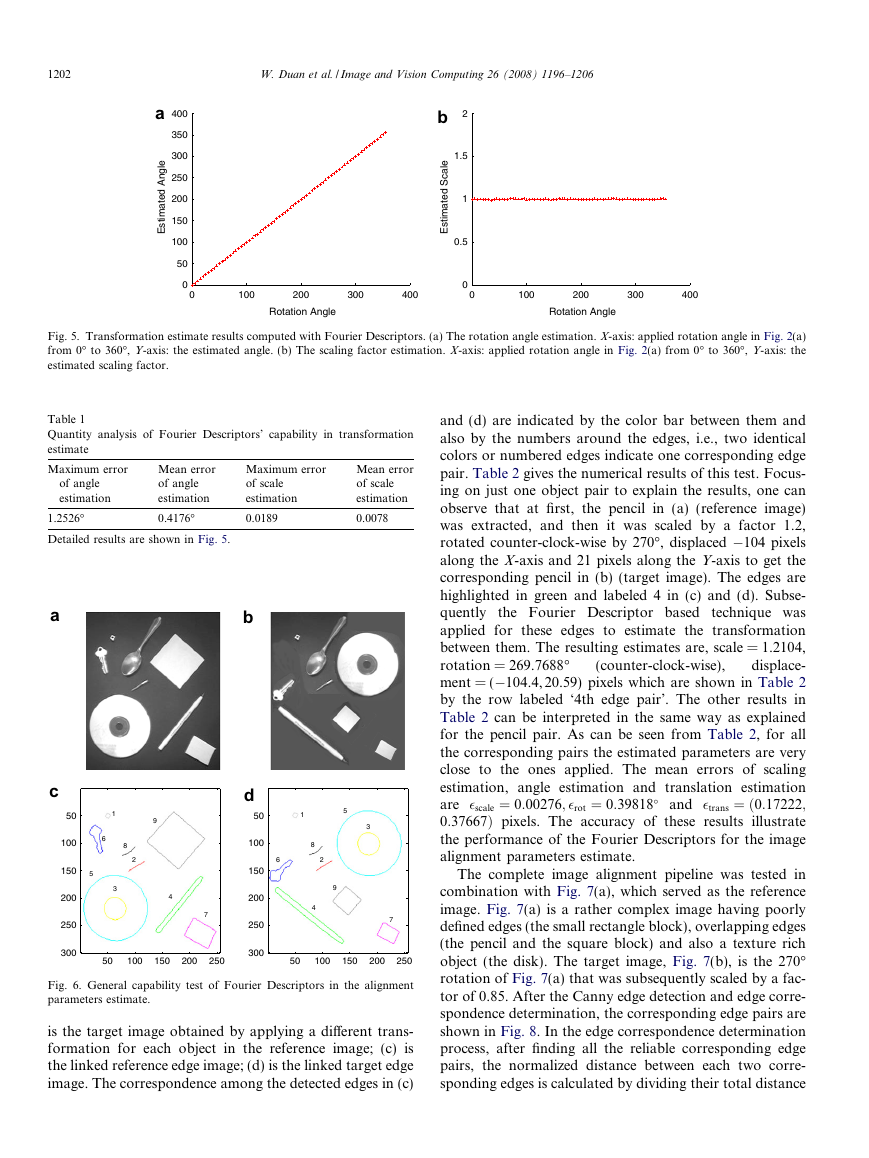
obtained results are shown in Fig. 5. Fig. 5(a) shows that
the estimated rotation angles are very close to the ones that
were applied. From Fig. 5(b), we can see that the estimated
scaling values recover the real scaling factor of s ¼ 1. Table
1 shows a quantitative analysis of the results and highlights
the capability of Fourier Descriptors for the estimation of
image alignment parameters. This can be largely attributed
to the reliability of edge correspondence algorithm. The
combination of Fourier Descriptors and the reliable
distance matrix method leads to reliable identification of
corresponding edge pairs among all detected edges.
The most significant aspect of the developed Fourier
Descriptor based approach is that it can accurately esti-
mate the different transformations that were applied to
multiple objects in the same image. This makes it versatile
and applicable to different types of image alignment prob-
lems. An example is shown in Fig. 6 and Table 2. In Fig. 6,
(a) is the same reference image as used in the other tests; (b)
Fig. 4. GUI of the developed image alignment software.
�
1202
W. Duan et al. / Image and Vision Computing 26 (2008) 1196–1206
a
l
e
g
n
A
d
e
a
m
t
i
t
s
E
400
350
300
250
200
150
100
50
0
0
b
2
l
e
a
c
S
d
e
a
m
t
i
t
s
E
100
200
300
400
Rotation Angle
1.5
1
0.5
0
0
100
200
300
400
Rotation Angle
Fig. 5. Transformation estimate results computed with Fourier Descriptors. (a) The rotation angle estimation. X-axis: applied rotation angle in Fig. 2(a)
from 0° to 360°, Y-axis: the estimated angle. (b) The scaling factor estimation. X-axis: applied rotation angle in Fig. 2(a) from 0° to 360°, Y-axis: the
estimated scaling factor.
Table 1
Quantity analysis of Fourier Descriptors’ capability in transformation
estimate
Maximum error
of angle
estimation
1.2526°
Mean error
of angle
estimation
0.4176°
Maximum error
of scale
estimation
0.0189
Mean error
of scale
estimation
0.0078
Detailed results are shown in Fig. 5.
a
c
50
100
150
5
200
250
300
9
8
2
6
1
3
4
7
50
100
150
200
250
b
d
50
100
150
200
250
300
1
5
3
6
8
2
4
9
7
50
100
150
200
250
Fig. 6. General capability test of Fourier Descriptors in the alignment
parameters estimate.
is the target image obtained by applying a different trans-
formation for each object in the reference image; (c) is
the linked reference edge image; (d) is the linked target edge
image. The correspondence among the detected edges in (c)
and (d) are indicated by the color bar between them and
also by the numbers around the edges, i.e., two identical
colors or numbered edges indicate one corresponding edge
pair. Table 2 gives the numerical results of this test. Focus-
ing on just one object pair to explain the results, one can
observe that at first, the pencil in (a) (reference image)
was extracted, and then it was scaled by a factor 1.2,
rotated counter-clock-wise by 270°, displaced �104 pixels
along the X-axis and 21 pixels along the Y-axis to get the
corresponding pencil in (b) (target image). The edges are
highlighted in green and labeled 4 in (c) and (d). Subse-
quently the Fourier Descriptor based technique was
applied for these edges to estimate the transformation
between them. The resulting estimates are, scale = 1.2104,
rotation = 269.7688°
displace-
ment = (�104.4, 20.59) pixels which are shown in Table 2
by the row labeled ‘4th edge pair’. The other results in
Table 2 can be interpreted in the same way as explained
for the pencil pair. As can be seen from Table 2, for all
the corresponding pairs the estimated parameters are very
close to the ones applied. The mean errors of scaling
estimation, angle estimation and translation estimation
are �scale ¼ 0:00276; �rot ¼ 0:39818� and �trans ¼ ð0:17222;
0:37667Þ pixels. The accuracy of these results illustrate
the performance of the Fourier Descriptors for the image
alignment parameters estimate.
(counter-clock-wise),
The complete image alignment pipeline was tested in
combination with Fig. 7(a), which served as the reference
image. Fig. 7(a) is a rather complex image having poorly
defined edges (the small rectangle block), overlapping edges
(the pencil and the square block) and also a texture rich
object (the disk). The target image, Fig. 7(b), is the 270°
rotation of Fig. 7(a) that was subsequently scaled by a fac-
tor of 0.85. After the Canny edge detection and edge corre-
spondence determination, the corresponding edge pairs are
shown in Fig. 8. In the edge correspondence determination
process, after finding all the reliable corresponding edge
pairs, the normalized distance between each two corre-
sponding edges is calculated by dividing their total distance
�
W. Duan et al. / Image and Vision Computing 26 (2008) 1196–1206
1203
Table 2
Alignment parameter estimates for Fig. 6, based on Fourier Descriptors
Edge pair
Scaling
Used
Estimated
1st
2nd
3rd
4th
5th
6th
7th
8th
9th
1.0
1.0
1.0
1.2
1.0
1.0
0.7
1.0
0.5
1.0
1.0
1.0
1.2053
0.9995
1.0110
0.6953
1.0033
0.5000
Angle (°)
Used
Estimated
0
0
0
270
0
60
0
0
0
0.0
0.0
0.0
269.8153
�0.7973
61.2721
�0.7312
0.2109
�0.3874
Error
0.0
0.0
0.0
0.0053
0.0005
0.0110
0.0047
0.0033
0.0
Error
0.0
0.0
0.0
0.1847
0.7973
1.2721
0.7312
0.2109
0.3874
Mean error
0.00276
0.39818
Translation (pixel)
Used
Estimated
Error
(0, 0)
(0, 0)
(120,�117)
(�104, 21)
(120,�117)
(�7, 57)
(0, 0)
(0, 0)
(�30, 110)
(0.17222, 0.37667)
(0.0, 0.0)
(0.0, 0.0)
(120.0,�117.0)
(�104.15, 20.63)
(120.0,�117.0)
(�7.94, 59.63)
(0.42,�0.04)
(0.0, 0.04)
(�30.04, 110.31)
(0.0, 0.0)
(0.0, 0.0)
(0.0, 0.0)
(0.15, 0.37)
(0.0, 0.0)
(0.94, 2.63)
(0.42, 0.04)
(0.0, 0.04)
(0.04, 0.31)
tion from these control points, and then apply the ICP
method to refine the alignment. Fig. 9(a) is the direct over-
lap of the two edge images after edge correspondence deter-
mination; Fig. 9(b) shows the result after applying the
estimated transformation on the target edge image and
Fig. 9(c) shows the result after 12 iterations of ICP refine-
ment process. Table 3 gives the numerical error results of
the transformation estimation and ICP refinement process.
From Fig. 9(a) and (b), we can see that just after applying
the estimated transformation on the reference edge image,
the target edge image is already well aligned with the refer-
ence one. The mean distance from one edge point in the
target image to its closest point in the reference image is
3.51 pixels. After the ICP process, the target image is much
better aligned with the reference image in Fig. 9(c) than in
Fig. 9(b), showing that the image alignment quality is
improved by the ICP method. The mean distance from
one edge point in the target image to its closest point in
the reference image is well reduced from 3.51 pixels to
0.75 pixels. Because of the good initial transformation esti-
mate, the ICP process converges after only 12 iterations. In
fact, after only two iterations, the mean distance is already
below 1 pixel. From the quick converge and the small
alignment error, we can see that the proposed algorithm
is very efficient and accurate.
Fig. 7. Input images used for the complete image alignment pipeline tests.
(a) Rather complex reference image having poorly defined edges,
overlapping edges and also texture rich objects. (b) Target image obtained
by 270° rotation of (a) and then scaled by the factor 0.85.
by the point number of the sampled edge. All the corre-
sponding edge pairs are then ranked by the normalized dis-
tance. This allows the first edge pair to become the most
reliable pair among the corresponding pairs with the last
one being the least reliable. The correspondence reliability
result is shown by the color bar in Fig. 8. From the corre-
sponding edge pairs, we determine the centroid points as
the corresponding control points, estimate the transforma-
a
b
l
)
s
e
x
p
(
i
Y
50
100
150
200
250
300
2
5
1
3
4
l
)
s
e
x
p
(
i
Y
2
5
3
1
50
100
150
200
4
50
100
150
X (pixels)
200
250
50
100
150
X (pixels)
200
250
Fig. 8. Corresponding edge identification. Identical colors and labels in (a) and (b) present corresponding edge pairs. The color bar between (a) and (b) is
the correspondence reliability indicator. Smaller numbers indicate a more reliable pair and bigger numbers a less reliable pair. The black crosses inside the
edges are the centroid points, which are used to estimate the transformation between reference and target image.
�


 2023年江西萍乡中考道德与法治真题及答案.doc
 2012年重庆南川中考生物真题及答案.doc
 2013年江西师范大学地理学综合及文艺理论基础考研真题.doc
 2020年四川甘孜小升初语文真题及答案I卷.doc
 2020年注册岩土工程师专业基础考试真题及答案.doc
 2023-2024学年福建省厦门市九年级上学期数学月考试题及答案.doc
 2021-2022学年辽宁省沈阳市大东区九年级上学期语文期末试题及答案.doc
 2022-2023学年北京东城区初三第一学期物理期末试卷及答案.doc
 2018上半年江西教师资格初中地理学科知识与教学能力真题及答案.doc
 2012年河北国家公务员申论考试真题及答案-省级.doc
 2020-2021学年江苏省扬州市江都区邵樊片九年级上学期数学第一次质量检测试题及答案.doc
 2022下半年黑龙江教师资格证中学综合素质真题及答案.doc