(Draft -- May 28, 1998 -- Draft)
Specifications for the
Analog to Digital Conversion of Voice by 2,400 Bit/Second
Mixed Excitation Linear Prediction
1.
INTRODUCTION
This standard describes the interoperability requirements relating to the conversion of analog
voice to 2,400 bits/s digitized voice by a method known as Mixed Excitation Linear Prediction (MELP)
and reconversion back to analog voice. An algorithm description is also included to aid implementa-
tion as well as a performance verification process to verify an implementation.
2. CONVENTIONS AND DEFINITIONS
2.1 Frame Size
A MELP frame interval is 22.5 ms
0.01
percent in duration and contains 180 voice samples
(8,000 samples/s).
2.2 Analog Specification
The recommended analog requirements for the MELP coder are for a nominal bandwidth ranging
from 100 Hz to 3800 Hz. Although the MELP coder will operate with a more band limited signal, per-
formance degradation will result. To ensure proper operation of the MELP coder, the A/D conversion
process should produce peak values of (or near) -32768 and 32767. Additionally, the coder should have
unity gain, which means that the output speech level should match that of the input speech.
3. ALGORITHM DESCRIPTION
3.1 Coder Overview
The Mixed Excitation Linear Prediction coder is based on the traditional Linear Prediction Cod-
ing (LPC) parametric model, but also includes five additional features [1][2]. These are: mixed excita-
tion, aperiodic pulses, adaptive spectral enhancement, pulse dispersion, and Fourier magnitude
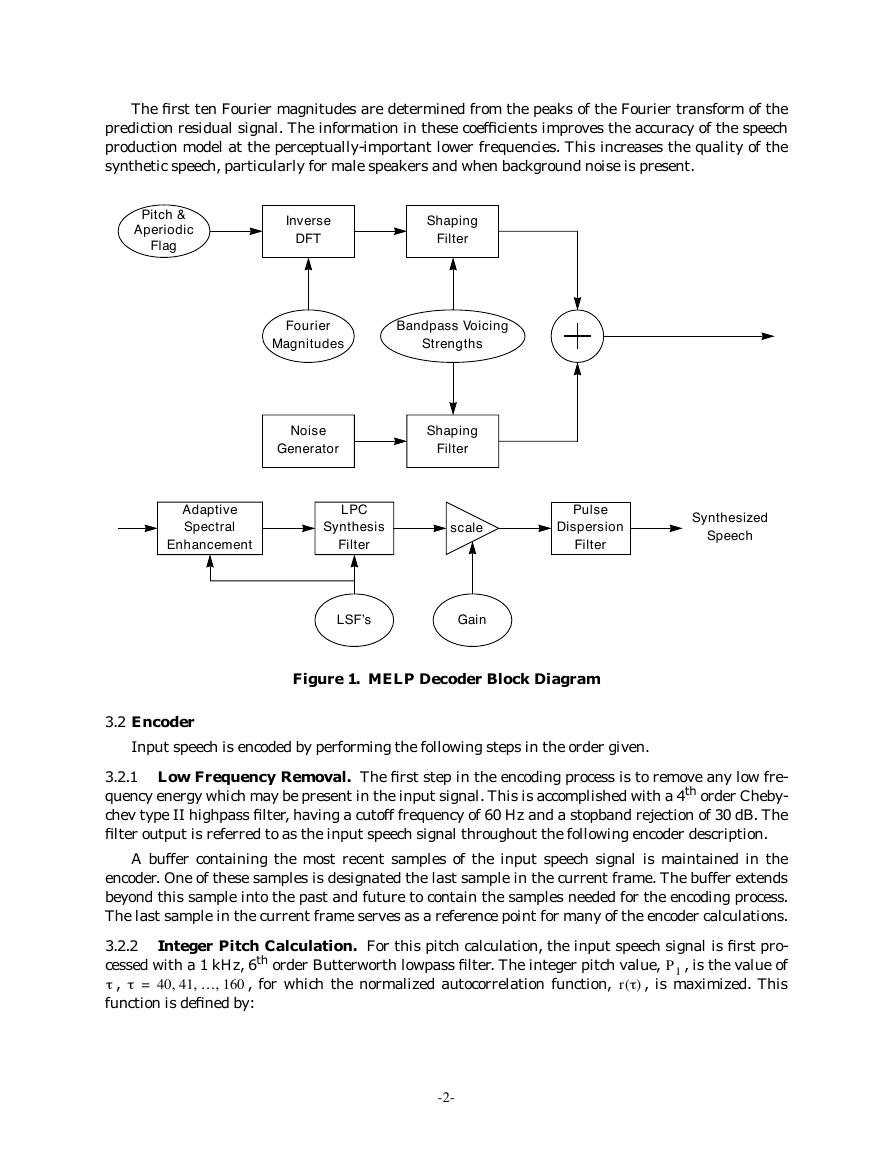
modeling. These features are illustrated in the MELP decoder block diagram shown in Figure 1.
The mixed excitation is implemented using a multi-band mixing model. This model can simulate
frequency-dependent voicing strength using an adaptive filtering structure implemented with a fixed
filter bank. The primary effect of this mixed excitation is to reduce the buzz usually associated with
LPC vocoders, especially in broadband acoustic noise.
When the input speech is voiced, the MELP coder can synthesize using either periodic or aperi-
odic pulses. Aperiodic pulses are used most often during transition regions between voiced and
unvoiced segments of the speech signal. This feature enables the decoder to reproduce erratic glottal
pulses without introducing tonal sounds.
The adaptive spectral enhancement filter is based on the poles of the linear prediction synthesis
filter. Its use enhances the formant structure of the synthetic speech and improves the match between
the synthetic and natural bandpass waveforms. It also gives the synthetic speech a more natural
quality.
Pulse dispersion is implemented using a fixed filter based on a spectrally-flattened triangle pulse.
This filter spreads the excitation energy within a pitch period, reducing some of the harsh quality of
the synthetic speech.
-1-
–
�
The first ten Fourier magnitudes are determined from the peaks of the Fourier transform of the
prediction residual signal. The information in these coefficients improves the accuracy of the speech
production model at the perceptually-important lower frequencies. This increases the quality of the
synthetic speech, particularly for male speakers and when background noise is present.
Pitch &
Aperiodic
Flag
Inverse
DFT
Shaping
Filter
Fourier
Magnitudes
Bandpass Voicing
Strengths
Noise
Generator
Shaping
Filter
Adaptive
Spectral
Enhancement
LPC
Synthesis
Filter
scale
Pulse
Dispersion
Filter
Synthesized
Speech
LSF’s
Gain
Figure 1. MELP Decoder Block Diagram
3.2 Encoder
Input speech is encoded by performing the following steps in the order given.
3.2.1 Low Frequency Removal. The first step in the encoding process is to remove any low fre-
quency energy which may be present in the input signal. This is accomplished with a 4th order Cheby-
chev type II highpass filter, having a cutoff frequency of 60 Hz and a stopband rejection of 30 dB. The
filter output is referred to as the input speech signal throughout the following encoder description.
A buffer containing the most recent samples of the input speech signal is maintained in the
encoder. One of these samples is designated the last sample in the current frame. The buffer extends
beyond this sample into the past and future to contain the samples needed for the encoding process.
The last sample in the current frame serves as a reference point for many of the encoder calculations.
3.2.2
cessed with a 1 kHz, 6th order Butterworth lowpass filter. The integer pitch value,
Integer Pitch Calculation. For this pitch calculation, the input speech signal is first pro-
, is the value of
, is maximized. This
, for which the normalized autocorrelation function,
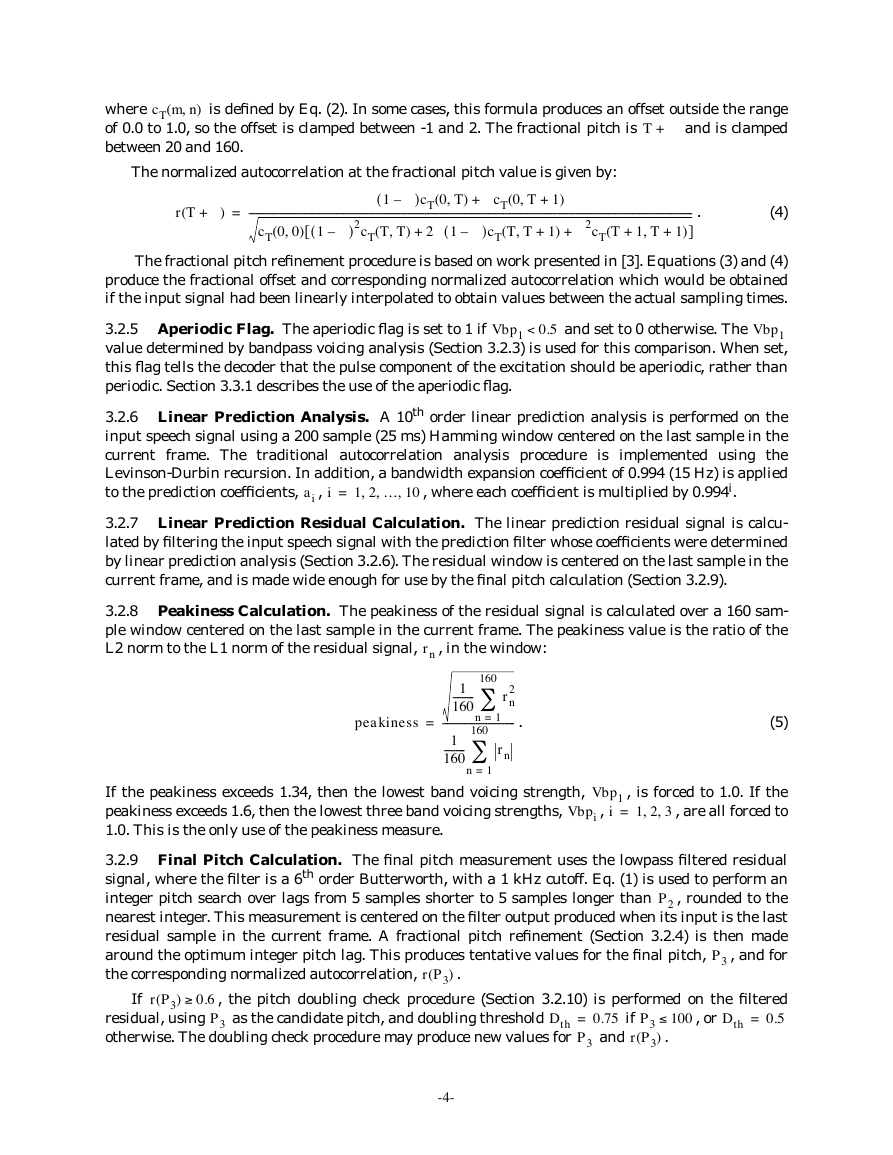
r t( )
P1
,
,
=
40 41 … 160
function is defined by:
,
,
-2-
t
t
�
where
r t( )
=
ct 0 t,(
---------------------------------------
ct 0 0,(
)
)ct
)
t,(
,
ct m n,
(
)
=
–
2⁄
79+
k
=
–
2⁄
80–
sk m+ sk
n+
,
(1)
(2)
2⁄
s0
represents truncation to an integer value. The center of the pitch analysis window is at
and
in Eq. (2). For the integer pitch calculation, this window is centered on the last sample in
sample
when its input is the last sample in the cur-
the current frame. The lowpass filter output is sample
rent frame. The time index
in the autocorrelation preserves the pitch analysis window alignment
around its center point; the normalization compensates for changing signal amplitudes. The final
pitch calculation (Section 3.2.9) extends the pitch range to a lag of 20 samples.
s0
k
3.2.3 Bandpass Voicing Analysis. This portion of the encoder determines the five bandpass voic-
ing strengths,
. It also refines the integer pitch measurement and the correspond-
ing normalized autocorrelation value. The bandpass voicing analysis begins by filtering the input
speech signal into five frequency bands. These filters are 6th order Butterworth, with passbands of 0-
500, 500-1000, 1000-2000, 2000-3000, and 3000-4000 Hz.
,
1 2 … 5
,
Vbpi
=
,
,
i
A refined pitch measurement is made using the 0-500 Hz filter output signal. This measurement
is centered on the filter output produced when its input is the last sample in the current frame. Two
pitch candidates are considered in this refinement, namely the integer pitch values
from the cur-
rent and previous frames. For each candidate, Eq. (1) is used to perform an integer pitch search over
lags from 5 samples shorter to 5 samples longer than the candidate, and a fractional pitch refinement
(Section 3.2.4) is performed around the optimum integer pitch lag. This produces two fractional pitch
candidates and their corresponding normalized autocorrelation values. The candidate having the
higher normalized autocorrelation is selected as the fractional pitch,
. The corresponding normal-
ized autocorrelation,
is saved for use in
Vbp1 P2
determining the voicing strength for the remaining frequency bands. It is also used in the final pitch
calculation (Section 3.2.9) and gain calculation (Section 3.2.11).
P2
, is saved as the lowest band voicing strength,
r P2(
P1
(
)
)
.
r P2(
)
For each remaining band, the bandpass voicing strength is the larger of
as determined by
the fractional pitch procedure for the bandpass signal and the time envelope of the bandpass signal,
where
for the time envelope is first decremented by 0.1 to compensate for an experimentally
observed bias (due to the smoothness of the time envelope signals). The envelopes are calculated by
full-wave rectification followed by a smoothing filter. This filter consists of a zero at DC in cascade
with a complex pole pair at 150 Hz with a radius of 0.97. For each calculation of
, the analysis
window is centered on the last sample in the current frame, as was the case for the first band.
r P2(
r P2(
)
)
3.2.4 Fractional Pitch Refinement. This procedure, which is used at several places in the encod-
ing process, utilizes an interpolation formula to increase the accuracy of an input pitch value. This
value is first rounded to the nearest integer. Assume that this integer has a value of T samples. The
interpolation formula presumes that
has a maximum between lags of T and T+1. Hence,
are computed and compared to determine if the maximum is more likely
cT 0 T 1–
to fall between T and T+1 or between T-1 and T. If
, then the maximum proba-
bly falls between T-1 and T and the pitch, T, is decremented by one prior to interpolation. The frac-
tional offset,
cT 0 T 1–
cT 0 T
cT 0 T
and
r t( )
,(
,(
,(
,(
1+
1+
>
)
)
)
)
, is then computed by the interpolation equation:
cT 0 T,(
,(
–
[
cT 0 T,(
) cT T
(
-----------------------------------------------------------------------------------------------------------------------------------------------------------------------------------------------------
]
cT 0 T
)
)cT T T,(
)
]
+
)
)cT T T
1+
1+
,(
cT T T
) cT T T,(
[
cT T T
cT 0 T
1+
,
T
,(
–
)
)
1+
,(
,(
1+
1+
1+
–
)
=
,
(3)
-3-
t
t
t
t
D
D
�
cT m n,
(
)
where
of 0.0 to 1.0, so the offset is clamped between -1 and 2. The fractional pitch is
between 20 and 160.
is defined by Eq. (2). In some cases, this formula produces an offset outside the range
and is clamped
D+
T
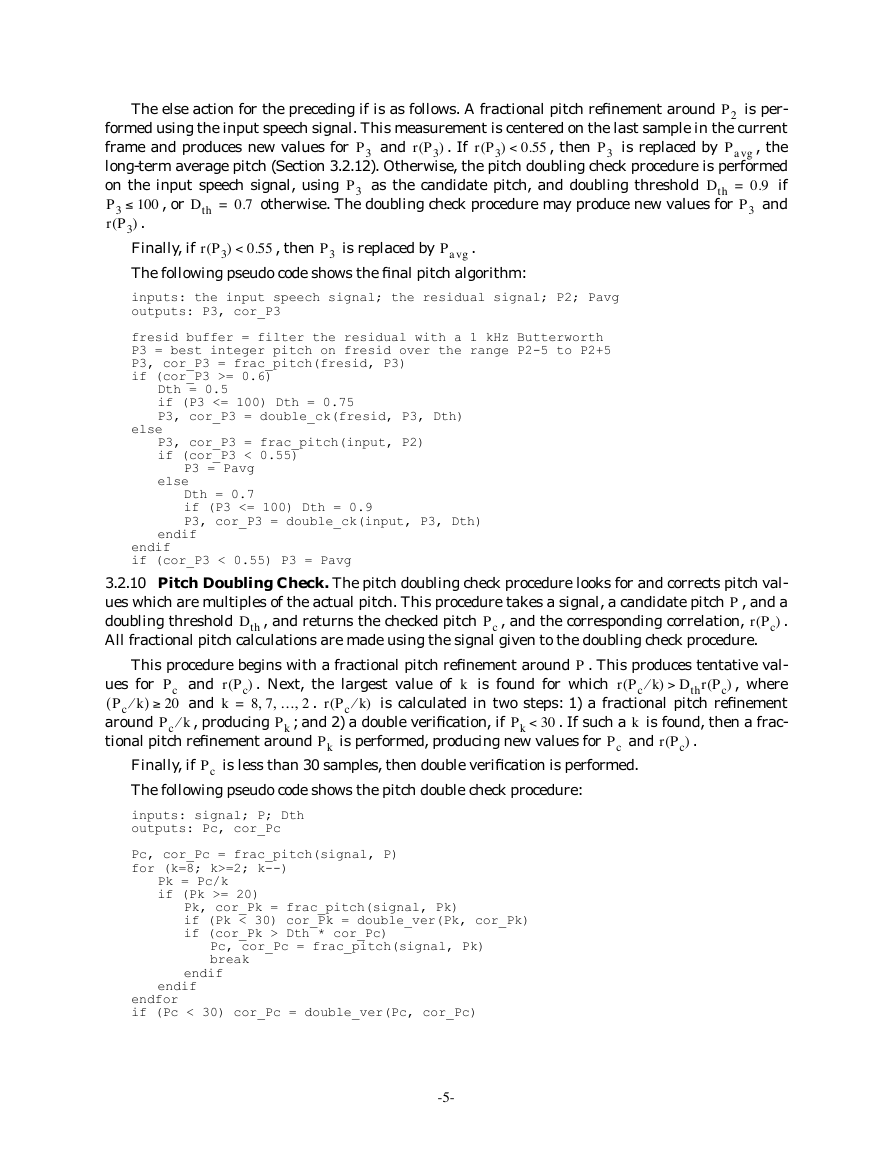
The normalized autocorrelation at the fractional pitch value is given by:
D+(
r T
)
=
---------------------------------------------------------------------------------------------------------------------------------------------------------------------------------------
]
cT 0 0,(
)
D 2cT T
,+(
D–(
[
) 1
1 T
1+
1+
+
)
)
D–(
1
)2cT T T,(
+
)cT 0 T,(
)
2D
D–(
+
1
,(
D cT 0 T
)cT T T
,(
1+
)
.
(4)
The fractional pitch refinement procedure is based on work presented in [3]. Equations (3) and (4)
produce the fractional offset and corresponding normalized autocorrelation which would be obtained
if the input signal had been linearly interpolated to obtain values between the actual sampling times.
0.5<
Vbp1
and set to 0 otherwise. The
3.2.5 Aperiodic Flag. The aperiodic flag is set to 1 if
Vbp1
value determined by bandpass voicing analysis (Section 3.2.3) is used for this comparison. When set,
this flag tells the decoder that the pulse component of the excitation should be aperiodic, rather than
periodic. Section 3.3.1 describes the use of the aperiodic flag.
3.2.6 Linear Prediction Analysis. A 10th order linear prediction analysis is performed on the
input speech signal using a 200 sample (25 ms) Hamming window centered on the last sample in the
current frame. The traditional autocorrelation analysis procedure is implemented using the
Levinson-Durbin recursion. In addition, a bandwidth expansion coefficient of 0.994 (15 Hz) is applied
to the prediction coefficients,
, where each coefficient is multiplied by 0.994i.
1 2 … 10
,
=
,
,
,
i
ai
3.2.7 Linear Prediction Residual Calculation. The linear prediction residual signal is calcu-
lated by filtering the input speech signal with the prediction filter whose coefficients were determined
by linear prediction analysis (Section 3.2.6). The residual window is centered on the last sample in the
current frame, and is made wide enough for use by the final pitch calculation (Section 3.2.9).
3.2.8 Peakiness Calculation. The peakiness of the residual signal is calculated over a 160 sam-
ple window centered on the last sample in the current frame. The peakiness value is the ratio of the
L2 norm to the L1 norm of the residual signal,
, in the window:
rn
peakiness
=
160
1
---------
160
2
rn
------------------------------
1=
n
1
---------
160
160
n
1=
rn
.
(5)
If the peakiness exceeds 1.34, then the lowest band voicing strength,
peakiness exceeds 1.6, then the lowest three band voicing strengths,
1.0. This is the only use of the peakiness measure.
Vbpi
, is forced to 1.0. If the
Vbp1
,
, are all forced to
=
,
1 2 3
,
i
3.2.9 Final Pitch Calculation. The final pitch measurement uses the lowpass filtered residual
signal, where the filter is a 6th order Butterworth, with a 1 kHz cutoff. Eq. (1) is used to perform an
integer pitch search over lags from 5 samples shorter to 5 samples longer than
, rounded to the
nearest integer. This measurement is centered on the filter output produced when its input is the last
residual sample in the current frame. A fractional pitch refinement (Section 3.2.4) is then made
around the optimum integer pitch lag. This produces tentative values for the final pitch,
, and for
the corresponding normalized autocorrelation,
P2
P3
.
r P3(
)
If
0.6
r P3(
)
residual, using
Dth
otherwise. The doubling check procedure may produce new values for
, the pitch doubling check procedure (Section 3.2.10) is performed on the filtered
0.5
P3
as the candidate pitch, and doubling threshold
0.75
and
Dth
, or
100
=
.
)
=
P3
if
P3
r P3(
-4-
‡
£
�
The else action for the preceding if is as follows. A fractional pitch refinement around
is per-
formed using the input speech signal. This measurement is centered on the last sample in the current
frame and produces new values for
, the
long-term average pitch (Section 3.2.12). Otherwise, the pitch doubling check procedure is performed
on the input speech signal, using
if
0.9
and
P3
r P3(
Dth
otherwise. The doubling check procedure may produce new values for
as the candidate pitch, and doubling threshold
100
.
)
Finally, if
The following pseudo code shows the final pitch algorithm:
is replaced by
is replaced by
=
P3
, then
, then
Pavg
Pavg
and
r P3(
r P3(
r P3(
Dth
0.55
0.55
, or
)
. If
=
0.7
<
)
<
)
P2
P3
P3
P3
P3
.
inputs: the input speech signal; the residual signal; P2; Pavg
outputs: P3, cor_P3
fresid buffer = filter the residual with a 1 kHz Butterworth
P3 = best integer pitch on fresid over the range P2-5 to P2+5
P3, cor_P3 = frac_pitch(fresid, P3)
if (cor_P3 >= 0.6)
Dth = 0.5
if (P3 <= 100) Dth = 0.75
P3, cor_P3 = double_ck(fresid, P3, Dth)
else
P3, cor_P3 = frac_pitch(input, P2)
if (cor_P3 < 0.55)
P3 = Pavg
else
Dth = 0.7
if (P3 <= 100) Dth = 0.9
P3, cor_P3 = double_ck(input, P3, Dth)
endif
endif
if (cor_P3 < 0.55) P3 = Pavg
3.2.10 Pitch Doubling Check. The pitch doubling check procedure looks for and corrects pitch val-
ues which are multiples of the actual pitch. This procedure takes a signal, a candidate pitch , and a
doubling threshold
.
r Pc(
)
All fractional pitch calculations are made using the signal given to the doubling check procedure.
P
, and the corresponding correlation,
, and returns the checked pitch
Dth
Pc
This procedure begins with a fractional pitch refinement around
. Next, the largest value of
r Pc(
)
8 7 … 2
,
,
=
k
; and 2) a double verification, if
, producing
. This produces tentative val-
, where
is calculated in two steps: 1) a fractional pitch refinement
. If such a is found, then a frac-
is found for which
>
) Dthr Pc(
)
and
and
r Pc k⁄
(
r Pc k⁄
(
ues for
Pc k⁄
(
)
around
tional pitch refinement around
Pc
20
Pc k⁄
,
Pk
is performed, producing new values for
k
and
30<
Pk
P
k
)
.
Pc
r Pc(
)
.
Pk
Finally, if
The following pseudo code shows the pitch double check procedure:
is less than 30 samples, then double verification is performed.
Pc
inputs: signal; P; Dth
outputs: Pc, cor_Pc
Pc, cor_Pc = frac_pitch(signal, P)
for (k=8; k>=2; k--)
Pk = Pc/k
if (Pk >= 20)
Pk, cor_Pk = frac_pitch(signal, Pk)
if (Pk < 30) cor_Pk = double_ver(Pk, cor_Pk)
if (cor_Pk > Dth * cor_Pc)
Pc, cor_Pc = frac_pitch(signal, Pk)
break
endif
endif
endfor
if (Pc < 30) cor_Pc = double_ver(Pc, cor_Pc)
-5-
£
‡
�
For inputs
P
and
r P( )
, the double verification procedure returns the smaller of
r 2P(
where
in the double check procedure provides robustness against spurious short pitch values.
is determined by the fractional pitch procedure around
2P
)
,
)
. The use of double verification
and
r 2P(
r P( )
Vbp1
0.6>
, the window length is the shortest multiple of
3.2.11 Gain Calculation. The input speech signal gain is measured twice per frame using a pitch-
adaptive window length. This length is identical for both gain measurements and is determined as
which is longer than 120
follows. When
samples. If this length exceeds 320 samples, it is divided by 2. When
, the window length is
0.6
and is centered 90 samples before
120 samples. The gain calculation for the first window produces
the last sample in the current frame. The calculation for the second window produces
and is cen-
tered on the last sample in the current frame. The gain is the RMS value, measured in dB, of the sig-
nal in the window,
P2
Vbp1
G1
G2
:
sn
Gi
=
10log10 0.01
+
1
---
L
L
n
1=
2
sn
,
(6)
L
is the window length. The 0.01 term prevents the log argument from going too close to zero.
where
If a gain measurement is less than 0.0, it is clamped to 0.0. The gain measurement assumes that the
input signal range is -32768 to 32767 (Section 2.2).
3.2.12 Average Pitch Update. The long-term average pitch,
smoothing procedure. If
three most recent strong pitch values,
are moved toward a default pitch,
> 30 dB, then
G2
,
=
i
50=
,
1 2 3
samples, according to:
, is updated with a simple
is placed into a buffer containing the
. Otherwise, all three pitch values in the buffer
Pavg
r P3(
P3
)
,
+
0.05Pdefault
,
i
=
,
1 2 3
,
.
(7)
> 0.8 and
pi
Pdefault
0.95 pi
=
pi
The average pitch is then updated as the median of the three values in the buffer.
final pitch calculation (Section 3.2.9).
Pavg
is used in the
,
,
=
1 2 … 10
,
3.2.13 Quantization of Prediction Coefficients. First, the linear prediction coefficients
,
ai
, are converted into line spectrum frequencies (LSF’s). Details of the conversion algo-
i
rithm can be found in [4]. Next, a process which forces the LSF components to be in ascending order
with a minimum separation of 50 Hz is performed. This process begins by checking all adjacent pairs
of the LSF components and swapping any pair not in ascending order. This step is repeated as many
as ten times, if necessary. The minimum separation criterion is then applied by correcting each pair,
, as shown in the following pseudo code.
f i
The LSF components and frequency-related constants are in Hertz; scaling in other implementations
may differ. The minimum separation process is repeated ten times.
is less than 50 Hz,
, for which
and
f i–
min
f i
f i
1+
1+
=
d
dmin = 50
for (i=1; i<10; i++)
d = f[i+1] - f[i]
if (d < dmin)
s1 = s2 = (dmin-d)/2
if (i == 1 and f[i] < dmin) s1 = f[i]/2
else if (i > 1)
tmp = f[i] - f[i-1]
if (tmp < dmin) s1 = 0
else if (tmp < 2*dmin) s1 = (tmp-dmin)/2
endif
if (i == 9 and f[i+1] > 4000-dmin) s2 = (4000-f[i+1])/2
else if (i < 9)
tmp = f[i+2] - f[i+1]
if (tmp < dmin) s2 = 0
else if (tmp < 2*dmin) s2 = (tmp-dmin)/2
endif
-6-
£
Ł
ł
D
�
f[i] = f[i] - s1
f[i+1] = f[i+1] + s2
endif
endfor
The resulting LSF vector,
f
, is then quantized using a multi-stage vector quantizer (MSVQ). The
MSVQ codebook consists of four stages of 128, 64, 64, and 64 levels respectively. The quantized vector,
fˆ
, is the sum of the vectors selected by the search process, with one vector selected from each stage.
The MSVQ search finds the codebook vector which minimizes the square of the weighted Euclidean
distance,
, between the unquantized and quantized LSF vectors:
d2
d2 f
fˆ,(
)
10=
i
1=
(
wi
f i
fˆ i–
)2
,
where
)0.3
P f i(
,
1
)0.3 i,
)0.3 i,
i
8
9=
,
10=
wi
=
0.64P f i(
0.16P f i(
(8)
(9)
is the ith component of the unquantized LSF vector, and
is the inverse prediction filter power
f i
spectrum evaluated at frequency
. The search procedure is an M-best approximation to a full
search, in which the M=8 best code vectors from each stage are saved for use with the next stage; ref-
erence [5] has additional details. The process to ensure ascending order and minimum separation
(described in the first part of this section) is then applied to the quantized LSF vector. The resulting
vector is used in the Fourier magnitude calculation (Section 3.2.17).
P f i(
)
f i
3.2.14 Pitch Quantization. The final pitch value,
, is quantized on a logarithmic scale with a
99-level uniform quantizer ranging from 20 to 160 samples. These pitch values are then mapped to a
7-bit codeword using a look-up table, as shown in Section 4.1.1. The all-zero codeword represents the
unvoiced state, and is sent if
. All 28 codewords with Hamming weight of 1 or 2 are reserved
for error protection. The uniform quantizer details are described in Section 4.1.7.
Vbp1
P3
0.6
G2
G1
for the current frame is within 5 dB of
3.2.15 Gain Quantization. The two gain values are quantized as follows.
is quantized with a 5-
is quantized to 3 bits using the following adaptive
bit uniform quantizer ranging from 10 to 77 dB.
is within 3
algorithm. If
values for the current and previous frames, then the frame is steady-state
dB of the average of the
and a special code (all zero) is sent to indicate that the decoder should set
G2
values for the current and previous frames. Otherwise, the frame represents a transition and
is
values
quantized with a 7-level uniform quantizer ranging from 6 dB below the minimum of the
G2
values. The quantizer
for the current and previous frames to 6 dB above the maximum of those
range is clamped to 10 and 77 dB. The uniform quantizer details are described in Section 4.1.7.
Pseudo code for the adaptive quantization of
to the mean of the
G1
for the previous frame, and
is shown below.
G2
G1
G1
G2
G2
G2
G1
if (|G2 - G2p| < 5.0 and |G1 - 0.5 *(G2 + G2p)| < 3.0)
quantizer_index = 0
else
gain_max = max(G2p, G2) + 6.0
gain_min = min(G2p, G2) - 6.0
if (gain_min < 10.0) gain_min = 10.0
if (gain_max > 77.0) gain_max = 77.0
quantizer_index values 1 to 7 are determined by quantizing G1 with a 7-level,
uniform quantizer ranging from gain_min to gain_max
endif
-7-
£
£
£
�
3.2.16 Bandpass Voicing Quantization. When
(unvoiced), the remaining voicing
strengths,
, the remaining voicing strengths
are quantized to 1 if their value exceeds 0.6, and quantized to 0 otherwise. There is one exception. If
the quantized values of
are 0001, respectively, then
, are quantized to 0. When
is quantized to 0.
0.6
0.6>
,
2 3 4 5
,
2 3 4 5
Vbp1
Vbp1
Vb pi
=
=
,
i
,
i
,
,
,
,
Vb pi
Vbp5
3.2.17 Fourier Magnitude Calculation and Quantization. This analysis measures the Fourier
magnitudes of the first 10 pitch harmonics of the prediction residual generated by the quantized pre-
diction coefficients. It uses a 512-point Fast Fourier Transform (FFT) of a 200 sample window cen-
tered at the end of the frame. First, a set of quantized predictor coefficients is calculated from the
quantized LSF vector (Section 3.2.13). Then the residual window is generated using the quantized
prediction coefficients. Next, a 200 sample Hamming window is applied, the signal is zero-padded to
512 points, and the complex FFT is performed. Finally, the complex FFT output is transformed into
magnitudes, and the harmonics are found with a spectral peak-picking algorithm.
The peak-picker finds the maximum within a width of
ˆ
P3
ˆ⁄
frequency samples centered
512 P3
is the quantized pitch. This width is
around the initial estimate for each pitch harmonic, where
ˆ⁄
truncated to an integer. The initial estimate for the location of the ith harmonic is
. The num-
512i P3
4⁄
. These magnitudes
ber of harmonic magnitudes searched for is limited to the smaller of 10 or
are then normalized to have an RMS value of 1.0. If fewer than 10 harmonics are found, the remain-
ing magnitudes are set to 1.0.
ˆ
P3
The 10 magnitudes are quantized with an 8-bit vector quantizer. The codebook is searched using a
perceptually weighted Euclidean distance, with fixed weights that emphasize low frequencies over
higher frequencies. The weights are given by:
wi
=
117
---------------------------------------------------------------------
0.69
25
75 1
2
1.4
+
+
f i
------------
1000
2
,
i
=
1 2 … 10
,
,
,
,
(10)
=
f i
8000i 60⁄
is the frequency in Hz corresponding to the ith harmonic for a default pitch
where
period of 60 samples. The weights are applied to the squared difference between the input Fourier
magnitudes and the codebook values.
3.2.18 Error Protection and Bit Packing. The table in Section 4.3.2 shows the bit allocation for
the MELP coder. To improve performance in channel errors, the unused coder parameters for the
unvoiced mode are replaced with forward error correction. Three Hamming (7,4) codes and one Ham-
ming (8,4) code are used. The (7,4) code corrects single bit-errors, while the (8,4) code in addition
detects double bit-errors. The (8,4) code is applied to the 4 most significant bits (MSB’s) of the first
MSVQ index, and the 4 parity bits are written over the bandpass voicing. The remaining 3 bits of the
first MSVQ index along with a reserved bit (set to zero), are covered by a (7,4) code with the resulting
3 parity bits written to the MSB’s of the Fourier series VQ index. The 4 MSB’s of the
codeword
are protected with 3 parity bits which are written to the next 3 bits of the Fourier magnitudes.
Finally, the LSB of the second gain index and the 3 bit
codeword are protected with 3 parity bits
written to the 2 LSBs of the Fourier magnitudes and the aperiodic flag.
G1
G2
The bit transmission order is given in Section 4.3.3.
-8-
£
Ł
ł
Ł
ł
�



 2023年江西萍乡中考道德与法治真题及答案.doc
 2012年重庆南川中考生物真题及答案.doc
 2013年江西师范大学地理学综合及文艺理论基础考研真题.doc
 2020年四川甘孜小升初语文真题及答案I卷.doc
 2020年注册岩土工程师专业基础考试真题及答案.doc
 2023-2024学年福建省厦门市九年级上学期数学月考试题及答案.doc
 2021-2022学年辽宁省沈阳市大东区九年级上学期语文期末试题及答案.doc
 2022-2023学年北京东城区初三第一学期物理期末试卷及答案.doc
 2018上半年江西教师资格初中地理学科知识与教学能力真题及答案.doc
 2012年河北国家公务员申论考试真题及答案-省级.doc
 2020-2021学年江苏省扬州市江都区邵樊片九年级上学期数学第一次质量检测试题及答案.doc
 2022下半年黑龙江教师资格证中学综合素质真题及答案.doc