ReportLab PDF Library
User Guide
ReportLab Version 3.5.0
Document generated on 2018/07/18 10:38:23
ReportLab
Wimbletech
35 Wimbledon Hill Road
London SW19 7NB, UK
�
User Guide
Table of contents
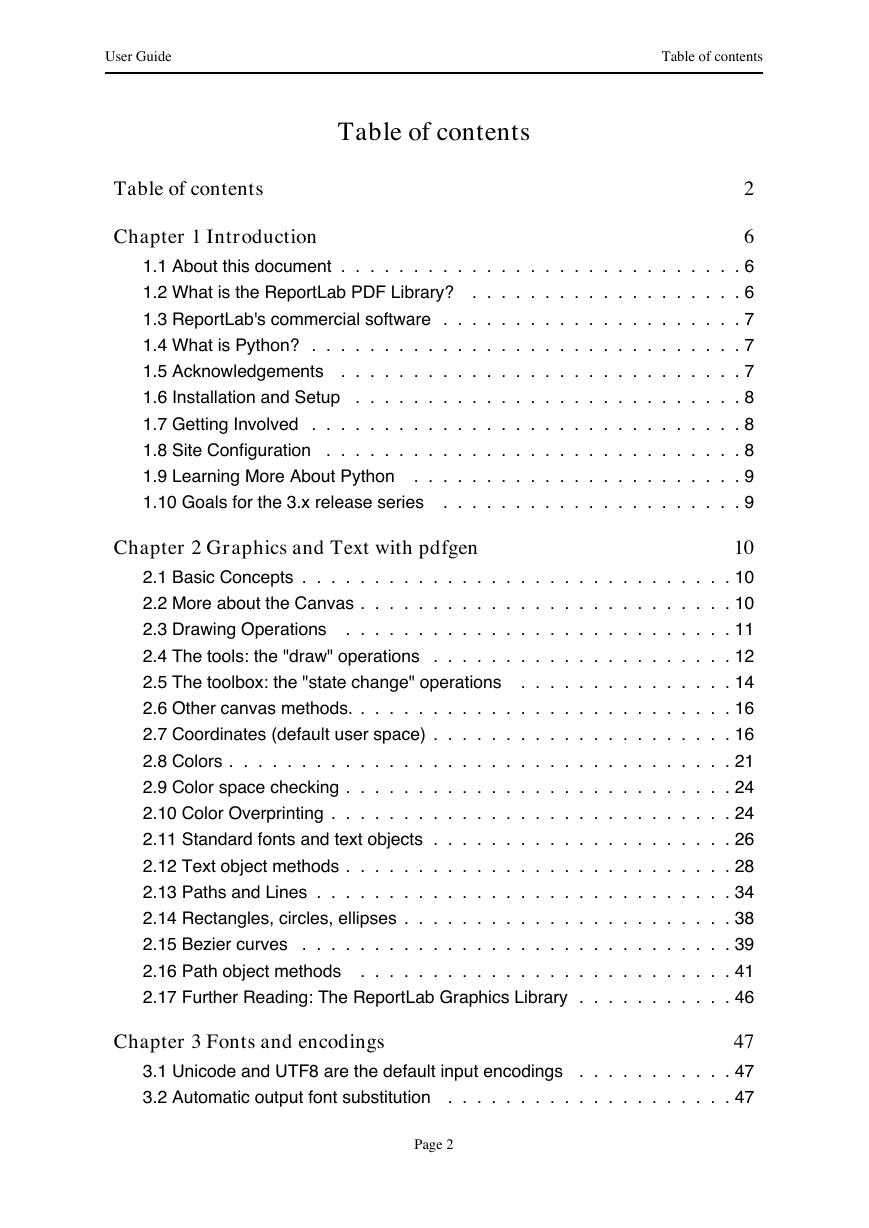
Table of contents
Table of contents
2
Chapter 1 Introduction
1.1 About this document
1.2 What is the ReportLab PDF Library?
1.3 ReportLab's commercial software
1.4 What is Python?
1.5 Acknowledgements
1.6 Installation and Setup
1.7 Getting Involved
1.8 Site Configuration
1.9 Learning More About Python
1.10 Goals for the 3.x release series
6
. . . . . . . . . . . . . . . . . . . . . . . . . . . . 6
. . . . . . . . . . . . . . . . . . . 6
. . . . . . . . . . . . . . . . . . . . . 7
. . . . . . . . . . . . . . . . . . . . . . . . . . . . . . 7
. . . . . . . . . . . . . . . . . . . . . . . . . . . . 7
. . . . . . . . . . . . . . . . . . . . . . . . . . . 8
. . . . . . . . . . . . . . . . . . . . . . . . . . . . . . 8
. . . . . . . . . . . . . . . . . . . . . . . . . . . . . 8
. . . . . . . . . . . . . . . . . . . . . . . 9
. . . . . . . . . . . . . . . . . . . . . 9
Chapter 2 Graphics and Text with pdfgen
10
. . . . . . . . . . . . . . . . . . . . . . . . . . . . . . 10
. . . . . . . . . . . . . . . . . . . . . . . . . . 10
. . . . . . . . . . . . . . . . . . . . . . . . . . . 11
. . . . . . . . . . . . . . . . . . . . . 12
. . . . . . . . . . . . . . . 14
. . . . . . . . . . . . . . . . . . . . . . . . . . 16
. . . . . . . . . . . . . . . . . . . . . 16
. . . . . . . . . . . . . . . . . . . . . . . . . . . . . . . . . . . 21
. . . . . . . . . . . . . . . . . . . . . . . . . . . 24
. . . . . . . . . . . . . . . . . . . . . . . . . . . . 24
. . . . . . . . . . . . . . . . . . . . . 26
. . . . . . . . . . . . . . . . . . . . . . . . . . . 28
. . . . . . . . . . . . . . . . . . . . . . . . . . . . . 34
. . . . . . . . . . . . . . . . . . . . . . . 38
. . . . . . . . . . . . . . . . . . . . . . . . . . . . . . 39
. . . . . . . . . . . . . . . . . . . . . . . . . . 41
. . . . . . . . . . . 46
2.1 Basic Concepts
2.2 More about the Canvas
2.3 Drawing Operations
2.4 The tools: the "draw" operations
2.5 The toolbox: the "state change" operations
2.6 Other canvas methods.
2.7 Coordinates (default user space)
2.8 Colors
2.9 Color space checking
2.10 Color Overprinting
2.11 Standard fonts and text objects
2.12 Text object methods
2.13 Paths and Lines
2.14 Rectangles, circles, ellipses
2.15 Bezier curves
2.16 Path object methods
2.17 Further Reading: The ReportLab Graphics Library
Chapter 3 Fonts and encodings
3.1 Unicode and UTF8 are the default input encodings
3.2 Automatic output font substitution
47
. . . . . . . . . . . 47
. . . . . . . . . . . . . . . . . . . . 47
Page 2
�
User Guide
Table of contents
3.3 Using non-standard Type 1 fonts
3.4 Standard Single-Byte Font Encodings
3.5 TrueType Font Support
3.6 Asian Font Support
3.7 RenderPM tests
. . . . . . . . . . . . . . . . . . . . . 48
. . . . . . . . . . . . . . . . . . 49
. . . . . . . . . . . . . . . . . . . . . . . . . . 51
. . . . . . . . . . . . . . . . . . . . . . . . . . . . 52
. . . . . . . . . . . . . . . . . . . . . . . . . . . . . 53
Chapter 4 Exposing PDF Special Capabilities
54
. . . . . . . . . . . . . . . . . . . . . . . . . . . . . . . . . . . 54
. . . . . . . . . . . . . . . . . . . . . . . . . . 54
. . . . . . . . . . . . . . . . . . . . . . . . . . . . . . . 56
. . . . . . . . . . . . . . . . . . . . . . . . . . 56
. . . . . . . . . . . . . . . . . . . . . . . . . 56
. . . . . . . . . . . . . . . . . . . . . . . . . . . . . . . . 57
. . . . . . . . . . . . . . . . . . . . . . . . . . . . . 59
4.1 Forms
4.2 Links and Destinations
4.3 Outline Trees
4.4 Page Transition Effects
4.5 Internal File Annotations
4.6 Encryption
4.7 Interactive Forms
Chapter 5 PLATYPUS - Page Layout and Typography Using Scripts
5.1 Design Goals
5.2 Getting started
5.3 Flowables
5.4 Guidelines for flowable positioning
5.5 Frames
5.6 Documents and Templates
64
. . . . . . . . . . . . . . . . . . . . . . . . . . . . . . . 64
. . . . . . . . . . . . . . . . . . . . . . . . . . . . . . 65
. . . . . . . . . . . . . . . . . . . . . . . . . . . . . . . . . 66
. . . . . . . . . . . . . . . . . . . . 66
. . . . . . . . . . . . . . . . . . . . . . . . . . . . . . . . . . 67
. . . . . . . . . . . . . . . . . . . . . . . . 68
Chapter 6 Paragraphs
6.1 Using Paragraph Styles
6.2 Paragraph XML Markup Tags
6.3 Intra-paragraph markup
6.4 Bullets and Paragraph Numbering
71
. . . . . . . . . . . . . . . . . . . . . . . . . 72
. . . . . . . . . . . . . . . . . . . . . . 77
. . . . . . . . . . . . . . . . . . . . . . . . . 78
. . . . . . . . . . . . . . . . . . . . 81
Chapter 7 Tables and TableStyles
7.1 Table User Methods
7.2 TableStyle
7.3 TableStyle User Methods
7.4 TableStyle Commands
83
. . . . . . . . . . . . . . . . . . . . . . . . . . . 83
. . . . . . . . . . . . . . . . . . . . . . . . . . . . . . . . 84
. . . . . . . . . . . . . . . . . . . . . . . . . 84
. . . . . . . . . . . . . . . . . . . . . . . . . . 84
Chapter 8 Programming Flowables
8.1 DocAssign(self, var, expr, life='forever')
8.2 DocExec(self, stmt, lifetime='forever')
90
. . . . . . . . . . . . . . . . . 90
. . . . . . . . . . . . . . . . . . 90
Page 3
�
User Guide
Table of contents
8.3 DocPara(self, expr, format=None, style=None, klass=None, escape=True)
8.4 DocAssert(self, cond, format=None)
. . . . . . . . . . . . . . . . . . . 90
. . . . . . . . . . . . . . . . 90
8.5 DocIf(self, cond, thenBlock, elseBlock=[])
8.6 DocWhile(self, cond, whileBlock)
. . . . . . . . . . . . . . . . . . . . . 90
90
Chapter 9 Other Useful Flowables
91
9.1 Preformatted(text, style, bulletText=None, dedent=0,
maxLineLength=None, splitChars=None, newLineChars=None)
9.2 XPreformatted(text, style, bulletText=None, dedent=0, frags=None)
9.3 Image(filename, width=None, height=None)
9.4 Spacer(width, height)
9.5 PageBreak()
9.6 CondPageBreak(height)
9.7 KeepTogether(flowables)
9.8 TableOfContents()
9.9 SimpleIndex()
9.10 ListFlowable(),ListItem()
9.11 BalancedColumns()
. . . . 91
. . 91
. . . . . . . . . . . . . . . 92
. . . . . . . . . . . . . . . . . . . . . . . . . . . 93
. . . . . . . . . . . . . . . . . . . . . . . . . . . . . . . 93
. . . . . . . . . . . . . . . . . . . . . . . . . 93
. . . . . . . . . . . . . . . . . . . . . . . . . 93
. . . . . . . . . . . . . . . . . . . . . . . . . . . . 93
. . . . . . . . . . . . . . . . . . . . . . . . . . . . . . . 94
. . . . . . . . . . . . . . . . . . . . . . . . . 95
. . . . . . . . . . . . . . . . . . . . . . . . . . . 96
Chapter 10 Writing your own Flowable Objects
10.1 A very simple Flowable
10.2 Modifying a Built in Flowable
97
. . . . . . . . . . . . . . . . . . . . . . . . . 97
. . . . . . . . . . . . . . . . . . . . . . 98
Chapter 11 Graphics
100
. . . . . . . . . . . . . . . . . . . . . . . . . . . . . . 100
. . . . . . . . . . . . . . . . . . . . . . . . . . . 100
. . . . . . . . . . . . . . . . . . . . . . . . . . . . . . . . . 103
. . . . . . . . . . . . . . . . . . . . . . . . . . . . . . . . . 105
. . . . . . . . . . . . . . . . . . . . . . . . . . . . . . . . . . 106
. . . . . . . . . . . . . . . . . . . . . . . . . . . . . . . 110
. . . . . . . . . . . . . . . . . . . . . . . . . . . . . . . 113
. . . . . . . . . . . . . . . . . . . . . . . . . . . . . . . 114
. . . . . . . . . . . . . . . . . . . . . . . . . . . . . . . 116
. . . . . . . . . . . . . . . . . . . . . . . . . . . . . . . 120
. . . . . . . . . . . . . . . . . . . . . . . . . . . . . . . . 121
. . . . . . . . . . . . . . . . . . . . . . . . . . . . . . . . 126
11.1 Introduction
11.2 General Concepts
11.3 Charts
11.4 Labels
11.5 Axes
11.6 Bar Charts
11.7 Line Charts
11.8 Line Plots
11.9 Pie Charts
11.10 Legends
11.11 Shapes
11.12 Widgets
Appendix A ReportLab Demos
132
. . . . . . . . . . . . . . . . . . . . . . . . . . . . . . . . . 132
A.1 Odyssey
Page 4
�
User Guide
Table of contents
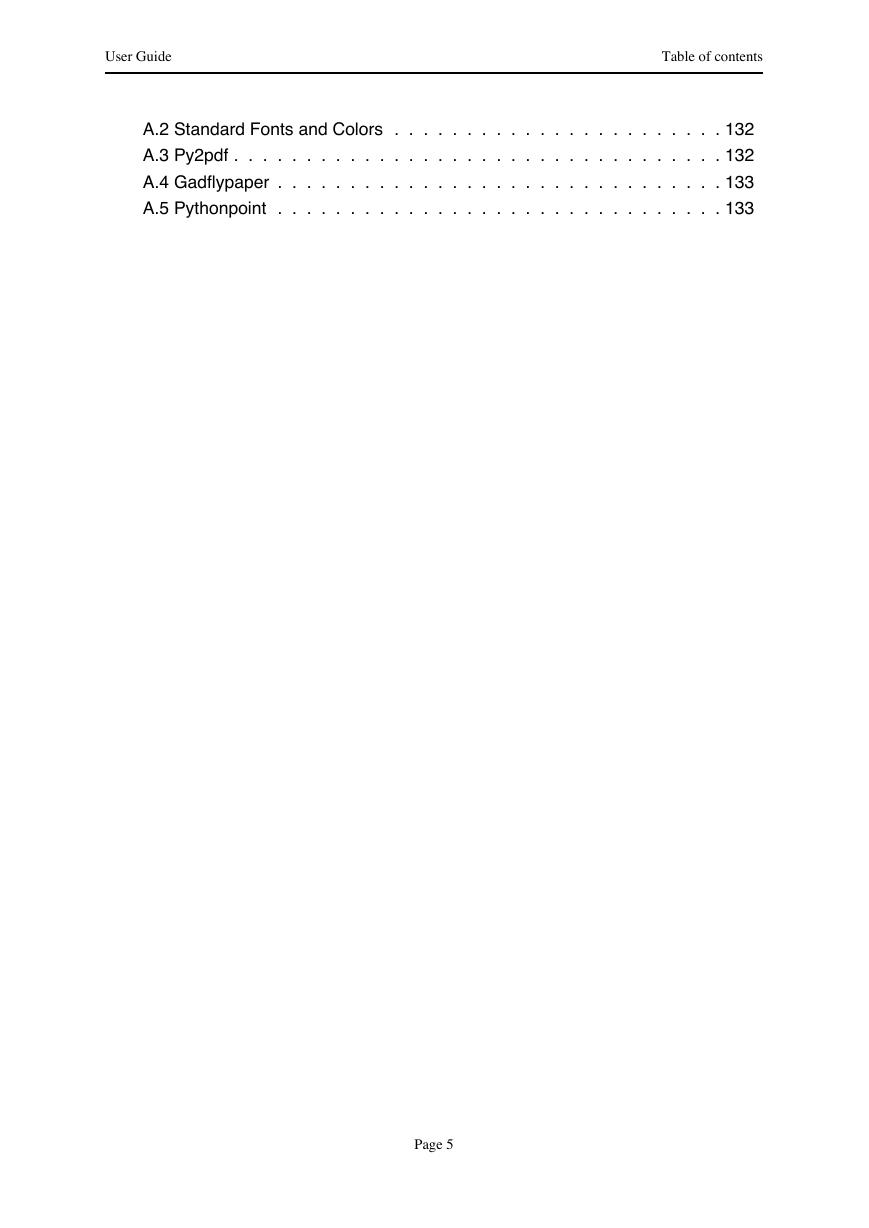
A.2 Standard Fonts and Colors
A.3 Py2pdf
A.4 Gadflypaper
A.5 Pythonpoint
. . . . . . . . . . . . . . . . . . . . . . . 132
. . . . . . . . . . . . . . . . . . . . . . . . . . . . . . . . . . 132
. . . . . . . . . . . . . . . . . . . . . . . . . . . . . . . 133
. . . . . . . . . . . . . . . . . . . . . . . . . . . . . . . 133
Page 5
�
User Guide
Chapter 1 Introduction
Chapter 1 Introduction
1.1 About this document
This document is an introduction to the ReportLab PDF library. Some previous programming experience is
presumed and familiarity with the Python Programming language is recommended. If you are new to Python,
we tell you in the next section where to go for orientation.
This manual does not cover 100% of the features, but should explain all the main concepts and help you get
started, and point you at other learning resources. After working your way through this, you should be ready
to begin writing programs to produce sophisticated reports.
In this chapter, we will cover the groundwork:
•
•
•
What is ReportLab all about, and why should I use it?
What is Python?
How do I get everything set up and running?
We need your help to make sure this manual is complete and helpful. Please send any feedback to our user
mailing list, which is signposted from www.reportlab.com.
1.2 What is the ReportLab PDF Library?
This is a software library that lets you directly create documents in Adobe's Portable Document Format (PDF)
using the Python programming language. It also creates charts and data graphics in various bitmap and vector
formats as well as PDF.
PDF is the global standard for electronic documents. It supports high-quality printing yet is totally portable
across platforms, thanks to the freely available Acrobat Reader. Any application which previously generated
hard copy reports or driving a printer can benefit from making PDF documents instead; these can be archived,
emailed, placed on the web, or printed out the old-fashioned way. However, the PDF file format is a complex
indexed binary format which is impossible to type directly. The PDF format specification is more than 600
pages long and PDF files must provide precise byte offsets -- a single extra character placed anywhere in a
valid PDF document can render it invalid. This makes it harder to generate than HTML.
Most of the world's PDF documents have been produced by Adobe's Acrobat tools, or rivals such as JAWS
PDF Creator, which act as 'print drivers'. Anyone wanting to automate PDF production would typically use a
product like Quark, Word or Framemaker running in a loop with macros or plugins, connected to Acrobat.
Pipelines of several languages and products can be slow and somewhat unwieldy.
The ReportLab library directly creates PDF based on your graphics commands. There are no intervening
steps. Your applications can generate reports extremely fast - sometimes orders of magnitude faster than
traditional report-writing tools. This approach is shared by several other libraries - PDFlib for C, iText for
Java, iTextSharp for .NET and others. However, The ReportLab library differs in that it can work at much
higher levels, with a full featured engine for laying out documents complete with tables and charts.
In addition, because you are writing a program in a powerful general purpose language, there are no
restrictions at all on where you get your data from, how you transform it, and the kind of output you can
create. And you can reuse code across whole families of reports.
The ReportLab library is expected to be useful in at least the following contexts:
•
•
•
•
•
Dynamic PDF generation on the web
High-volume corporate reporting and database publishing
An embeddable print engine for other applications, including a 'report language' so that users
can customize their own reports. This is particularly relevant to cross-platform apps which
cannot rely on a consistent printing or previewing API on each operating system.
A 'build system' for complex documents with charts, tables and text such as management
accounts, statistical reports and scientific papers
Going from XML to PDF in one step
Page 6
�
User Guide
Chapter 1 Introduction
1.3 ReportLab's commercial software
The ReportLab library forms the foundation of our commercial solution for PDF generation, Report Markup
Language (RML). This is available for evaluation on our web site with full documentation. We believe that
RML is the fastest and easiest way to develop rich PDF workflows. You work in a markup language at a
similar level to HTML, using your favorite templating system to populate an RML document; then call our
rml2pdf API function to generate a PDF. It's what ReportLab staff use to build all of the solutions you can see
on reportlab.com. Key differences:
Fully documented with two manuals, a formal specification (the DTD) and extensive
self-documenting tests. (By contrast, we try to make sure the open source documentation isn't
wrong, but we don't always keep up with the code)
Work in high-level markup rather than constructing graphs of Python objects
Requires no Python expertise - your colleagues may thank you after you've left!'
Support for vector graphics and inclusion of other PDF documents
Many more useful features expressed with a single tag, which would need a lot of coding in the
open source package
Commercial support is included
•
•
•
•
•
•
We ask open source developers to consider trying out RML where it is appropriate. You can register on our
site and try out a copy before buying. The costs are reasonable and linked to the volume of the project, and
the revenue helps us spend more time developing this software.
1.4 What is Python?
Python is an interpreted, interactive, object-oriented programming language. It is often compared to Tcl, Perl,
Scheme or Java.
Python combines remarkable power with very clear syntax. It has modules, classes, exceptions, very high
level dynamic data types, and dynamic typing. There are interfaces to many system calls and libraries, as well
as to various windowing systems (X11, Motif, Tk, Mac, MFC). New built-in modules are easily written in C
or C++. Python is also usable as an extension language for applications that need a programmable interface.
Python is as old as Java and has been growing steadily in popularity for years; since our library first came out
it has entered the mainstream. Many ReportLab library users are already Python devotees, but if you are not,
we feel that the language is an excellent choice for document-generation apps because of its expressiveness
and ability to get data from anywhere.
Python is copyrighted but freely usable and distributable, even for commercial use.
1.5 Acknowledgements
Many people have contributed to ReportLab. We would like to thank in particular (in alphabetical order):
Albertas Agejevas, Alex Buck, Andre Reitz, Andrew Cutler, Andrew Mercer, Ben Echols, Benjamin Dumke,
Benn B, Chad Miller, Chris Buergi, Chris Lee, Christian Jacobs, Dinu Gherman, Edward Greve, Eric
Johnson, Felix Labrecque, Fubu @ bitbucket, Gary Poster, Germán M. Bravo, Guillaume Francois, Hans
Brand, Henning Vonbargen, Hosam Aly, Ian Stevens, James Martin-Collar, Jeff Bauer, Jerome Alet, Jerry
Casiano, Jorge Godoy, Keven D Smith, Kyle MacFarlane, Magnus Lie Hetland, Marcel Tromp, Marius
Gedminas, Mark de Wit, Matthew Duggan, Matthias Kirst, Matthias Klose, Max M, Michael Egorov,
Michael Spector, Mike Folwell, Mirko Dziadzka, Moshe Wagner, Nate Silva, Paul McNett, Peter Johnson,
PJACock, Publio da Costa Melo, Randolph Bentson, Robert Alsina, Robert Hölzl, Robert Kern, Ron Peleg,
Ruby Yocum, Simon King, Stephan Richter, Steve Halasz, Stoneleaf @ bitbucket, T Blatter, Tim Roberts,
Tomasz Swiderski, Ty Sarna, Volker Haas, Yoann Roman, and many more.
Special thanks go to Just van Rossum for his valuable assistance with font technicalities.
Moshe Wagner and Hosam Aly deserve a huge thanks for contributing to the RTL patch, which is not yet on
the trunk.
Marius Gedminas deserves a big hand for contributing the work on TrueType fonts and we are glad to include
these in the toolkit. Finally we thank Michal Kosmulski for the DarkGarden font for and Bitstream Inc. for
Page 7
�
User Guide
the Vera fonts.
Chapter 1 Introduction
1.6 Installation and Setup
To avoid duplication, the installation instructions are kept in the README file in our distribution, which can
be viewed online at http://bitbucket.org/rptlab/reportlab/
This release (3.0) of ReportLab requires Python versions 2.7, 3.3 or higher. If you need to use Python 2.5 or
2.6, please use the latest ReportLab 2.x package.
1.7 Getting Involved
ReportLab is an Open Source project. Although we are a commercial company we provide the core PDF
generation sources freely, even for commercial purposes, and we make no income directly from these
modules. We also welcome help from the community as much as any other Open Source project. There are
many ways in which you can help:
General feedback on the core API. Does it work for you? Are there any rough edges? Does
anything feel clunky and awkward?
New objects to put in reports, or useful utilities for the library. We have an open standard for
report objects, so if you have written a nice chart or table class, why not contribute it?
Snippets and Case Studies: If you have produced some nice output, register online on
http://www.reportlab.com and submit a snippet of your output (with or without
scripts). If ReportLab solved a problem for you at work, write a little 'case study' and submit it.
And if your web site uses our tools to make reports, let us link to it. We will be happy to display
your work (and credit it with your name and company) on our site!
Working on the core code: we have a long list of things to refine or to implement. If you are
missing some features or just want to help out, let us know!
The first step for anyone wanting to learn more or get involved is to join the mailing list. To Subscribe visit
http://two.pairlist.net/mailman/listinfo/reportlab-users. From there you can also
browse through the group's archives and contributions. The mailing list is the place to report bugs and get
support.
The code now lives on BitBucket (http://bitbucket.org/rptlab/reportlab/) in a Mercurial
repository, along with an issue tracker and wiki. Everyone should feel free to contribute, but if you are
working actively on some improvements or want to draw attention to an issue, please use the mailing list to
let us know.
1.8 Site Configuration
There are a number of options which most likely need to be configured globally for a site. The python script
module reportlab/rl_config.py may be edited to change the values of several important sitewide
properties.
•
•
•
•
•
•
•
•
•
•
•
•
•
verbose: set to integer values to control diagnostic output.
shapeChecking: set this to zero to turn off a lot of error checking in the graphics modules
defaultEncoding: set this to WinAnsiEncoding or MacRomanEncoding.
defaultPageSize: set this to one of the values defined in reportlab/lib/pagesizes.py; as delivered
it is set to pagesizes.A4; other values are pagesizes.letter etc.
defaultImageCaching: set to zero to inhibit the creation of .a85 files on your hard-drive. The
default is to create these preprocessed PDF compatible image files for faster loading
T1SearchPath: this is a python list of strings representing directories that may be queried for
information on Type 1 fonts
TTFSearchPath: this is a python list of strings representing directories that may be queried for
information on TrueType fonts
CMapSearchPath: this is a python list of strings representing directories that may be queried for
information on font code maps.
showBoundary: set to non-zero to get boundary lines drawn.
Page 8
�


 2023年江西萍乡中考道德与法治真题及答案.doc
 2012年重庆南川中考生物真题及答案.doc
 2013年江西师范大学地理学综合及文艺理论基础考研真题.doc
 2020年四川甘孜小升初语文真题及答案I卷.doc
 2020年注册岩土工程师专业基础考试真题及答案.doc
 2023-2024学年福建省厦门市九年级上学期数学月考试题及答案.doc
 2021-2022学年辽宁省沈阳市大东区九年级上学期语文期末试题及答案.doc
 2022-2023学年北京东城区初三第一学期物理期末试卷及答案.doc
 2018上半年江西教师资格初中地理学科知识与教学能力真题及答案.doc
 2012年河北国家公务员申论考试真题及答案-省级.doc
 2020-2021学年江苏省扬州市江都区邵樊片九年级上学期数学第一次质量检测试题及答案.doc
 2022下半年黑龙江教师资格证中学综合素质真题及答案.doc