12
Force-Directed Drawing Algorithms
12.1 Introduction . . . . . . . . . . . . . . . . . . . . . . . . . . . . . . . . . . . . . . . . . . . . . . . . .
12.2 Spring Systems and Electrical Forces . . . . . . . . . . . . . . . . . . .
12.3 The Barycentric Method . . . . . . . . . . . . . . . . . . . . . . . . . . . . . . . . . .
12.4 Graph Theoretic Distances Approach . . . . . . . . . . . . . . . . . . .
12.5 Further Spring Refinements . . . . . . . . . . . . . . . . . . . . . . . . . . . . . . .
12.6 Large Graphs . . . . . . . . . . . . . . . . . . . . . . . . . . . . . . . . . . . . . . . . . . . . . . .
12.7 Stress Majorization . . . . . . . . . . . . . . . . . . . . . . . . . . . . . . . . . . . . . . . .
12.8 Non-Euclidean Approaches . . . . . . . . . . . . . . . . . . . . . . . . . . . . . . .
12.9 Lombardi Spring Embedders . . . . . . . . . . . . . . . . . . . . . . . . . . . . .
12.10 Dynamic Graph Drawing . . . . . . . . . . . . . . . . . . . . . . . . . . . . . . . . .
12.11 Conclusion . . . . . . . . . . . . . . . . . . . . . . . . . . . . . . . . . . . . . . . . . . . . . . . . . .
References . . . . . . . . . . . . . . . . . . . . . . . . . . . . . . . . . . . . . . . . . . . . . . . . . . . . . . . . . .
383
385
386
388
389
391
396
397
400
401
403
404
Stephen G. Kobourov
University of Arizona
12.1
Introduction
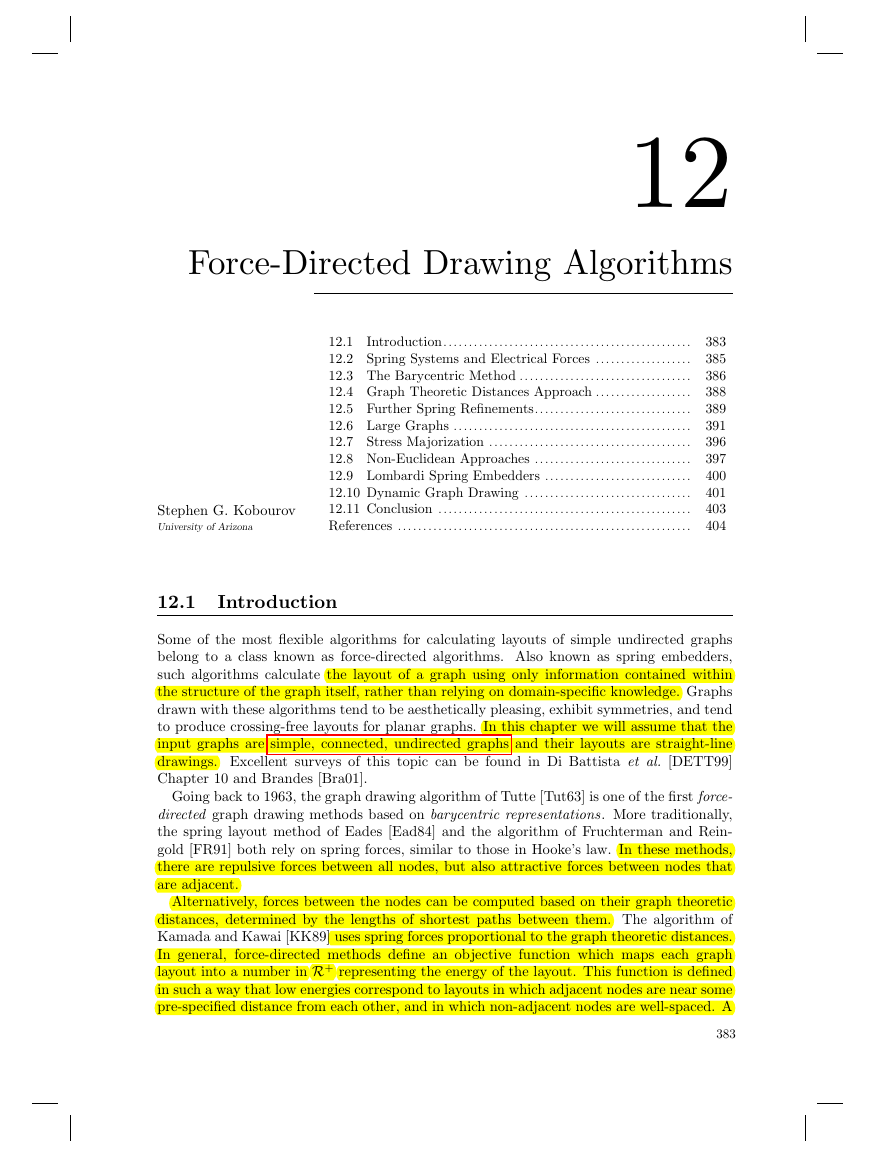
Some of the most flexible algorithms for calculating layouts of simple undirected graphs
belong to a class known as force-directed algorithms. Also known as spring embedders,
such algorithms calculate the layout of a graph using only information contained within
the structure of the graph itself, rather than relying on domain-specific knowledge. Graphs
drawn with these algorithms tend to be aesthetically pleasing, exhibit symmetries, and tend
to produce crossing-free layouts for planar graphs. In this chapter we will assume that the
input graphs are simple, connected, undirected graphs and their layouts are straight-line
drawings. Excellent surveys of this topic can be found in Di Battista et al. [DETT99]
Chapter 10 and Brandes [Bra01].
Going back to 1963, the graph drawing algorithm of Tutte [Tut63] is one of the first force-
directed graph drawing methods based on barycentric representations. More traditionally,
the spring layout method of Eades [Ead84] and the algorithm of Fruchterman and Rein-
gold [FR91] both rely on spring forces, similar to those in Hooke’s law. In these methods,
there are repulsive forces between all nodes, but also attractive forces between nodes that
are adjacent.
Alternatively, forces between the nodes can be computed based on their graph theoretic
distances, determined by the lengths of shortest paths between them. The algorithm of
Kamada and Kawai [KK89] uses spring forces proportional to the graph theoretic distances.
In general, force-directed methods define an objective function which maps each graph
layout into a number in R+ representing the energy of the layout. This function is defined
in such a way that low energies correspond to layouts in which adjacent nodes are near some
pre-specified distance from each other, and in which non-adjacent nodes are well-spaced. A
383
�
384
CHAPTER 12. FORCE-DIRECTED DRAWING ALGORITHMS
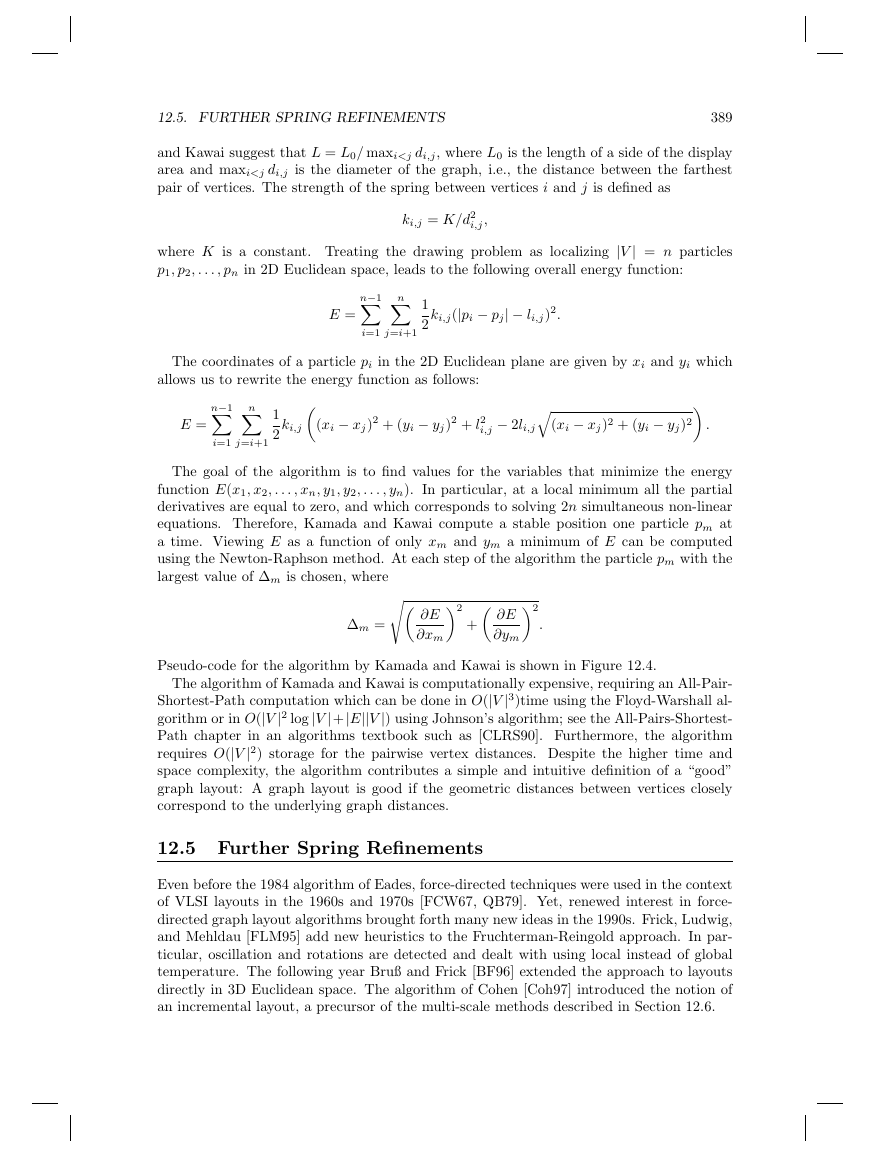
Figure 12.1 Examples of drawings obtained with force-directed algorithms. First row:
small graphs: dodecahedron (20 vertices), C60 bucky ball (60 vertices), 3D cube mesh (216
vertices). Second row: Cubes in 4D, 5D and 6D [GK02].
layout for a graph is then calculated by finding a (often local) minimum of this objective
function; see Figure 12.1.
The utility of the basic force-directed approach is limited to small graphs and results are
poor for graphs with more than a few hundred vertices. There are multiple reasons why
traditional force-directed algorithms do not perform well for large graphs. One of the main
obstacles to the scalability of these approaches is the fact that the physical model typically
has many local minima. Even with the help of sophisticated mechanisms for avoiding local
minima the basic force-directed algorithms are not able to consistently produce good layouts
for large graphs. Barycentric methods also do not perform well for large graphs mainly due
to resolution problems: for large graphs the minimum vertex separation tends to be very
small, leading to unreadable drawings.
The late 1990s saw the emergence of several techniques extending the functionality of
force-directed methods to graphs with tens of thousands and even hundreds of thousands of
vertices. One common thread in these approaches is the multi-level layout technique, where
the graph is represented by a series of progressively simpler structures and laid out in reverse
order: from the simplest to the most complex. These structures can be coarser graphs (as in
the approach of Hadany and Harel [HH01], Harel and Koren [HK02], and Walshaw [Wal03],
or vertex filtrations as in the approach of Gajer, Goodrich, and Kobourov [GGK04].
The classical force-directed algorithms are restricted to calculating a graph layout in
Euclidean geometry, typically R2, R3, and, more recently, Rn for larger values of n. There
are, however, cases where Euclidean geometry may not be the best option: Certain graphs
may be known to have a structure which would be best realized in a different geometry,
�
12.2. SPRING SYSTEMS AND ELECTRICAL FORCES
385
such as on the surface of a sphere or on a torus.
In particular, 3D mesh data can be
parameterized on the sphere for texture mapping or graphs of genus one can be embedded on
a torus without crossings. Furthermore, it has also been noted that certain non- Euclidean
geometries, specifically hyperbolic geometry, have properties that are particularly well suited
to the layout and visualization of large classes of graphs [LRP95, Mun97]. With this in mind,
Kobourov and Wampler describe extensions of the force-directed algorithms to Riemannian
spaces [KW05].
12.2 Spring Systems and Electrical Forces
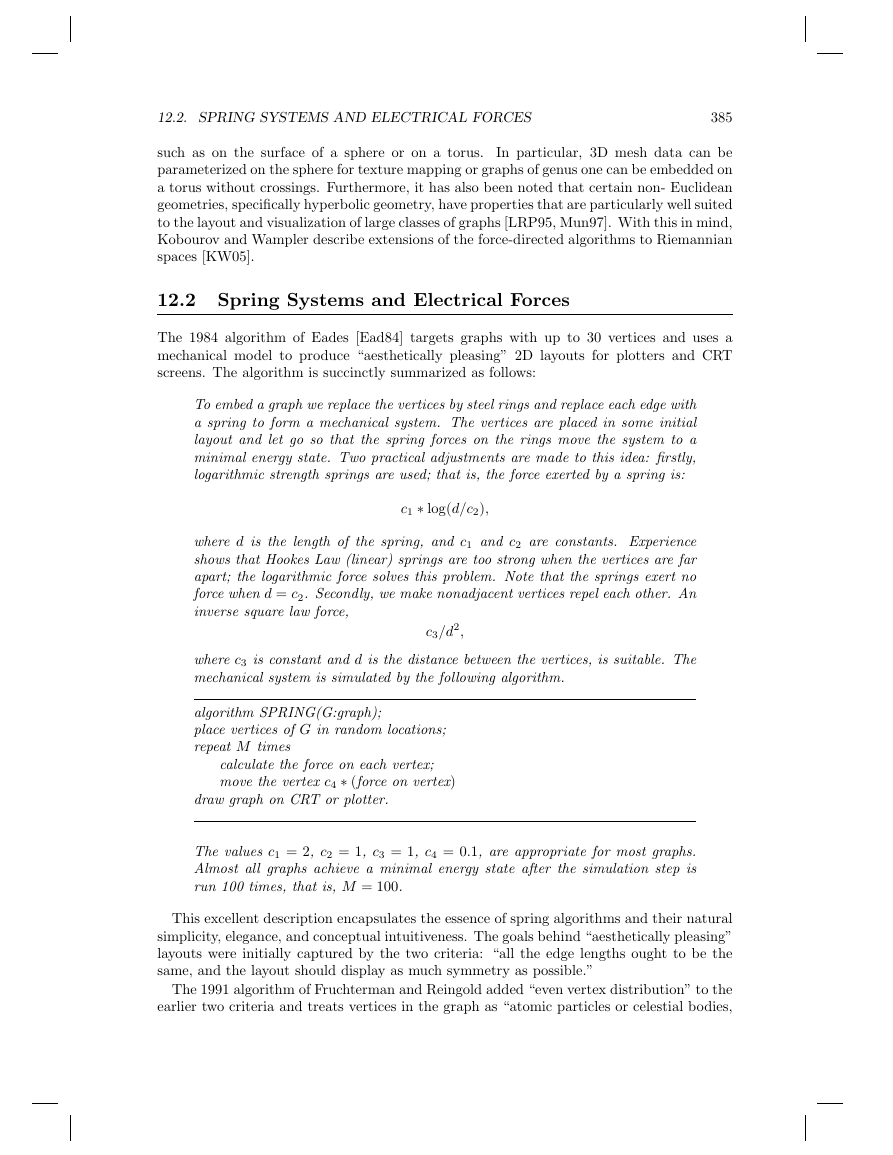
The 1984 algorithm of Eades [Ead84] targets graphs with up to 30 vertices and uses a
mechanical model to produce “aesthetically pleasing” 2D layouts for plotters and CRT
screens. The algorithm is succinctly summarized as follows:
To embed a graph we replace the vertices by steel rings and replace each edge with
a spring to form a mechanical system. The vertices are placed in some initial
layout and let go so that the spring forces on the rings move the system to a
minimal energy state. Two practical adjustments are made to this idea: firstly,
logarithmic strength springs are used; that is, the force exerted by a spring is:
c1 ∗ log(d/c2),
where d is the length of the spring, and c1 and c2 are constants. Experience
shows that Hookes Law (linear) springs are too strong when the vertices are far
apart; the logarithmic force solves this problem. Note that the springs exert no
force when d = c2. Secondly, we make nonadjacent vertices repel each other. An
inverse square law force,
c3/d2,
where c3 is constant and d is the distance between the vertices, is suitable. The
mechanical system is simulated by the following algorithm.
algorithm SPRING(G:graph);
place vertices of G in random locations;
repeat M times
calculate the force on each vertex;
move the vertex c4 ∗ (force on vertex)
draw graph on CRT or plotter.
The values c1 = 2, c2 = 1, c3 = 1, c4 = 0.1, are appropriate for most graphs.
Almost all graphs achieve a minimal energy state after the simulation step is
run 100 times, that is, M = 100.
This excellent description encapsulates the essence of spring algorithms and their natural
simplicity, elegance, and conceptual intuitiveness. The goals behind “aesthetically pleasing”
layouts were initially captured by the two criteria: “all the edge lengths ought to be the
same, and the layout should display as much symmetry as possible.”
The 1991 algorithm of Fruchterman and Reingold added “even vertex distribution” to the
earlier two criteria and treats vertices in the graph as “atomic particles or celestial bodies,
�
k = Cr
area
number of vertices
.
386
CHAPTER 12. FORCE-DIRECTED DRAWING ALGORITHMS
exerting attractive and repulsive forces from one another.” The attractive and repulsive
forces are redefined to
fa(d) = d2/k,
fr(d) = −k2/d,
in terms of the distance d between two vertices and the optimal distance between vertices
k defined as
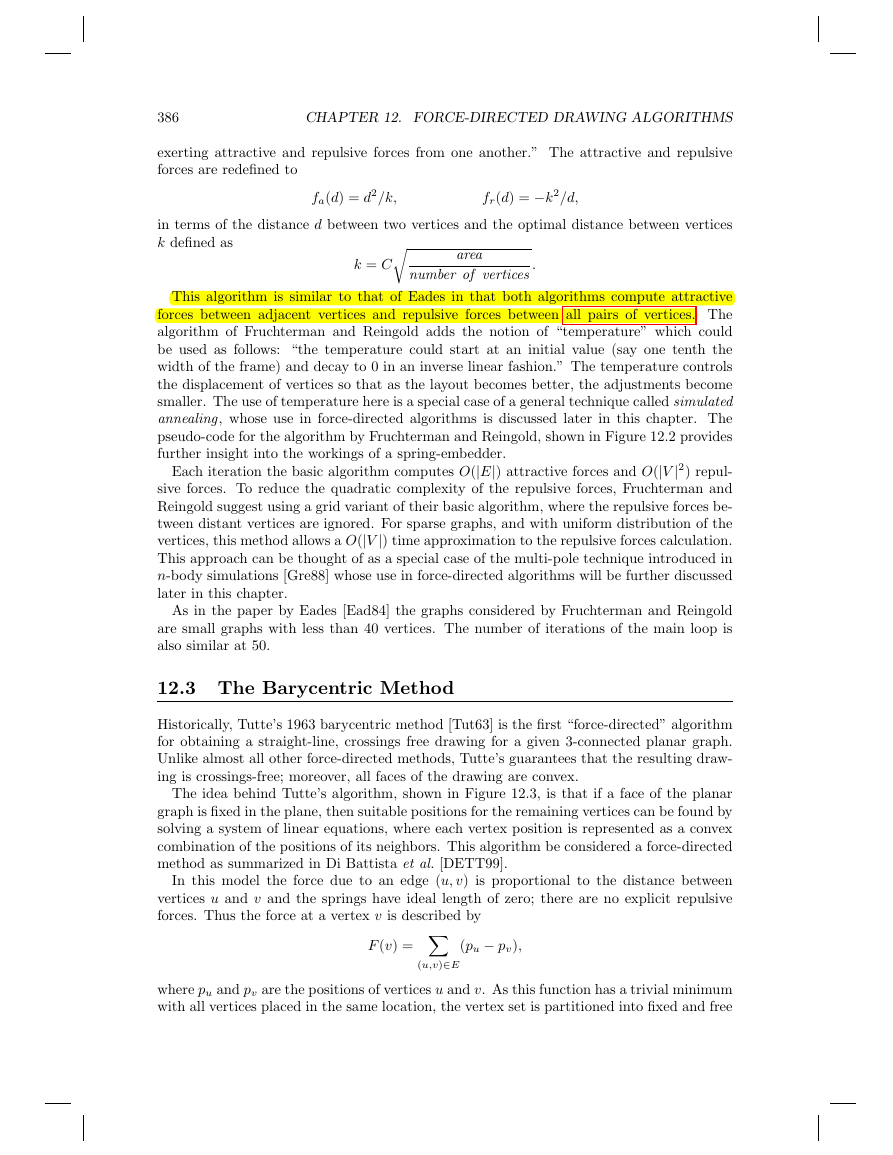
This algorithm is similar to that of Eades in that both algorithms compute attractive
forces between adjacent vertices and repulsive forces between all pairs of vertices. The
algorithm of Fruchterman and Reingold adds the notion of “temperature” which could
be used as follows: “the temperature could start at an initial value (say one tenth the
width of the frame) and decay to 0 in an inverse linear fashion.” The temperature controls
the displacement of vertices so that as the layout becomes better, the adjustments become
smaller. The use of temperature here is a special case of a general technique called simulated
annealing, whose use in force-directed algorithms is discussed later in this chapter. The
pseudo-code for the algorithm by Fruchterman and Reingold, shown in Figure 12.2 provides
further insight into the workings of a spring-embedder.
Each iteration the basic algorithm computes O(|E|) attractive forces and O(|V |2) repul-
sive forces. To reduce the quadratic complexity of the repulsive forces, Fruchterman and
Reingold suggest using a grid variant of their basic algorithm, where the repulsive forces be-
tween distant vertices are ignored. For sparse graphs, and with uniform distribution of the
vertices, this method allows a O(|V |) time approximation to the repulsive forces calculation.
This approach can be thought of as a special case of the multi-pole technique introduced in
n-body simulations [Gre88] whose use in force-directed algorithms will be further discussed
later in this chapter.
As in the paper by Eades [Ead84] the graphs considered by Fruchterman and Reingold
are small graphs with less than 40 vertices. The number of iterations of the main loop is
also similar at 50.
12.3 The Barycentric Method
Historically, Tutte’s 1963 barycentric method [Tut63] is the first “force-directed” algorithm
for obtaining a straight-line, crossings free drawing for a given 3-connected planar graph.
Unlike almost all other force-directed methods, Tutte’s guarantees that the resulting draw-
ing is crossings-free; moreover, all faces of the drawing are convex.
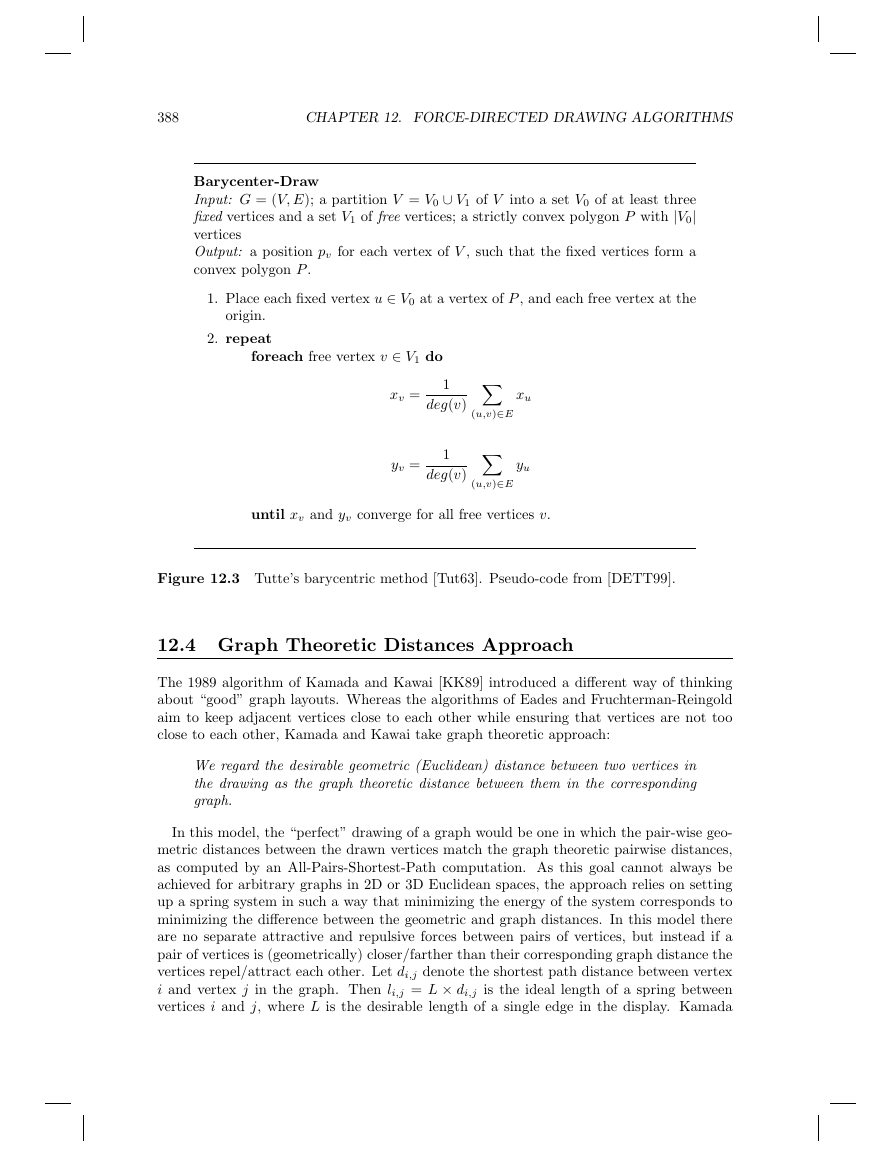
The idea behind Tutte’s algorithm, shown in Figure 12.3, is that if a face of the planar
graph is fixed in the plane, then suitable positions for the remaining vertices can be found by
solving a system of linear equations, where each vertex position is represented as a convex
combination of the positions of its neighbors. This algorithm be considered a force-directed
method as summarized in Di Battista et al. [DETT99].
In this model the force due to an edge (u, v) is proportional to the distance between
vertices u and v and the springs have ideal length of zero; there are no explicit repulsive
forces. Thus the force at a vertex v is described by
F (v) = X(u,v)∈E
(pu − pv),
where pu and pv are the positions of vertices u and v. As this function has a trivial minimum
with all vertices placed in the same location, the vertex set is partitioned into fixed and free
�
12.3. THE BARYCENTRIC METHOD
387
area:= W ∗ L; {W and L are the width and length of the frame}
G := (V, E); {the vertices are assigned random initial positions}
k :=parea/|V |;
function fa(x) := begin return x2/k end;
function fr(x) := begin return k2/x end;
for i := 1 to iterations do begin
{calculate repulsive forces}
for v in V do begin
{each vertex has two vectors: .pos and .disp
v.disp := 0;
for u in V do
if (u 6= v) then begin
{δ is the difference vector between the positions of the two vertices}
δ := v.pos − u.pos;
v.disp := v.disp + (δ/|δ|) ∗ fr(|δ|)
end
end
{calculate attractive forces}
for e in E do begin
{each edges is an ordered pair of vertices .vand.u}
δ := e.v.pos − e.u.pos;
e.v.disp := e.v.disp − (δ/|δ|) ∗ fa(|δ|);
e.u.disp := e.u.disp + (δ/|δ|) ∗ fa(|δ|)
end
{limit max displacement to temperature t and prevent from displacement
outside frame}
for v in V do begin
v.pos := v.pos + (v.disp/|v.disp|) ∗ min(v.disp, t);
v.pos.x := min(W/2, max(−W/2, v.pos.x));
v.pos.y := min(L/2, max(−L/2, v.pos.y))
end
{reduce the temperature as the layout approaches a better configuration}
t := cool(t)
end
Figure 12.2 Pseudo-code for the algorithm by Fruchterman and Reingold [FR91].
vertices. Setting the partial derivatives of the force function to zero results in independent
systems of linear equations for the x-coordinate and for the y-coordinate.
The equations in the for-loop are linear and the number of equations is equal to the
number of the unknowns, which in turn is equal to the number of free vertices. Solving these
equations results in placing each free vertex at the barycenter of its neighbors. The system
of equations can be solved using the Newton-Raphson method. Moreover, the resulting
solution is unique.
One significant drawback of this approach is the resulting drawing often has poor vertex
resolution. In fact, for every n > 1, there exists a graph, such that the barycenter method
computes a drawing with exponential area [EG95].
�
388
CHAPTER 12. FORCE-DIRECTED DRAWING ALGORITHMS
Barycenter-Draw
Input: G = (V, E); a partition V = V0 ∪ V1 of V into a set V0 of at least three
fixed vertices and a set V1 of free vertices; a strictly convex polygon P with |V0|
vertices
Output: a position pv for each vertex of V , such that the fixed vertices form a
convex polygon P .
1. Place each fixed vertex u ∈ V0 at a vertex of P , and each free vertex at the
origin.
2. repeat
foreach free vertex v ∈ V1 do
xv =
1
deg(v) X(u,v)∈E
xu
yv =
1
deg(v) X(u,v)∈E
yu
until xv and yv converge for all free vertices v.
Figure 12.3 Tutte’s barycentric method [Tut63]. Pseudo-code from [DETT99].
12.4 Graph Theoretic Distances Approach
The 1989 algorithm of Kamada and Kawai [KK89] introduced a different way of thinking
about “good” graph layouts. Whereas the algorithms of Eades and Fruchterman-Reingold
aim to keep adjacent vertices close to each other while ensuring that vertices are not too
close to each other, Kamada and Kawai take graph theoretic approach:
We regard the desirable geometric (Euclidean) distance between two vertices in
the drawing as the graph theoretic distance between them in the corresponding
graph.
In this model, the “perfect” drawing of a graph would be one in which the pair-wise geo-
metric distances between the drawn vertices match the graph theoretic pairwise distances,
as computed by an All-Pairs-Shortest-Path computation. As this goal cannot always be
achieved for arbitrary graphs in 2D or 3D Euclidean spaces, the approach relies on setting
up a spring system in such a way that minimizing the energy of the system corresponds to
minimizing the difference between the geometric and graph distances. In this model there
are no separate attractive and repulsive forces between pairs of vertices, but instead if a
pair of vertices is (geometrically) closer/farther than their corresponding graph distance the
vertices repel/attract each other. Let di,j denote the shortest path distance between vertex
i and vertex j in the graph. Then li,j = L × di,j is the ideal length of a spring between
vertices i and j, where L is the desirable length of a single edge in the display. Kamada
�
12.5. FURTHER SPRING REFINEMENTS
389
and Kawai suggest that L = L0/ maxi
390
CHAPTER 12. FORCE-DIRECTED DRAWING ALGORITHMS
compute di,j for 1 ≤ i 6= j ≤ n;
compute li,j for 1 ≤ i 6= j ≤ n;
compute ki,j for 1 ≤ i 6= j ≤ n;
initialize p1, p2, . . . , pn;
while (maxi∆i > ǫ)
let pm be the particle satisfying ∆m = maxi∆i;
while (∆m > ǫ)
compute δx and δy by solving the following system of equations:
∂2E
∂x2
m
(x(t)
m , y(t)
m )δx +
∂2E
∂xm∂ym
(x(t)
m , y(t)
m )δy = −
∂E
∂xm
(x(t)
m , y(t)
m );
∂2E
∂ym∂xm
(x(t)
m , y(t)
m )δx +
∂2E
∂y2
m
(x(t)
m , y(t)
m )δy = −
∂E
∂ym
(x(t)
m , y(t)
m )
xm := xm + δx;
ym := ym + δy;
Figure 12.4 Pseudo-code for the algorithm by Kamada and Kawai [KK89].
The 1997 algorithm of Davidson and Harel [DH96] adds additional constraints to the
traditional force-directed approach in explicitly aiming to minimize the number of edge-
crossings and keeping vertices from getting too close to non-adjacent edges. The algo-
rithm uses the simulated annealing technique developed for large combinatorial optimiza-
tion [KGV83]. Simulated annealing is motivated by the physical process of cooling molten
materials. When molten steel is cooled too quickly it cracks and forms bubbles making it
brittle. For better results, the steel must be cooled slowly and evenly and this process is
known as annealing in metallurgy. With regard to force-directed algorithms, this process is
simulated to find local minima of the energy function. Cruz and Twarog [CT96] extended
the method by Davidson and Harel to three-dimensional drawings.
Genetic algorithms for force-directed placement have also been considered. Genetic al-
gorithms are a commonly used search technique for finding approximate solutions to opti-
mization and search problems. The technique is inspired by evolutionary biology in general
and by inheritance, mutation, natural selection, and recombination (or crossover), in par-
ticular; see the survey by Vose [Vos99].
In the context of force-directed techniques for
graph drawing, the genetic algorithms approach was introduced in 1991 by Kosak, Marks
and Shieber [KMS91]. Other notable approaches in the direction include that of Branke,
Bucher, and Schmeck [BBS97].
In the context of graph clustering, the LinLog model introduces an alternative energy
model [Noa07]. Traditional energy models enforce small and uniform edge lengths, which
often prevent the separation of nodes in different clusters. As a side effect, they tend
to group nodes with large degree in the center of the layout, where their distance to the
remaining nodes is relatively small. The node-repulsion LinLog and edge- repulsion LinLog
models group nodes according to two well-known clustering criteria: the density of the
cut [LR88] and the normalized cut [SM00].
�




 2023年江西萍乡中考道德与法治真题及答案.doc
 2012年重庆南川中考生物真题及答案.doc
 2013年江西师范大学地理学综合及文艺理论基础考研真题.doc
 2020年四川甘孜小升初语文真题及答案I卷.doc
 2020年注册岩土工程师专业基础考试真题及答案.doc
 2023-2024学年福建省厦门市九年级上学期数学月考试题及答案.doc
 2021-2022学年辽宁省沈阳市大东区九年级上学期语文期末试题及答案.doc
 2022-2023学年北京东城区初三第一学期物理期末试卷及答案.doc
 2018上半年江西教师资格初中地理学科知识与教学能力真题及答案.doc
 2012年河北国家公务员申论考试真题及答案-省级.doc
 2020-2021学年江苏省扬州市江都区邵樊片九年级上学期数学第一次质量检测试题及答案.doc
 2022下半年黑龙江教师资格证中学综合素质真题及答案.doc