专业实验实验报告
实验 1
1. 需求分析
编程实现傅里叶变换,且不用 FFT。由于不能直接用 FFT 函数,故
考虑用傅里叶变换的定义来实现快速傅里叶变换,对傅里叶变换之后
产生的时域数据进行排序,最后用图像的形式展现。
2. 系统环境 Pycharm2019.3.4
3. 数据库设计
引用 matplotlib、sys、numpy 库,使用 Qt5
from PyQt5.QtWidgets import *
import sys
import numpy as np
import matplotlib
matplotlib.use("Qt5Agg") # 声明使用 QT5
from matplotlib.backends.backend_qt5agg import FigureCanvasQTAgg
from matplotlib.figure import Figure
from learn import Ui_Form
4.系统实现
1)程序功能模块划分
learn 文件创建图形窗口,math 文件对信号进行处理并显示
函数:
def __init__(self, width=5, height=4, dpi=100):创建绘图窗口
def __init__(self):信号产生
def plot_DFT(self, fs, time):对信号上的点采样并进行离散型傅里叶变换
def plot_FFT(self, fs, time):递归的 FFT 运算
�
def Ploral_Add(self, a, b): 复数加法
def Ploral_Sub(self, a, b): 复数减法
def Ploral_Mul(self, a, b): 复数乘法
def FFT(self, a, lim):
FFT 变换算法
def FFt_change(self, s, lim): 给传过来的时域数据排序
def FFT_high(self, fs, time): 迭代的 FFT
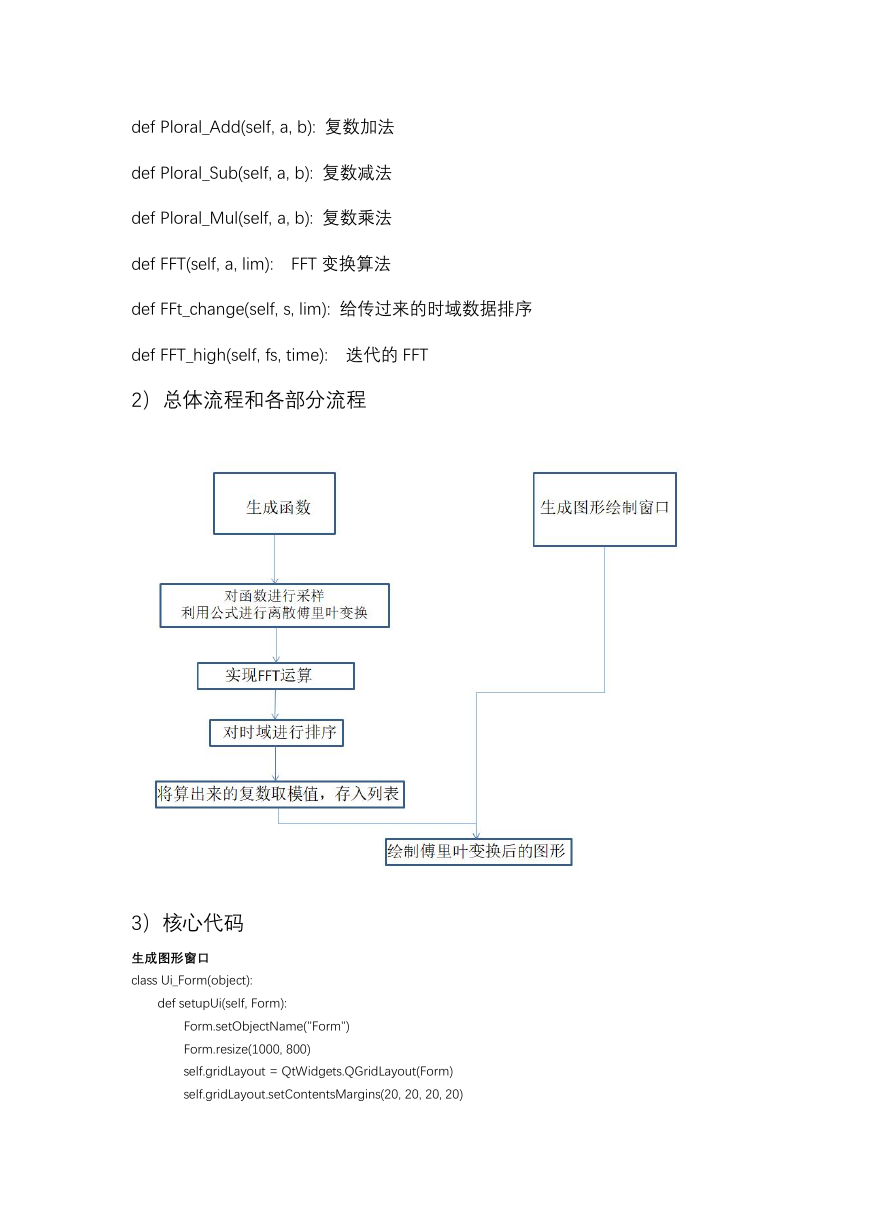
2)总体流程和各部分流程
3)核心代码
生成图形窗口
class Ui_Form(object):
def setupUi(self, Form):
Form.setObjectName("Form")
Form.resize(1000, 800)
self.gridLayout = QtWidgets.QGridLayout(Form)
self.gridLayout.setContentsMargins(20, 20, 20, 20)
�
self.gridLayout.setObjectName("gridLayout")
self.groupBox = QtWidgets.QGroupBox(Form)
self.groupBox.setAlignment(QtCore.Qt.AlignHCenter|QtCore.Qt.AlignTop)
self.groupBox.setObjectName("groupBox")
self.gridLayout.addWidget(self.groupBox, 0, 0, 1, 1)
self.retranslateUi(Form)
QtCore.QMetaObject.connectSlotsByName(Form)
def retranslateUi(self, Form):
_translate = QtCore.QCoreApplication.translate
Form.setWindowTitle(_translate("Form", "傅里叶变换"))
# self.groupBox.setTitle(_translate("Form", "绘制图表"))
复数加法
def Ploral_Add(self, a, b): # 复数加法
c = [a[0] + b[0], a[1] + b[1]]
return c
复数减法
def Ploral_Sub(self, a, b): # 复数减法
c = [a[0] - b[0], a[1] - b[1]]
return c
复数乘法
def Ploral_Mul(self, a, b): # 复数乘法
c = [a[0]*b[0] - a[1]*b[1], a[0]*b[1] + a[1]*b[0]]
return c
变换公式:
def plot_DFT(self, fs, time): # 傅里叶变换按照公式 fs 是采样频率 , time 是整个采样的时间 单位
resolution = fs * time # 计算出总共的点数
fre = 1
t = np.arange(0.0, time, (time / resolution)) # 时域的 t 轴
s = 2 * np.cos(2 * np.pi * t * fre)
# 自己定义的一个时域的函数 一个幅值为 2 频率为 fre 的 cos
是 S
函数
f_x = range(0, resolution)
f_cos = []
f_sin = []
for k in f_x:
# 傅 里 叶 变 换 公 式 , 每 个 频 率 点 的 值 等 于 时 域 中 每 个 点 X[k] = x[n] *
exp(-2*j*pi*k*n/N)的和
# exp 可以用欧拉公式转换成 cos 跟 sin
f_cos_cache = 0
f_sin_cache = 0
for n in f_x:
f_cos_cache += s[n] * np.cos((2 * np.pi * k * n) / resolution)
�
f_sin_cache += s[n] * np.sin((2 * np.pi * k * n) / resolution)
f_cos.append(f_cos_cache)
f_sin.append(f_sin_cache)
f_cos_child = f_cos[0:int(resolution/2)] # 截取一半的点, 另一半的点是无效的
f_cos_max = max(f_cos_child)
f_cos_index = f_cos_child.index(max(f_cos_child))
f_sin_child = f_sin[0:int(resolution / 2)]
f_sin_max = max(f_sin_child)
f_sin_index = f_sin_child.index(max(f_sin_child))
v_cos = np.sqrt(f_cos_max * f_cos_max + f_sin_child[f_cos_index] * f_sin_child[f_cos_index]) * 2 /
resolution
p_cos = np.arctan(f_sin_child[f_cos_index] / f_cos_max) / np.pi
v_sin = np.sqrt(f_sin_max * f_sin_max + f_cos_child[f_sin_index] * f_cos_child[f_sin_index]) * 2 /
resolution
p_sin = np.arctan(f_sin_max / f_cos_child[f_sin_index]) / np.pi
print('f_cos 频率是', f_cos_index * fs / resolution)
print('f_cos 幅值是', v_cos)
print('f_cos 相位是', p_cos)
print('f_sin 频率是', f_sin_index * fs / resolution)
print('f_sin 幅值是', v_sin)
print('f_sin 相位是', p_sin)
self.F.axes1 = self.F.fig.add_subplot(121) # 添加图像 121 是 1 行 2 列第 1 幅图
self.F.axes1.plot(t, s)
self.F.axes1.set_title('Time')
self.F.axes2 = self.F.fig.add_subplot(222) # 添加图像 222 是 2 行 2 列第 2 幅图
self.F.axes2.scatter(f_x, f_cos)
self.F.axes2.set_title('Frequency_cos')
self.F.axes3 = self.F.fig.add_subplot(224) # 添加图像 222 是 2 行 2 列第 4 幅图
self.F.axes3.scatter(f_x, f_sin)
self.F.axes3.set_title('Frequency_sin')
print(f_cos)
def plot_FFT(self, fs, time): # 递归的 FFT
resolution = fs * time # 计算出总共的点数
fre = 1
t = np.arange(0.0, time, (time / resolution))
s = 2 * np.cos(2 * np.pi * t * fre)
# 时域的 t 轴
# 自己定义的一个时域的函数 一个幅值为 2 频率为 fre 的 cos
函数
f = [] # 将时域的数据当做复数的实数部分, 复数部分补零
for i in range(0, resolution):
�
f_cache = [s[i], 0]
f.append(f_cache)
self.FFT(f, len(f)) # 递归的 FFT
f_show = [] # 将算出来的数据 a+bi 进行 c = a*a + b*b ,再对 c 开方, 并存入一个列表 用于显
示频域的图像
for i in range(0, resolution):
f_show.append(np.sqrt(f[i][0]*f[i][0] + f[i][1]*f[i][1]))
self.F.axes1 = self.F.fig.add_subplot(121)
self.F.axes1.plot(t, s)
self.F.axes1.set_title('Time')
self.F.axes2 = self.F.fig.add_subplot(222)
self.F.axes2.scatter(t, f_show)
self.F.axes2.set_title('Frequency_cos')
实现 fft 算法
def FFT(self, a, lim): # 递归的 FFT 变换算法
if lim == 1:
return a
a0 = []
a1 = []
for i in range(0, lim >> 1):
a0.append(a[i*2])
a1.append(a[i * 2 + 1])
self.FFT(a0, lim >> 1)
self.FFT(a1, lim >> 1)
wn = [np.cos(2 * np.pi / lim), np.sin(2 * np.pi / lim)]
w = [1, 0]
for k in range(0, lim >> 1):
a[k] = self.Ploral_Add(a0[k], self.Ploral_Mul(w, a1[k]))
a[k + (lim >> 1)] = self.Ploral_Sub(a0[k], self.Ploral_Mul(w, a1[k]))
w = self.Ploral_Mul(w, wn)
def FFt_change(self, s, lim): # 给传过来的时域数据排序
if lim == 2:
return s
a0 = []
a1 = []
for i in range(0, lim):
if i % 2:
a1.append(s[i])
else:
�
a0.append(s[i])
a0 = self.FFt_change(a0, lim >> 1)
a1 = self.FFt_change(a1, lim >> 1)
return a0 + a1
迭代 fft
def FFT_high(self, fs, time): # 迭代的 FFT
resolution = fs * time # 计算出总共的点数
fre = 1
t = np.arange(0.0, time, (time / resolution)) # 时域的 t 轴
s = 2 * np.cos(2 * np.pi * t * fre) # 自己定义的一个时域的函数 一个幅值为 2 频率为 fre 的 cos
函数
a = s[:]
lim = resolution
a = self.FFt_change(a, lim) # 对时域的数据排序
f = [] # 将排序好的数据进行复数部分补零
for i in range(0, resolution):
f_cache = [a[i], 0]
f.append(f_cache)
print(f)
for dep in range(0, int(np.log2(lim))): # 迭代的 FFT 算法
m = 1 << (dep+1)
wn = [np.cos(2 * np.pi / m), np.sin(2 * np.pi / m)]
for k in range(0, lim, m):
w = [1, 0]
for j in range(0, int(m/2)):
x = self.Ploral_Mul(w, f[int(k + j + m / 2)])
u = f[k + j]
f[k + j] = self.Ploral_Add(u, x)
f[int(k + j + m / 2)] = self.Ploral_Sub(u, x)
w = self.Ploral_Mul(w, wn)
f_show = [] # 将算出来的数据 a+bi 进行 c = a*a + b*b ,再对 c 开方, 并存入一个列表 用于显
示频域的图像
for i in range(0, resolution):
f_show.append(np.sqrt(f[i][0] * f[i][0] + f[i][1] * f[i][1]))
self.F.axes1 = self.F.fig.add_subplot(121) # 创建图像显示
self.F.axes1.plot(t, s)
self.F.axes1.set_title('Time')
self.F.axes2 = self.F.fig.add_subplot(222)
self.F.axes2.scatter(t, f_show)
�
self.F.axes2.set_title('Frequency_cos')
f_cos_child = f_show[0:int(resolution/2)] # 计算频率
f_cos_index = f_cos_child.index(max(f_cos_child))
print('f_cos 频率是', f_cos_index * fs / resolution)
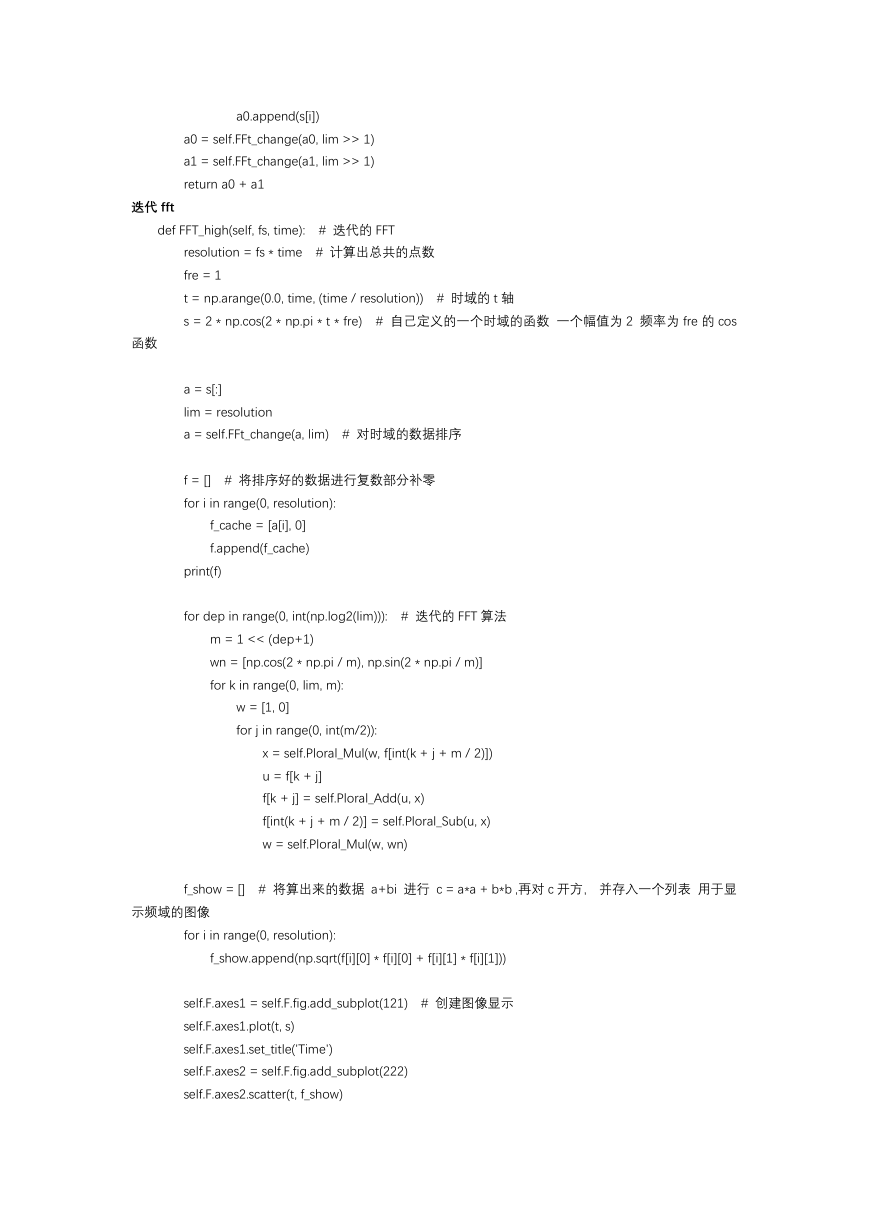
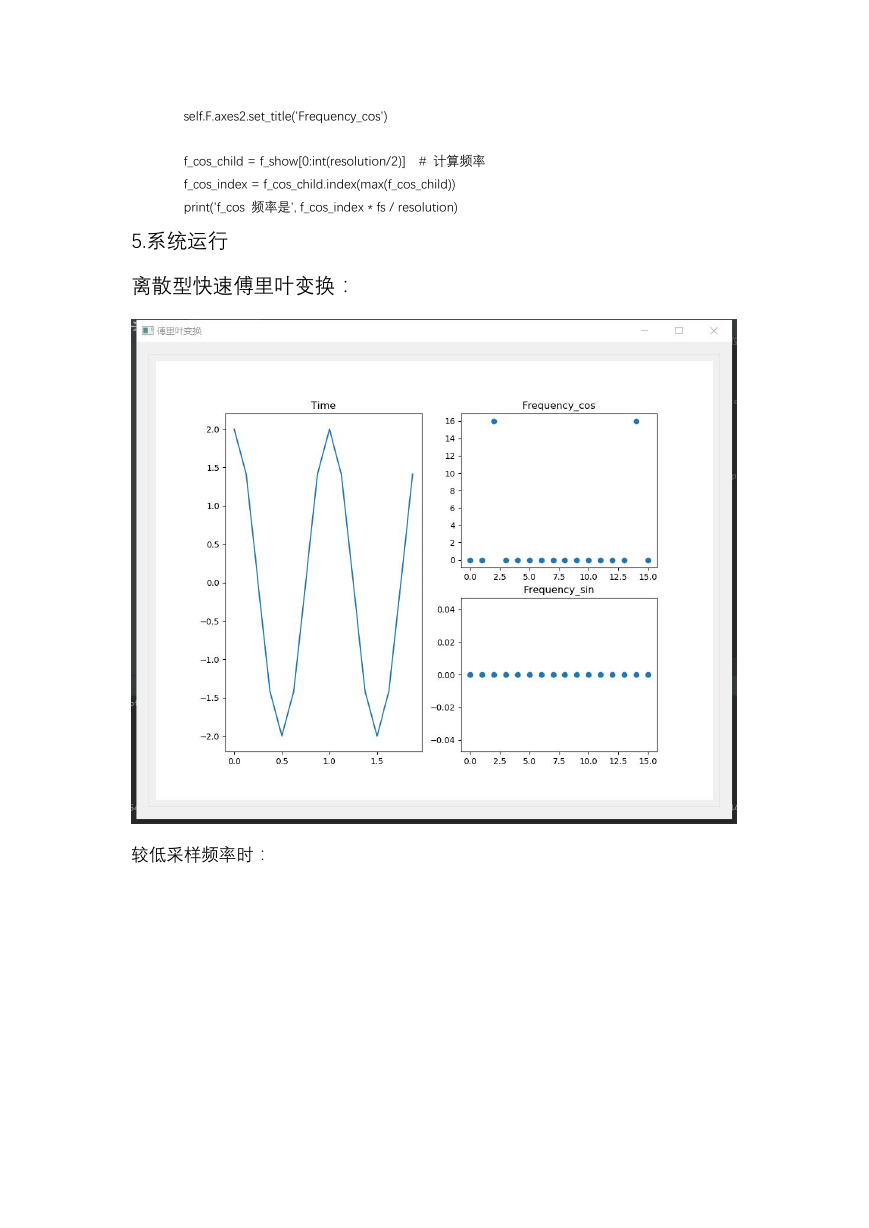
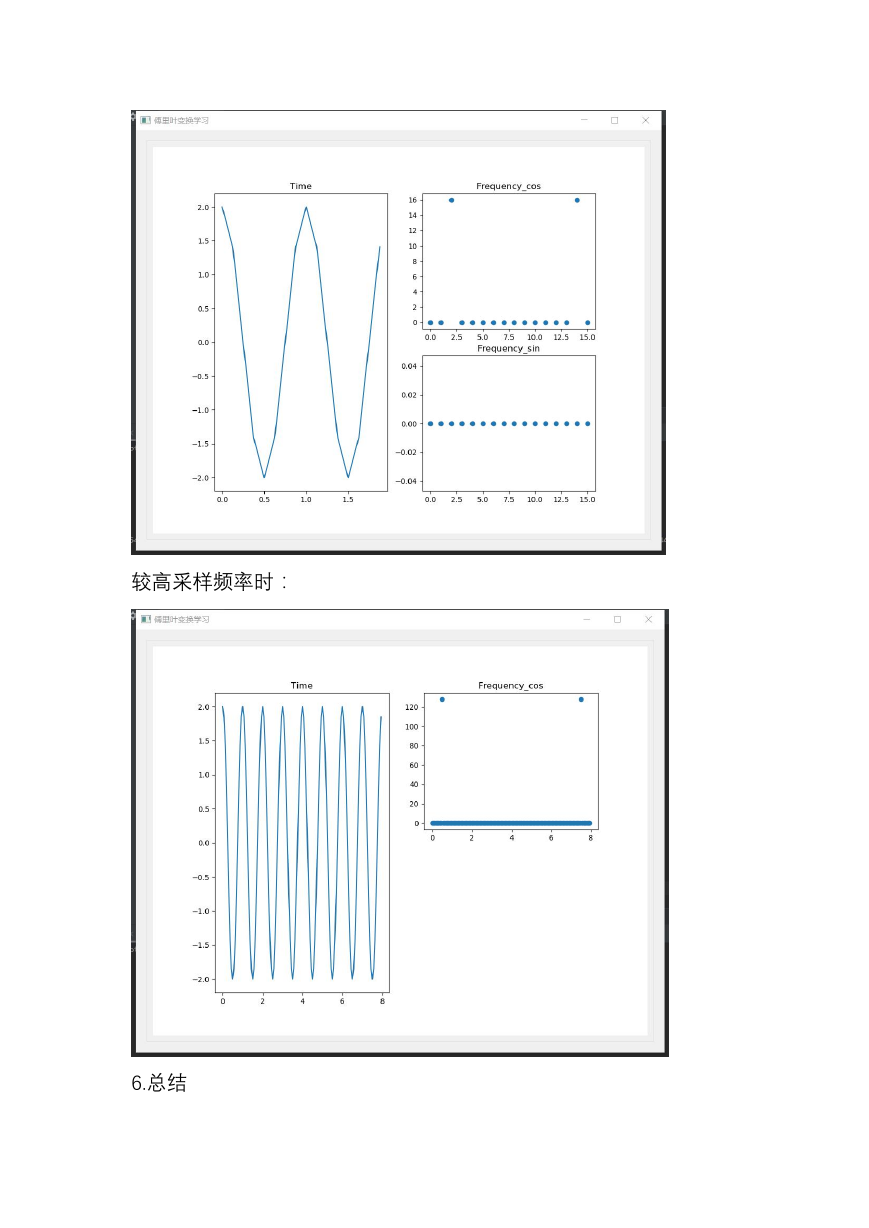
5.系统运行
离散型快速傅里叶变换:
较低采样频率时:
�
较高采样频率时:
6.总结
�



 2023年江西萍乡中考道德与法治真题及答案.doc
 2012年重庆南川中考生物真题及答案.doc
 2013年江西师范大学地理学综合及文艺理论基础考研真题.doc
 2020年四川甘孜小升初语文真题及答案I卷.doc
 2020年注册岩土工程师专业基础考试真题及答案.doc
 2023-2024学年福建省厦门市九年级上学期数学月考试题及答案.doc
 2021-2022学年辽宁省沈阳市大东区九年级上学期语文期末试题及答案.doc
 2022-2023学年北京东城区初三第一学期物理期末试卷及答案.doc
 2018上半年江西教师资格初中地理学科知识与教学能力真题及答案.doc
 2012年河北国家公务员申论考试真题及答案-省级.doc
 2020-2021学年江苏省扬州市江都区邵樊片九年级上学期数学第一次质量检测试题及答案.doc
 2022下半年黑龙江教师资格证中学综合素质真题及答案.doc