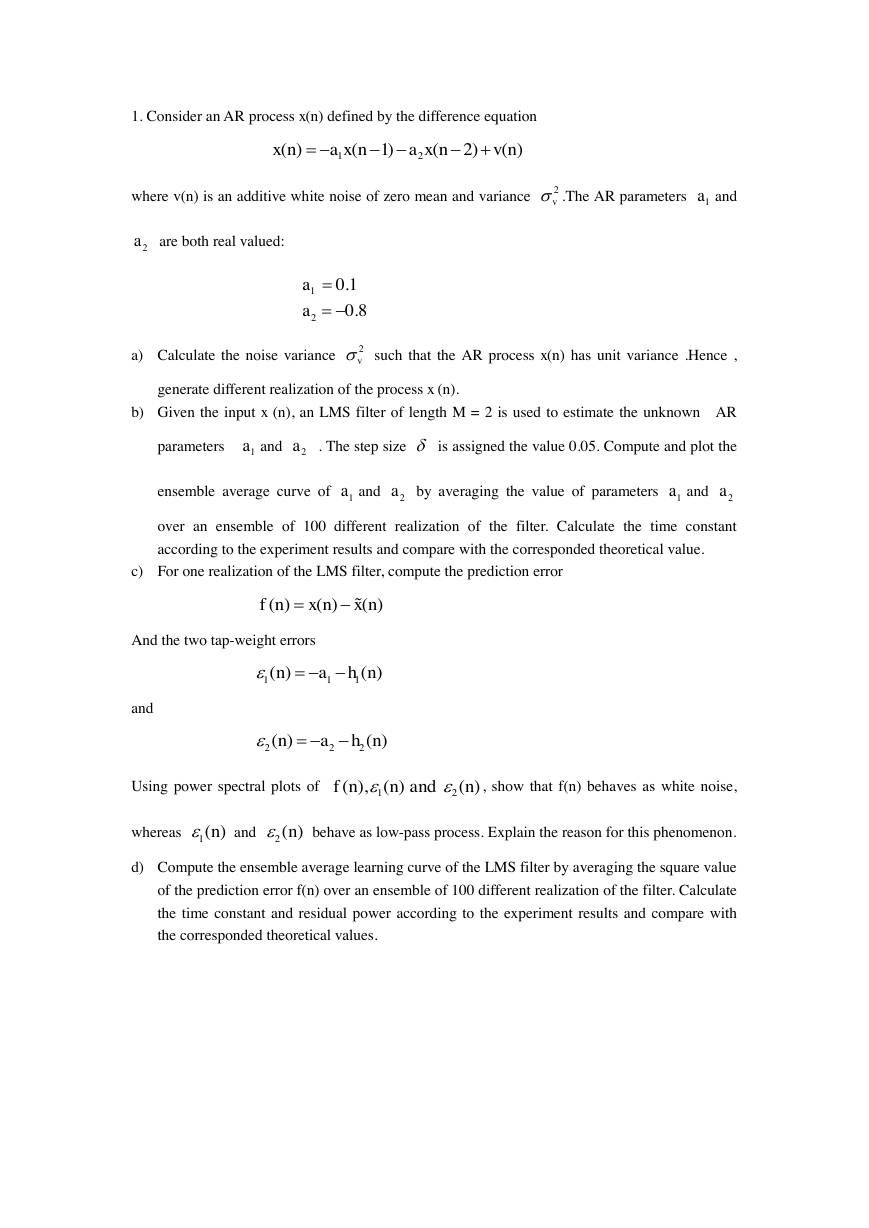
1. Consider an AR process x(n) defined by the difference equation
where v(n) is an additive white noise of zero mean and variance
.The AR parameters
and
are both real valued:
a) Calculate the noise variance
such that the AR process x(n) has unit variance .Hence ,
generate different realization of the process x (n).
b) Given the input x (n), an LMS filter of length M = 2 is used to estimate the unknown AR
parameters
and
. The step size
is assigned the value 0.05. Compute and plot the
ensemble average curve of
and
by averaging the value of parameters
and
over an ensemble of 100 different realization of the filter. Calculate the time constant
according to the experiment results and compare with the corresponded theoretical value.
c) For one realization of the LMS filter, compute the prediction error
And the two tap-weight errors
and
Using power spectral plots of
, show that f(n) behaves as white noise,
whereas
and
behave as low-pass process. Explain the reason for this phenomenon.
d) Compute the ensemble average learning curve of the LMS filter by averaging the square value
of the prediction error f(n) over an ensemble of 100 different realization of the filter. Calculate
the time constant and residual power according to the experiment results and compare with
the corresponded theoretical values.
12()(1)(2)()xnaxnaxnvn2v1a2a120.10.8aa2v1a2a1a2a1a2a()()()fnxnxn111()()nahn222()()nahn12(),() ()fnnandn1() n2() n�
Answer:
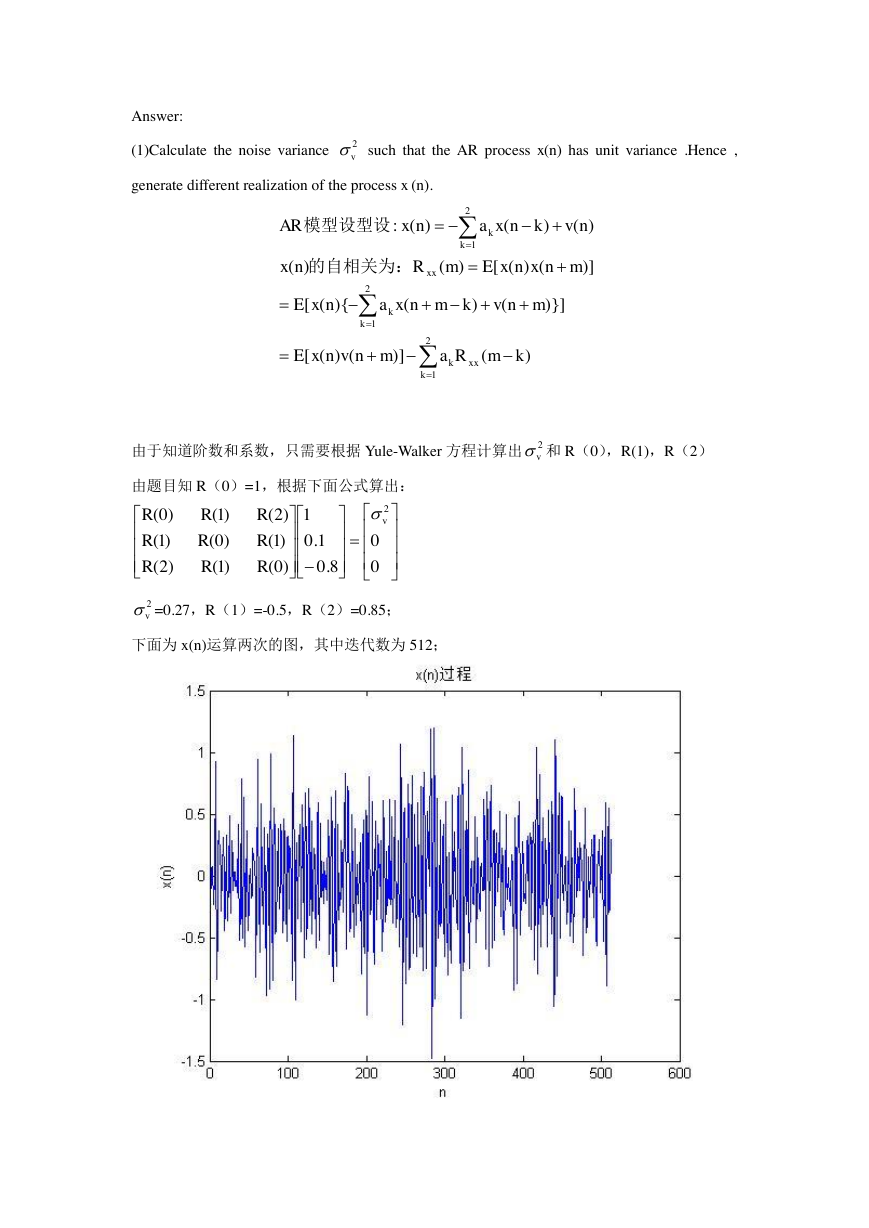
(1)Calculate the noise variance
such that the AR process x(n) has unit variance .Hence ,
generate different realization of the process x (n).
由于知道阶数和系数,只需要根据 Yule-Walker 方程计算出 和 R(0),R(1),R(2)
由题目知 R(0)=1,根据下面公式算出:
=0.27,R(1)=-0.5,R(2)=0.85;
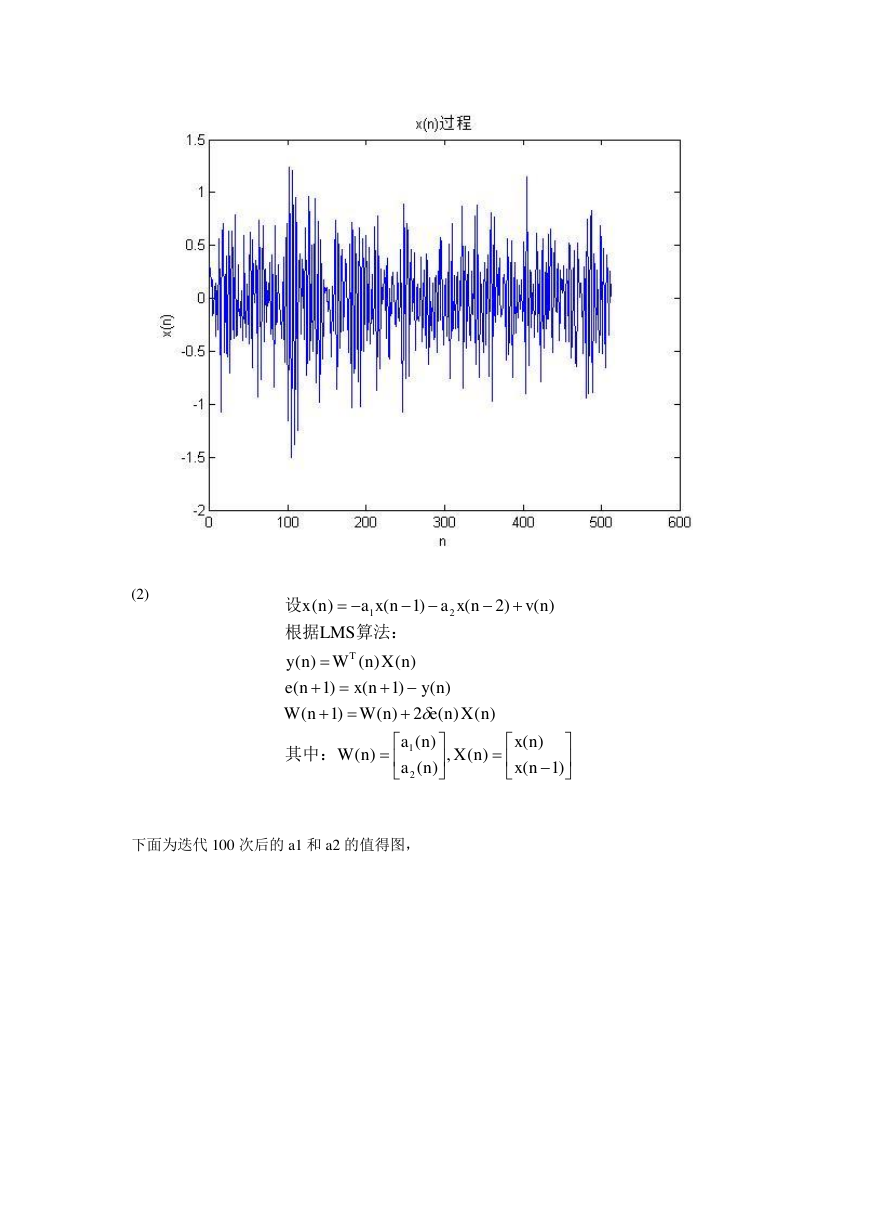
下面为 x(n)运算两次的图,其中迭代数为 512;
2v2v008.01.01)0()1()2()1()0()1()2()1()0(2vRRRRRRRRR2v)(R)]()([)}]()(){([)]()([)(R)()()()(:模型设型设ARxx2121xx21kmamnvnxEmnvkmnxanxEmnxnxEmnxnvknxanxkkkkkk的自相关为:�
(2)
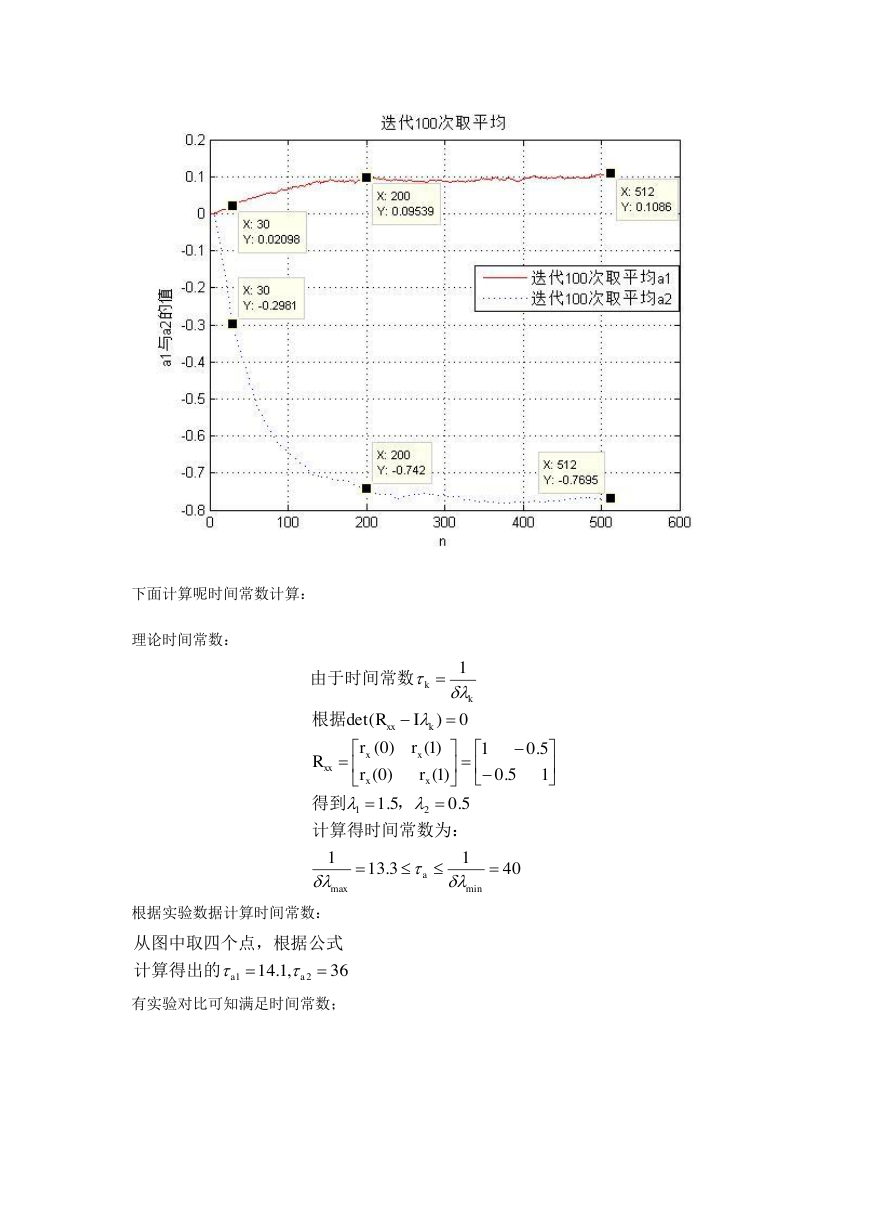
下面为迭代 100 次后的 a1 和 a2 的值得图,
)1()()(,)()()()()(2)()1()()1()1()()()(yLMS)()2()1()n(x2121nxnxnXnananWnXnenWnWnynxnenXnWnnvnxanxaT其中:算法:根据设�
下面计算呢时间常数计算:
理论时间常数:
根据实验数据计算时间常数:
有实验对比可知满足时间常数;
4013.1315.05.115.05.01)1()0()1()0(0)(det1minmax21kaxxxxxxkxxkrrrrRIR计算得时间常数为:,得到根据由于时间常数36,1.142a1a计算得出的公式从图中取四个点,根据�
(3)For one realization of the LMS filter, compute the prediction error
And the two tap-weight errors
and
Using power spectral plots of
, show that f(n) behaves as white noise,
whereas
and
behave as low-pass process. Explain the reason for this phenomenon.
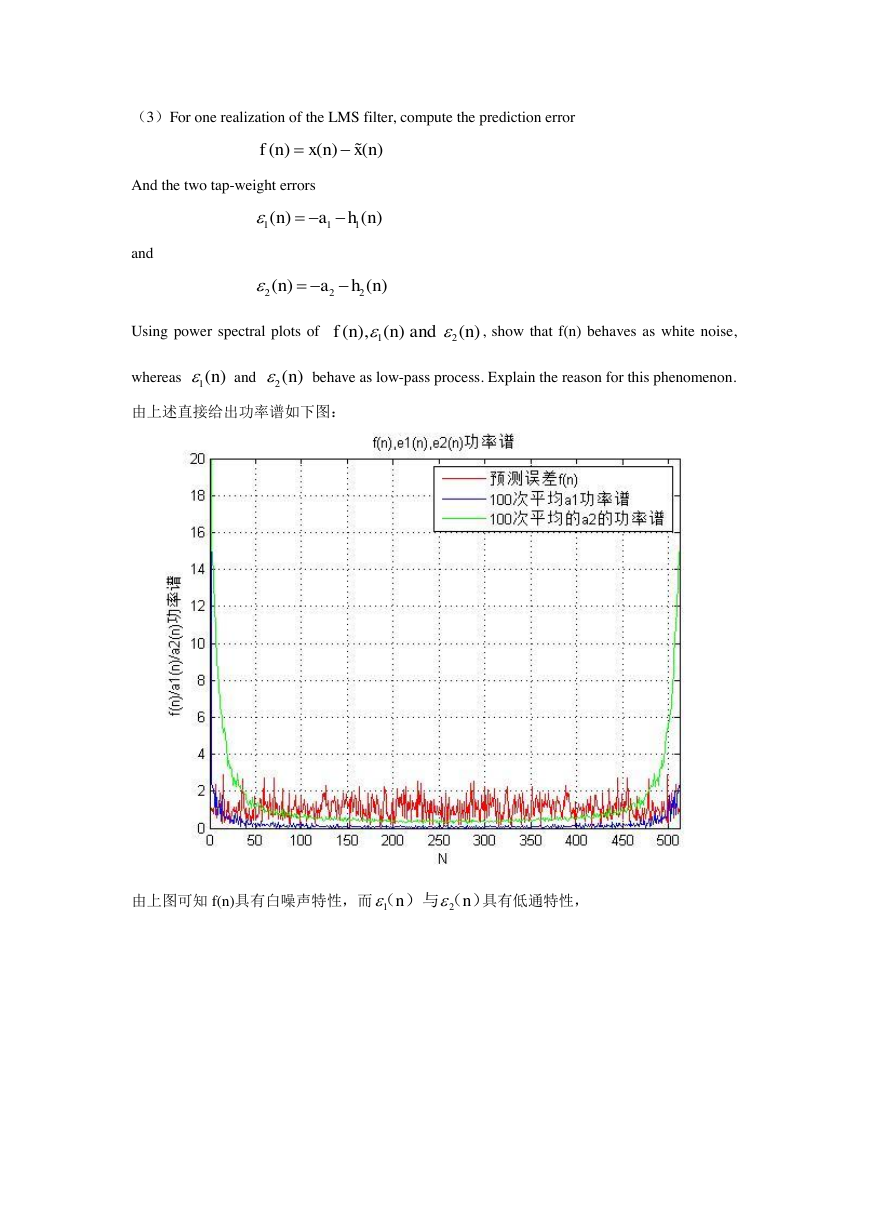
由上述直接给出功率谱如下图:
由上图可知 f(n)具有白噪声特性,而
具有低通特性,
()()()fnxnxn111()()nahn222()()nahn12(),() ()fnnandn1() n2() n)()与(nn21�
(4)Compute the ensemble average learning curve of the LMS filter by averaging the square
value of the prediction error f(n) over an ensemble of 100 different realization of the filter.
Calculate the time constant and residual power according to the experiment results and compare
with the corresponded theoretical values.
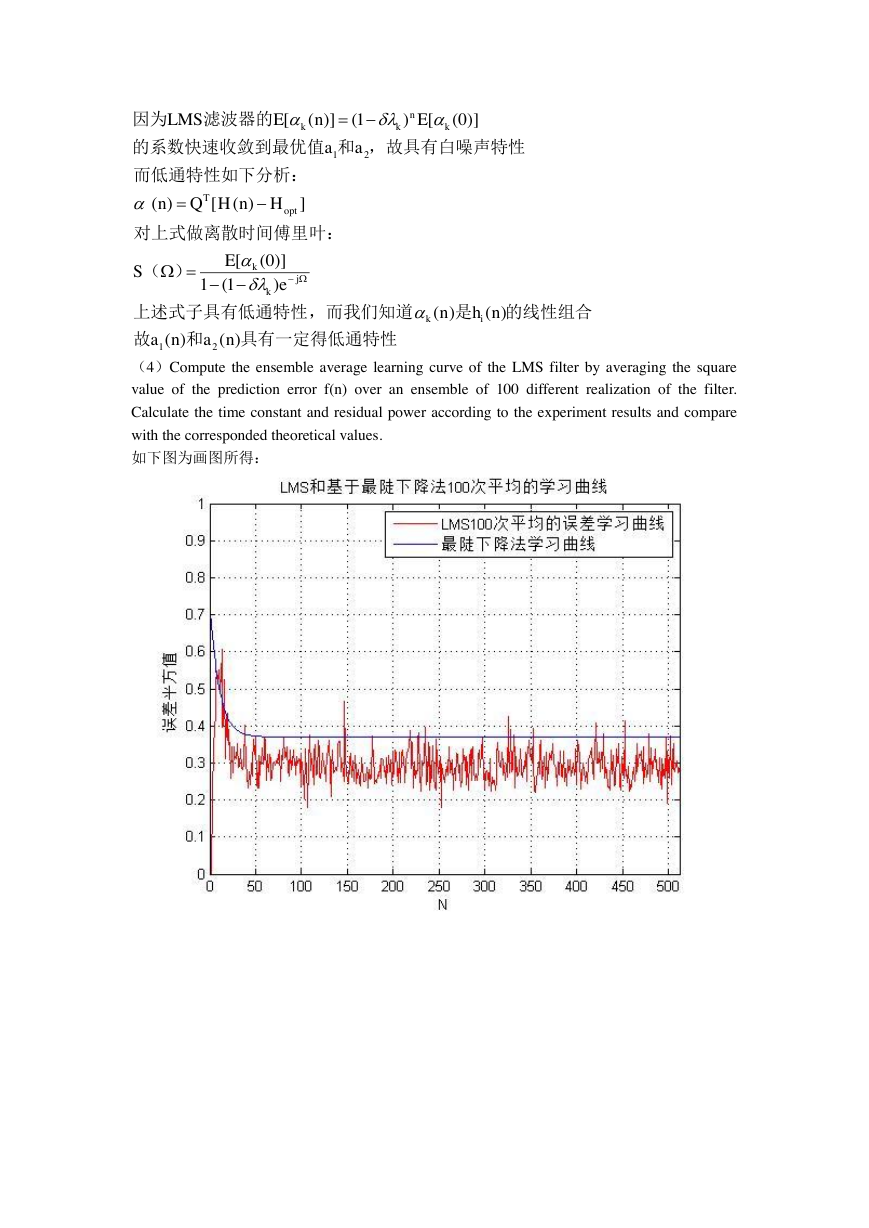
如下图为画图所得:
具有一定得低通特性和故的线性组合是,而我们知道上述式子具有低通特性)(叶:对上式做离散时间傅里而低通特性如下分析:,故具有白噪声特性和值的系数快速收敛到最优滤波器的因为)()()()n()1(1)]0([ES])([Q)(a)]0([E)1()]([ELMS21T21nananheHnHnanikjkkoptknkk�
由上图任取两个值进行实验和理论值得比较:
根据公式:
综述实验和理论计算基本吻合。
2. 设
是窄带信号,定义
是在
区间上均匀分布的随机相位。
是寬带信号,它是一个零均值、方差为 1 的白噪音信号
e(n)激励一个线性滤波器而产生,其差分方程为
。
1) 计算
和
各自的自相关函数,并画出其函数图形。根据此选择合适的延
时,以实现谱线增强。
2) 产生一个
序列。选择合适的 值。让
通过谱线增强器。画出输出信号
和误差信号 e(n)的波形,并分别与
和
比较。
(1)计算
和
各自的自相关函数,并画出其函数图形。根据此选择合适的延时,
以实现谱线增强。
;37.0,284.0J;2)2()1(,)0()1()1()0(R,)0()21/(JJ;1021LMSminxx1xxmin2minkJNrrrrrrrrRHrHRJNxxyxxxxxyxoptyxToptxk)(方收敛误差为由上述计算出的理论均,)(均方收敛后的误差为::理论上均分时间收敛为算法性能分析可知:根据49.93029.0395214.016288.0])([)(JJJJNJeJnJNn,;取实验数据121()()(),()xnxnxnxn1()sin(0.05),xnn[0,2]2()xn2()()2(1)(2)xnenenen1()xn2()xn()xn()xn()yn1()xn2()xn1()xn2()xn�
下面为画出的图形:
由上图可知道,LMS 参考信号中的宽带成分在延时因子 D 大于等于 3 后与输入的宽带信号
成分不相关。而窄带信号依然具有相关性,因此通过 LMS 滤波有效的增强一定幅度。
(2)产生一个
序列。选择合适的 值。让
通过谱线增强器。画出输出信号
和误差信号 e(n)的波形,并分别与
和
比较。
我们知道噪声的平均功率远大于正弦的平均功率,所以为了实现谱线增强需要选取合适的滤
波阶数和迭代步长;
首先分析滤波器阶数:
当滤波器阶数较小时误差信号可以收敛到
,而
不能很好收敛到
而迭代步长:
我们知道迭代步长越小,精度大但收敛慢,而迭代大了,精度小,收敛快
)2()1(4)(6)1(4)2()}]2()1(2)()}{2()1(2)([{E)]()([)()()05.0cos(21)]2)2(05.0cos()05.0[cos(21)])(05.0sin()05.0[sin()]()([)()(22221111kkkkkkneknekneneneneknxnxEkrnxkknkEknnEknxnxEkrnxxx得自相关然后计算的自相关:先计算()xn()xn()yn1()xn2()xn2()xn()yn1()xn�


 2023年江西萍乡中考道德与法治真题及答案.doc
 2012年重庆南川中考生物真题及答案.doc
 2013年江西师范大学地理学综合及文艺理论基础考研真题.doc
 2020年四川甘孜小升初语文真题及答案I卷.doc
 2020年注册岩土工程师专业基础考试真题及答案.doc
 2023-2024学年福建省厦门市九年级上学期数学月考试题及答案.doc
 2021-2022学年辽宁省沈阳市大东区九年级上学期语文期末试题及答案.doc
 2022-2023学年北京东城区初三第一学期物理期末试卷及答案.doc
 2018上半年江西教师资格初中地理学科知识与教学能力真题及答案.doc
 2012年河北国家公务员申论考试真题及答案-省级.doc
 2020-2021学年江苏省扬州市江都区邵樊片九年级上学期数学第一次质量检测试题及答案.doc
 2022下半年黑龙江教师资格证中学综合素质真题及答案.doc