European Machine Vision Association
Release 3.1, Release Candidate
Issued by
www.emva.org
November 12, 2012
R elease
C andidate
EMVA Standard 1288
Standard for Characterization of Image
Sensors and Cameras
Contents
4
1
2
3 Dark Current
Introduction and Scope . . . . . . . . . . . . . . . . . . . . . . . . . . . . . . . .
Sensitivity, Linearity, and Noise . . . . . . . . . . . . . . . . . . . . . . . . . . .
2.1 Linear Signal Model
. . . . . . . . . . . . . . . . . . . . . . . . . . . . . . .
. . . . . . . . . . . . . . . . . . . . . . . . . . . . . . . . . . .
2.2 Noise Model
2.3 Signal-to-Noise Ratio (SNR)
. . . . . . . . . . . . . . . . . . . . . . . . . .
2.4 Signal Saturation and Absolute Sensitivity Threshold . . . . . . . . . . . .
. . . . . . . . . . . . . . . . . . . . . . . . . . . . . . . . . . . . .
3.1 Mean and Variance
. . . . . . . . . . . . . . . . . . . . . . . . . . . . . . .
3.2 Temperature Dependence . . . . . . . . . . . . . . . . . . . . . . . . . . . .
Spatial Nonuniformity and Defect Pixels . . . . . . . . . . . . . . . . . . . . . .
4.1 Spatial Variances, DSNU, and PRNU . . . . . . . . . . . . . . . . . . . . .
4.2 Types of Nonuniformities . . . . . . . . . . . . . . . . . . . . . . . . . . . .
4.3 Defect Pixels . . . . . . . . . . . . . . . . . . . . . . . . . . . . . . . . . . .
4.3.1 Logarithmic Histograms. . . . . . . . . . . . . . . . . . . . . . . . . .
4.3.2 Accumulated Histograms.
. . . . . . . . . . . . . . . . . . . . . . . .
4.4 Highpass Filtering . . . . . . . . . . . . . . . . . . . . . . . . . . . . . . . .
5 Overview Measurement Setup and Methods
. . . . . . . . . . . . . . . . . . . .
6 Methods for Sensitivity, Linearity, and Noise . . . . . . . . . . . . . . . . . . . .
6.1 Geometry of Homogeneous Light Source . . . . . . . . . . . . . . . . . . . .
6.2 Spectral Properties of Light Source . . . . . . . . . . . . . . . . . . . . . . .
6.3 Variation of Irradiation . . . . . . . . . . . . . . . . . . . . . . . . . . . . .
6.4 Calibration of Irradiation . . . . . . . . . . . . . . . . . . . . . . . . . . . .
6.5 Measurement Conditions for Linearity and Sensitivity . . . . . . . . . . . .
6.6 Evaluation of the Measurements according to the Photon Transfer Method
4
5
5
6
6
7
8
8
8
8
9
9
10
10
10
11
12
12
12
13
14
14
15
15
�
Standard for Characterization
of Image Sensors and Cameras
Release 3.1, Release Candidate, November 12, 2012
19
19
19
19
21
21
22
25
29
29
29
29
29
30
31
31
31
33
34
35
35
35
35
36
37
38
38
38
10 Publishing the Results
6.7 Evaluation of Linearity . . . . . . . . . . . . . . . . . . . . . . . . . . . . .
7 Methods for Dark Current . . . . . . . . . . . . . . . . . . . . . . . . . . . . . .
7.1 Evaluation of Dark Current at One Temperature . . . . . . . . . . . . . . .
7.2 Evaluation of Dark Current with Temperatures . . . . . . . . . . . . . . . .
8 Methods for Spatial Nonuniformity and Defect Pixels . . . . . . . . . . . . . . .
8.1 Spatial Standard Deviation, DSNU, PRNU and total SNR . . . . . . . . .
8.2 Horizontal and Vertical Spectrograms . . . . . . . . . . . . . . . . . . . . .
8.3 Defect Pixel Characterization . . . . . . . . . . . . . . . . . . . . . . . . . .
9 Methods for Spectral Sensitivity . . . . . . . . . . . . . . . . . . . . . . . . . . .
9.1 Spectral Light Source Setup . . . . . . . . . . . . . . . . . . . . . . . . . . .
9.2 Measuring Conditions . . . . . . . . . . . . . . . . . . . . . . . . . . . . . .
9.3 Calibration . . . . . . . . . . . . . . . . . . . . . . . . . . . . . . . . . . . .
9.4 Evaluation . . . . . . . . . . . . . . . . . . . . . . . . . . . . . . . . . . . .
. . . . . . . . . . . . . . . . . . . . . . . . . . . . . . . .
10.1 Basic Information . . . . . . . . . . . . . . . . . . . . . . . . . . . . . . . .
10.2 The EMVA 1288 Parameters . . . . . . . . . . . . . . . . . . . . . . . . . .
10.3 The EMVA 1288 Datasheet . . . . . . . . . . . . . . . . . . . . . . . . . . .
A Bibliography . . . . . . . . . . . . . . . . . . . . . . . . . . . . . . . . . . . . . .
B Notation . . . . . . . . . . . . . . . . . . . . . . . . . . . . . . . . . . . . . . . .
C Changes to Release A2.01 . . . . . . . . . . . . . . . . . . . . . . . . . . . . . .
C.1 Added Features . . . . . . . . . . . . . . . . . . . . . . . . . . . . . . . . . .
C.2 Extension of Methods to Vary Irradiation . . . . . . . . . . . . . . . . . . .
C.3 Modifications in Conditions and Procedures . . . . . . . . . . . . . . . . . .
C.4 Limit for Minimal Temporal Standard Deviation; Introduction of Quantiza-
tion Noise . . . . . . . . . . . . . . . . . . . . . . . . . . . . . . . . . . . . .
C.5 Highpass Filtering with Nonuniformity Measurements . . . . . . . . . . . .
D Changes to Release 3.0 . . . . . . . . . . . . . . . . . . . . . . . . . . . . . . . .
. . . . . . . . . . . . . . . . . . . . . . . . . . . . . . . . . . . . .
D.1 Change I
D.2 Added Features . . . . . . . . . . . . . . . . . . . . . . . . . . . . . . . . . .
R elease
C andidate
2 of 38
c Copyright EMVA, 2011
�
Standard for Characterization
of Image Sensors and Cameras
Release 3.1, Release Candidate, November 12, 2012
Acknowledgements
Please refer to www.standard1288.org for the list of contributors to the Standard.
EMVA 1288 is an initiative driven by the industry and living from the personal initiative
of the supporting companies and institutions delegates as well as from the support of these
organizations. Thanks to this generosity the presented document can be provided free of
charge to the users of this standard. EMVA thanks those contributors in the name of the
whole vision community.
Rights and Trademarks
The European Machine Vision Association owns the ”EMVA, standard 1288 compliant” logo.
Any company can obtain a license to use the ”EMVA standard 1288 compliant” logo, free
of charge, with product specifications measured and presented according to the definitions
in EMVA standard 1288. The licensee guarantees that he meets the terms of use in the
relevant release of EMVA standard 1288. Licensed users will self-certify compliance of their
measurement setup, computation and representation with which the ”EMVA standard 1288
compliant” logo is used. The licensee has to check regularly compliance with the relevant
release of EMVA standard 1288, at least once a year. When displayed on line the logo has
to be featured with a link to EMVA standardization web page. EMVA will not be liable
for specifications not compliant with the standard and damage resulting there from. EMVA
keeps the right to withdraw the granted license any time and without giving reasons.
About this Standard
R elease
C andidate
EMVA has started the initiative to define a unified method to measure, compute and present
specification parameters and characterization data for cameras and image sensors used for
machine vision applications. The standard does not define what nature of data should be
disclosed. It is up to the component manufacturer to decide if he wishes to publish typical
data, data of an individual component, guaranteed data, or even guaranteed performance
over life time of the component. However the component manufacturer shall clearly indicate
what the nature of the presented data is. The standard is organized in different sections,
each addressing a group of specification parameters, assuming a certain physical behavior
of the sensor or camera under certain boundary conditions. Additional sections covering
more parameters and a wider range of sensor and camera products will be added succes-
sively. There are compulsory sections, of which all measurements must be made and of
which all required data and graphics must be included in a datasheet using the EMVA1288
logo. Further there are optional sections which may be skipped for a component where the
respective data is not relevant or the mathematical model is not applicable. Each datasheet
shall clearly indicate which sections of the EMVA1288 standard are enclosed.
It may be necessary for the manufacturer to indicate additional, component specific
information, not defined in the standard, to fully describe the performance of image sensor
or camera products, or to describe physical behavior not covered by the mathematical models
of the standard. It is possible in accordance with the EMVA1288 standard to include such
data in the same datasheet. However the data obtained by procedures not described in the
current release of the EMVA1288 standard must be clearly designated and grouped in a
separate section. It is not permitted to use parameter designations defined in any of the
EMVA1288 modules for such additional information not acquired or presented according
the EMVA1288 procedures.
The standard is intended to provide a concise definition and clear description of the
measurement process and to benefit the Automated Vision Industry by providing fast, com-
prehensive and consistent access to specification information for cameras and sensors. It
will be particularly beneficial for those who wish to compare cameras or who wish to cal-
culate system performance based on the performance specifications of an image sensor or a
camera.
c Copyright EMVA, 2011
3 of 38
�
Standard for Characterization
of Image Sensors and Cameras
Release 3.1, Release Candidate, November 12, 2012
1
Introduction and Scope
This release of the standard covers monochrome and color digital cameras with linear photo
response characteristics. It is valid for area scan and line scan cameras. Analog cameras
can be described according to this standard in conjunction with a frame grabber; similarly,
image sensors can be described as part of a camera. If not specified otherwise, the term
camera is used for all these items.
The standard text is parted into four sections describing the mathematical model and
parameters that characterize cameras and sensors with respect to
• Section 2: linearity, sensitivity, and noise for monochrome and color cameras,
• Section 3: dark current,
• Section 4: sensor array nonuniformities and defect pixels characterization,
a section with an overview of the required measuring setup (Section 5), and five sections
that detail the requirements for the measuring setup and the evaluation methods for
• Section 6: linearity, sensitivity, and noise,
• Section 7: dark current,
• Section 8: sensor array nonuniformities and defect pixels characterization,
• Section 9: spectral sensitivity,
The detailed setup is not regulated in order not to hinder progress and the ingenuity of
the implementers. It is, however, mandatory that the measuring setups meet the properties
specified by the standard. Section 10 finally describes how to produce the EMVA 1288
datasheets. Appendix B describes the notation and Appendix C details the changes to
release 2
R elease
C andidate
It is important to note that the standard can only be applied if the camera under test can
actually be described by the mathematical model on which the standard is based. If these
conditions are not fulfilled, the computed parameters are meaningless with respect to the
camera under test and thus the standard cannot be applied. Currently, electron multiplying
cameras (EM CCD, [1, 2]) and cameras that are sensitive in the deep ultraviolet, where more
than one electron per absorbed photon is generated [5], are not covered by the standard.
The general assumptions include
1. The amount of photons collected by a pixel depends on the product of irradiance E
(units W/m2) and exposure time texp (units s), i. e., the radiative energy density Etexp
at the sensor plane.
2. The sensor is linear, i. e., the digital signal y increases linear with the number of photons
received.
3. All noise sources are wide-sense stationary and white with respect to time and space.
The parameters describing the noise are invariant with respect to time and space.
4. Only the total quantum efficiency is wavelength dependent. The effects caused by light
of different wavelengths can be linearly superimposed.
5. Only the dark current is temperature dependent.
These assumptions describe the properties of an ideal camera or sensor. A real sensor will
depart more or less from an ideal sensor. As long as the deviation is small, the description is
still valid and it is one of the tasks of the standard to describe the degree of deviation from
an ideal behavior. However, if the deviation is too large, the parameters derived may be too
uncertain or may even render meaningless. Then the camera cannot be characterized using
this standard. The standard can also not be used for cameras that clearly deviate from one
of these assumptions. For example, a camera with a logarithmic instead of a linear response
curve cannot be described with the present release of the standard.
4 of 38
c Copyright EMVA, 2011
�
Standard for Characterization
of Image Sensors and Cameras
Release 3.1, Release Candidate, November 12, 2012
a
b
2.1 Linear Signal Model
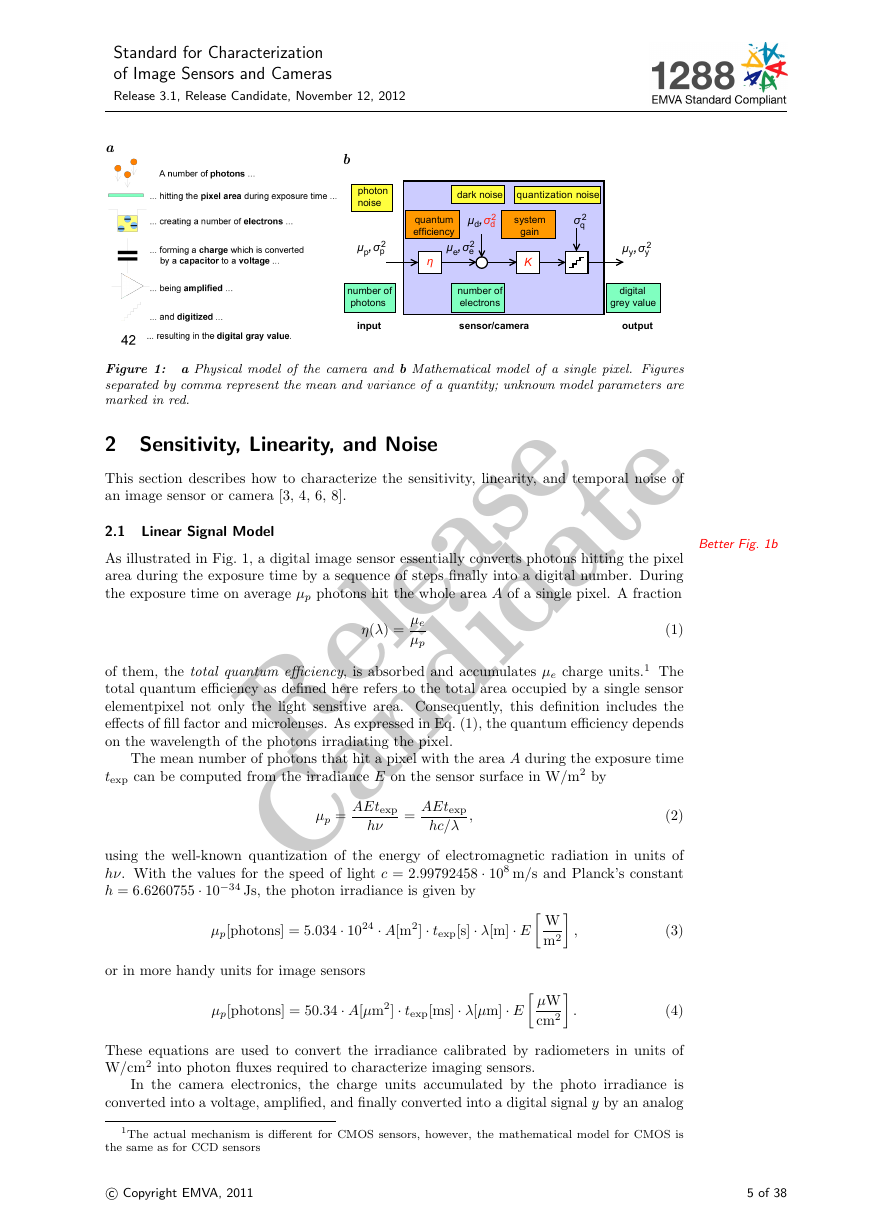
As illustrated in Fig. 1, a digital image sensor essentially converts photons hitting the pixel
area during the exposure time by a sequence of steps finally into a digital number. During
the exposure time on average µp photons hit the whole area A of a single pixel. A fraction
Better Fig. 1b
Figure 1: a Physical model of the camera and b Mathematical model of a single pixel. Figures
separated by comma represent the mean and variance of a quantity; unknown model parameters are
marked in red.
2 Sensitivity, Linearity, and Noise
This section describes how to characterize the sensitivity, linearity, and temporal noise of
an image sensor or camera [3, 4, 6, 8].
η(λ) =
R elease
C andidate
AEtexp
hc/λ
AEtexp
µe
µp
µp =
=
,
hν
(1)
(2)
of them, the total quantum efficiency, is absorbed and accumulates µe charge units.1 The
total quantum efficiency as defined here refers to the total area occupied by a single sensor
elementpixel not only the light sensitive area. Consequently, this definition includes the
effects of fill factor and microlenses. As expressed in Eq. (1), the quantum efficiency depends
on the wavelength of the photons irradiating the pixel.
The mean number of photons that hit a pixel with the area A during the exposure time
texp can be computed from the irradiance E on the sensor surface in W/m2 by
using the well-known quantization of the energy of electromagnetic radiation in units of
hν. With the values for the speed of light c = 2.99792458 · 108 m/s and Planck’s constant
h = 6.6260755 · 10−34 Js, the photon irradiance is given by
µp[photons] = 5.034 · 1024 · A[m2] · texp[s] · λ[m] · E
or in more handy units for image sensors
µp[photons] = 50.34 · A[µm2] · texp[ms] · λ[µm] · E
W
µW
m2
cm2
,
.
(3)
(4)
These equations are used to convert the irradiance calibrated by radiometers in units of
W/cm2 into photon fluxes required to characterize imaging sensors.
In the camera electronics, the charge units accumulated by the photo irradiance is
converted into a voltage, amplified, and finally converted into a digital signal y by an analog
1The actual mechanism is different for CMOS sensors, however, the mathematical model for CMOS is
the same as for CCD sensors
c Copyright EMVA, 2011
5 of 38
Kηquantumefficiencysystem gainnumber ofphotonsnumber ofelectronsdigital grey valuedark noisequantization noiseqσphotonnoise2µyσy,µdσd,2µpσp,µeσe,inputoutputsensor/camera222�
Standard for Characterization
of Image Sensors and Cameras
Release 3.1, Release Candidate, November 12, 2012
digital converter (ADC). The whole process is assumed to be linear and can be described by
a single quantity, the overall system gain K with units DN/e−, i. e., digits per electrons.2
Then the mean digital signal µy results in
µy = K(µe + µd)
or µy = µy.dark + Kµe,
(5)
where µd is the mean number electrons present without light, which result in the mean
dark signal µy.dark = Kµd in units DN with zero irradiation. Note that the dark signal
will generally depend on other parameters, especially the exposure time and the ambient
temperature (Section 3).
With Eqs. (1) and (2), Eq. (5) results in a linear relation between the mean gray value
µy and the number of photons irradiated during the exposure time onto the pixel:
µy = µy.dark + Kη µp = µy.dark + Kη
λA
hc
E texp.
(6)
2.2 Noise Model
The number of charge units (electrons) fluctuates statistically. According to the laws of
quantum mechanics, the probability is Poisson distributed. Therefore the variance of the
fluctuations is equal to the mean number of accumulated electrons:
This equation can be used to verify the linearity of the sensor by measuring the mean gray
value in relation to the mean number of photons incident on the pixel and to measure the
responsivity Kη from the slope of the relation. Once the overall system gain K is determined
from Eq. (9), it is also possible to estimate the quantum efficiency from the responsivity
Kη.
R elease
C andidate
All other noise sources depend on the specific construction of the sensor and the camera
electronics. Due to the linear signal model (Section 2.1), all noise sources add up. For
the purpose of a camera model treating the whole camera electronics as a black box it is
sufficient to consider only two additional noise sources. All noise sources related to the
sensor read out and amplifier circuits can be described by a signal independent normal-
distributed noise source with the variance σ2
d. The final analog digital conversion (Fig. 1b)
adds another noise source that is uniform-distributed between the quantization intervals and
q = 1/12 DN2 [8].Because the variance of all noise sources add up linear,
has a variance σ2
the total temporal variance of the digital signal y, σ2
y, is given according to the laws of error
propagation by
This noise, often referred to as shot noise is given by the basic laws of physics and equal for
all types of cameras.
Using Eqs. (7) and (5), the noise can be related to the measured mean digital signal:
+ σ2
q
σ2
e = µe.
(7)
σ2
y = K 2σ2
(µy − µy.dark).
σ2
d + σ2
e
y = K 2σ2
+ K
d + σ2
q
slope
offset
(8)
(9)
This equation is central to the characterization of the sensor. From the linear relation
y and the mean photo-induced gray value µy−µy.dark it is
between the variance of the noise σ2
possible to determine the overall system gain K from the slope and the dark noise variance
σ2
d from the offset. This method is known as the photon transfer method [6, 7].
2.3 Signal-to-Noise Ratio (SNR)
The quality of the signal is expressed by the signal-to-noise ratio (SNR), which is defined as
SNR =
.
(10)
µy − µy.dark
σy
2DN is a dimensionless unit, but for sake of clarity, it is better to denote it specifically.
6 of 38
c Copyright EMVA, 2011
�
SNR(µp) ≈
Standard for Characterization
of Image Sensors and Cameras
Release 3.1, Release Candidate, November 12, 2012
Using Eqs. (6) and (8), the SNR can then be written as
SNR(µp) =
ηµp
σ2
d + σ2
q /K 2 + ηµp
.
(11)
Except for the small effect caused by the quantification noise, the overall system gain K
cancels out so that the SNR depends only on the quantum efficiency η(λ) and the dark
signal noise σd in units e−. Two limiting cases are of interest: the high-photon range with
ηµp σ2
d + σ2
q /K 2:
q /K 2 and the low-photon range with ηµp σ2
ηµp σ2
ηµp,
√
d + σ2
d + σ2
q /K 2,
ηµp
σ2
d + σ2
q /K 2
,
ηµp σ2
d + σ2
q /K 2.
(12)
(13)
Using this curve in SNR graphs, it becomes immediately visible how close a real sensor
comes to an ideal sensor.
This means that the slope of the SNR curve changes from a linear increase at low irradiation
to a slower square root increase at high irradiation.
A real sensor can always be compared to an ideal sensor with a quantum efficiency
η = 1, no dark noise (σd = 0) and negligible quantization noise (σq/K = 0). The SNR of
an ideal sensor is given by
2.4 Signal Saturation and Absolute Sensitivity Threshold
For an k-bit digital camera, the digital gray values are in a range between the 0 and 2k − 1.
The practically useable gray value range is smaller, however. The mean dark gray value
µy.dark must be higher than zero so that no significant underflow occurs by temporal noise
and the dark signal nonuniformity (for an exact definition see Section 6.5). Likewise the
maximal usable gray value is lower than 2k − 1 because of the temporal noise and the photo
response nonuniformity.
Therefore, the saturation irradiation µp.sat is defined as the maximum of the measured
relation between the variance of the gray value and the irradiation in units photons/pixel.
The rational behind this definition is that according to Eq. (9) the variance is increasing with
the gray value but is decreasing again, when the digital values are clipped to the maximum
digital gray value 2k − 1.
√
µp.
SNRideal =
R elease
C andidate
µe.sat = ηµp.sat.
It is normally
The saturation capacity must not be confused with the full-well capacity.
lower than the full-well capacity, because the signal is clipped to the maximum digital value
2k − 1 before the physical saturation of the pixel is reached.
The minimum detectable irradiation or absolute sensitivity threshold, µp.min can be de-
fined by using the SNR. It is the mean number of photons required so that the SNR is equal
to one.
From the saturation irradiation µp.sat the saturation capacity µe.sat can be computed:
(14)
For this purpose, it is required to know the inverse function to Eq. (11), i. e., the number
of photons required to reach a given SNR. Inverting Eq. (11) results in
µp(SNR) =
SNR2
2η
1 +
q /K 2)
4(σ2
d + σ2
SNR2
.
1 +
In the limit of large and small SNR, this equation approximates to
SNR2
η
SNR
η
µp(SNR) ≈
1 +
q /K 2
d + σ2
σ2
SNR2
σ2
d + σ2
q /K 2 +
SNR2 σ2
d + σ2
q /K 2,
, SNR2 σ2
d + σ2
q /K 2.
,
SNR
2
(15)
(16)
c Copyright EMVA, 2011
7 of 38
�
Standard for Characterization
of Image Sensors and Cameras
Release 3.1, Release Candidate, November 12, 2012
This means that for almost all cameras, i. e., when σ2
threshold can be well approximates by
µp(SNR = 1) = µp.min ≈ 1
η
σ2
d + σ2
q /K 2 +
d + σ2
q /K 2 1, the absolute sensitivity
σy.dark
+
.
(17)
1
2
=
1
η
1
2
K
The ratio of the signal saturation to the absolute sensitivity threshold is defined as the
dynamic range (DR):
3 Dark Current
3.1 Mean and Variance
DR =
µp.sat
µp.min
.
(18)
σ2
d = σ2
d.0 + σ2
therm = σ2
d.0 + µI texp,
to the laws of error propagation, the variance of the dark signal is then given as
The dark signal µd introduced in the previous section, see Eq. (5), is not constant. The
main reason for the dark signal are thermally induced electrons. Therefore, the dark signal
should increase linearly with the exposure time
because the thermally induced electrons are Poisson distributed as the light induced ones
in Eq. (7) with σ2
therm = µtherm. If a camera or sensor has a dark current compensation the
dark current can only be characterized using Eq. (20).
µd = µd.0 + µtherm = µd.0 + µI texp.
(19)
In this equation all quantities are expressed in units of electrons (e−/pixel). These values
can be obtained by dividing the measured values in the units DN by the overall system gain
K (Eq. (9)).
The quantity µI is named the dark current, given in the units e−/(pixel s). According
R elease
C andidate
The temperature dependence of the dark current is modeled in a simplified form. Because
of the thermal generation of charge units, the dark current increases roughly exponentially
with the temperature [4, 5, 11]. This can be expressed by
µI = µI.ref · 2(T−Tref)/Td .
(21)
The constant Td has units K or ◦C and indicates the temperature interval that causes a
doubling of the dark current. The temperature Tref is a reference temperature at which all
other EMVA 1288 measurements are performed and µI.ref the dark current at the reference
temperature. The measurement of the temperature dependency of the dark current is the
only measurement to be performed at different ambient temperatures, because it is the only
camera parameter with a strong temperature dependence.
3.2 Temperature Dependence
(20)
4 Spatial Nonuniformity and Defect Pixels
The model discussed so far considered only a single pixel. All parameters of an array of
pixels, will however vary from pixel to pixel. Sometimes these nonuniformities are called
fixed pattern noise, or FPN. This expression is however misleading, because inhomogeneities
are no noise, which makes the signal varying in time. The inhomogeneity may only be
distributed randomly. Therefore it is better to name this effect nonuniformity.
Essentially there are two basic nonuniformities. First, the dark signal can vary from pixel
to pixel. This effect is called dark signal nonuniformity, abbreviated by DSNU. Second, the
variation of the sensitivity is called photo response nonuniformity, abbreviated by PRNU.
The EMVA 1288 standard describes nonuniformities in three different ways. The spatial
variance (Section 4.1) is a simply overall measure of the spatial nonuniformity. The spectro-
gram method (Section 4.2) offers a way to analyze patterns or periodic spatial variations,
8 of 38
c Copyright EMVA, 2011
�



 2023年江西萍乡中考道德与法治真题及答案.doc
 2012年重庆南川中考生物真题及答案.doc
 2013年江西师范大学地理学综合及文艺理论基础考研真题.doc
 2020年四川甘孜小升初语文真题及答案I卷.doc
 2020年注册岩土工程师专业基础考试真题及答案.doc
 2023-2024学年福建省厦门市九年级上学期数学月考试题及答案.doc
 2021-2022学年辽宁省沈阳市大东区九年级上学期语文期末试题及答案.doc
 2022-2023学年北京东城区初三第一学期物理期末试卷及答案.doc
 2018上半年江西教师资格初中地理学科知识与教学能力真题及答案.doc
 2012年河北国家公务员申论考试真题及答案-省级.doc
 2020-2021学年江苏省扬州市江都区邵樊片九年级上学期数学第一次质量检测试题及答案.doc
 2022下半年黑龙江教师资格证中学综合素质真题及答案.doc