Communications and Network, 2018, 10, 196-210
http://www.scirp.org/journal/cn
ISSN Online: 1947-3826
ISSN Print: 1949-2421
Analysis and Simulink Modeling of the
Performance of Dynamic Web Server Using JSP
and PHP
Fontaine Rafamantanantsoa*, Paulson Ravomampiandra
University of Fianarantsoa, Fianarantsoa, Madagascar
How to cite this paper: Rafamantanant-
soa, F. and Ravomampiandra, P. (2018)
Analysis and Simulink Modeling of the
Performance of Dynamic Web Server Us-
ing JSP and PHP. Communications and
Network, 10, 196-210.
https://doi.org/10.4236/cn.2018.104016
Received: August 14, 2018
Accepted: November 9, 2018
Published: November 12, 2018
Copyright © 2018 by authors and
Scientific Research Publishing Inc.
This work is licensed under the Creative
Commons Attribution International
License (CC BY 4.0).
http://creativecommons.org/licenses/by/4.0/
Open Access
Abstract
In recent years, web technology carried on growing and at same time, the
number of internet users increased significantly in number. Today, a Web
server is capable of processing millions of requests per day, but during the
peak period may collapse and becomes critical causing unavailability of the
services offered by the servers. That is why Web server performance is a topic
of great interest to many researchers. In this paper, we evaluate experimen-
tally the impact of JSP and PHP dynamic content technology: JSP and PHP
with access to a database of performance data of Apache Web server. Using
the “ApacheBench” performance measurement tool, the approach is to com-
pare the performances of four different configurations of a Web server, such
as: Apache Web server implementing JSP technology with access to Post-
greSQL database, Apache using PHP technology with the PostgreSQL as da-
tabase, Apache Web server using the JSP technology with access to MySQL
database, finally Apache and PHP with DBMS MySQL. At the end of this ar-
ticle, we also present a Simulink model of Web server performance based on
the simple M/M/1 queue. During the modeling, the MATLAB software was
used.
Keywords
Analysis, Queue, JSP, Model, Performances Evaluation, PHP, Web Server,
Simulink
1. Introduction
In the recent decades, the number of internet users did not cease to increase.
According to some studies, statistics of users connected to the internet have ris-
en more than 2.3 billion in 2012 in comparison with the number of inhabitants
DOI: 10.4236/cn.2018.104016 Nov. 12, 2018
196
Communications and Network
�
F. Rafamantanantsoa, P. Ravomampiandra
of the world close to 7 billion; one third of the population is connected to the
Internet. In November 2012, a Netcraft survey counted 625,329,303 active web-
sites worldwide. Even though web servers are now able to handle millions of re-
quests per day, during the peak period its performance can collapse and become
critical. This rough location users thus despreciate the quality of service offered
by the servers. Therefore, many researchers have conducted studies on the per-
formance of the computer systems, namely: direct measurement, simulation and
modeling. Direct measuring is an exact method but it requires a real system to
collect specific information about the metrics of system performance. Simulation
is the prototype of the real system and can provide performance measurement
with more or less accurate results but can be difficult to build. As for the model-
ing, we used techniques such as: network queue, the Markov model, the Petri
Nets and the neural network. Modeling is the cheapest method because now
personal computer hardware is more unaffordable.
These three methods are also used by various researchers who have addressed
their studies on Web server performance. In [1] and [2], the authors considered
respectively the queue M/G/1/K*PS and M/M/1/K to evaluate the performance
of the Web server. During their work, they studied the impact of parameters
such as: traffic arrivals and the service discipline on performance metrics such as
average Web response time, throughput and rate of server rejection. Other re-
searchers such as R. Fontaine et al. [3] have modeled the performance of Apa-
cheWeb servers using other methods, namely Neural Networks. For this, three
models of neural networks were used to predict the performance metrics of the
Web server, such as average response time, the percentage of rejection and flow
depending on the optimization of system kernel parameters FreeBSD, Apache
and inbound traffic, using the propagation algorithm of the gradient. In 2011,
[4] has taken the same work but the operating systems they used was Debian and
Ubuntu Linux 9.4. Numerous research focuses on the analysis and design of the
Web server to identify the elements that make up the bottleneck. In [5], Rafa-
mantanantsoa and Aussem have used Webstone to analyze performance of the
Apache Web Server. They studied the different factors which can influence serv-
er performance such as: Apache optimization parameters (Maxclients, Max-
Users) and the FreeBSD operating system (e.g. Somaxconn). At the end of this
paper, they proposed a simple model based on the queue that represents the be-
havior of the saturated Web server using the Mean Value Analysis (MVA) algo-
rithm. Hu et al. also measured and analyzed the behavior of Apache. The au-
thors used the benchmark tool SpecWeb96 and Webstone to evaluate the beha-
vior of a Web server on the system uniprocessor and multiprocessor (4-CPU
SMP (Symmetric Multiprocessor)).
More recently, Xiao and Dohi [6] evaluated quantitatively Apache perfor-
mance using the Apache JMeter tool. Specifically, they focus on the relationship
between the error rate of the Apache Web server and system parameters that can
influence the performance of Apache.
The works we have presented above focus only on the use of static workload,
197
Communications and Network
DOI: 10.4236/cn.2018.104016
�
F. Rafamantanantsoa, P. Ravomampiandra
but the evolution of the internet has led other researchers to consider workload
based on dynamic Web pages. Trent et al. [7], in their works, they focus on the
comparison of dynamic languages PHP and JSP script using SPECWeb2005 on
Lighttpd and Apache Web servers. Their results showed that there is only 5% -
10% difference in speed and performance between these two technologies.
In 2012, Aaqib and Sharma [8] measured the performance of Apache imple-
menting PERL, PHP and Java Servlet technology and using a MySQL database.
Their goal was to determine which of these three technologies gives better results
on Windows and Linux platforms. Their results showed that the performance
obtained with PHP is much better than when they used PERL and Java Servlets.
A multiple linear regression model they developed was used to predict the per-
formance of the Web server to validate their results. In this paper we will analyze
and model the performance of the Apache Web server combined with JSP and
PHP technology. This article is divided into four sections. Section 1 is for the
presentation of the performance metric of the Web server. The experimental
configurations will be given in Section 2. Then the third section will show the
results of the various experiments. And it is in that last section model on server
performance will be offered.
2. Web Server Performance
A web server is a system processing many types of client requests which progress
simultaneously. These queries can be directed to static files of different sizes,
dynamic web pages, CGI commands or access to databases through various APIs.
The processing of these requests by the server is different with respect to others.
So, the processing time of a query depends on the complexity of an application, the
document size and the speed of the server. The latter also depends on the hard-
ware (CPU, RAM…) and configuration software that make up the server.
To measure the performances of a web server, the units of measurement
known performance metrics or performance indexes are used. These are key in-
dicators that describe the quantitative behavior of a Web server. These indices
may vary depending on the type, nature, the Web server configuration studied.
Among the performance metric, the base units of measures for the performance
of a Web server are:
Response time: this value shows the average execution time of an application,
that is to say, the time after the client sends a request until it gets a response
from the server;
Number of requests processed per second: is a measure of the number of
requests managed by a Web server for a period of time;
Number of errors: applications rejected by the server due to a large number
of requests received.
3. Performance Evaluation Methodology
As part of our study, we examine four different configurations of the Web server
198
Communications and Network
DOI: 10.4236/cn.2018.104016
�
F. Rafamantanantsoa, P. Ravomampiandra
for each experiment. Figure 1 show the various configurations during experi-
mentation.
First, we send queries on dynamic Web pages with the extension *.jspor *.php.
Each HTTP request causes a SQL SELECT command to retrieve data from the
database PostgreSQL or MySQL. Next, we varied the size of data to be retrieved
from the database so that we can determine the impact of the size of data on
server performance. For each configuration we have shown in Figure 1, we vary
the size of data to get 20, 40, 60, 80 and 100 bytes. PostgreSQL and MySQL da-
tabase each has a single table with four columns.
We notice that we only use the SQL SELECT command during our experi-
ment. We did not use any other SQL commands such as INSERT, UPDATE and
DELETE because most of the time, Web users consult only the various docu-
ments that the Web services provide them.
The characteristics of the dynamic workload that we used during the experi-
ments are presented in Table 1.
4. Experimental Environment
During the experiment we used two machines, a machine that acts as a server
and another client device that generates requests to the server. The server and
the client machine are interconnected by a crossover cable RJ45. The rest of this
section provides a description of details of this experimental environment. Sec-
tion 4.1 shows the hardware configuration of our experimental environment and
Section 4.2 presents the software we used.
4.1. Hardware Requirements
The client machine that we used is a Dell machine with a single Intel Pentium IV
processor, 256 MB of RAM and 20 GB IDE hard drive. As for the server ma-
chine, an Acer brand with Intel Core i5 processor with 8 GB of RAM and a 1 TB
SATA hard drive. Note that the server machine is not a dedicated Web server; it
is a system where Apache is running in dual boot with Windows 7. Table 2
summarizes the configuration of the server and client machine used during the
experiment.
4.2. Software Configuration
We used a Pear Linux OS8 distribution as the operating system for server and
Debian 6 for the customer. We used the default kernel parameters of the Linux.
Also the configuration of the operating systems was left at their default values.
Table 3 gives a summary of the various software used lasting the experiments.
For all software used, setup optimizations are left at their defaults values.
4.3. Experiments Setup
Figure 2 shows the experimental setup used to obtain the data used to model
Apache Web server performances.
199
Communications and Network
DOI: 10.4236/cn.2018.104016
�
F. Rafamantanantsoa, P. Ravomampiandra
Table 1. Workload during the experiments.
Specification
Number of files
Total size of files
Total data size in
PgSQL and MySQL
JSP
16
5 Mo
Workload
600 Octets
PHP
16
5 Mo
Table 2. Characteristics of materials used.
Processor
Main memory
Hard disk
Server
Intel Core i5
8 Go
50 Go
Table 3. Characteristics of software used.
Operating system
Web server
RDBMS
Tools
Server
Pear Linux OS
Apache2.2
-PostgreSQL
-MySQL
Top
Client
Intel Pentium IV
256 Mo
20 Go
Client
Debian 6
ApacheBench
Figure 1. Performance measurement methodology.
DOI: 10.4236/cn.2018.104016
Figure 2. Experimental setup.
200
Communications and Network
�
F. Rafamantanantsoa, P. Ravomampiandra
E[S] is the average service time of the Web server, that is to say the time be-
tween the arrival of a client request to the server and the time the server is ready
to send the response to the client. E[S] can be calculated by taking the difference
between the output of the response time of a query and the arrival time of the
request on the server.
The course of the experiments is as follows: the requests are sent from the
machine where the tool developed in Python and Scapy is installed. The request
comes on the first network interface with the IP address 192.168.1.151. The Web
server receives on its first network interface with 192.168.1.150 as IP address.
Once the request has been processed, the response will be returned to the client
via the second server network interface with the IP address 192.168.2.150 and
the client machine receives this response on its second network interface with
the IP address 192.168.2.151.
We used the same materials as in the previous sections. A series of experi-
ments were conducted to collect the performance metrics of Apache Web server
with supported JSP technology and with database access. In this section, we have
not used the ApacheBench tool, but we developed a performance measurement
tool of the Web server using the Python programming language and network
packet manipulation software called Scapy.
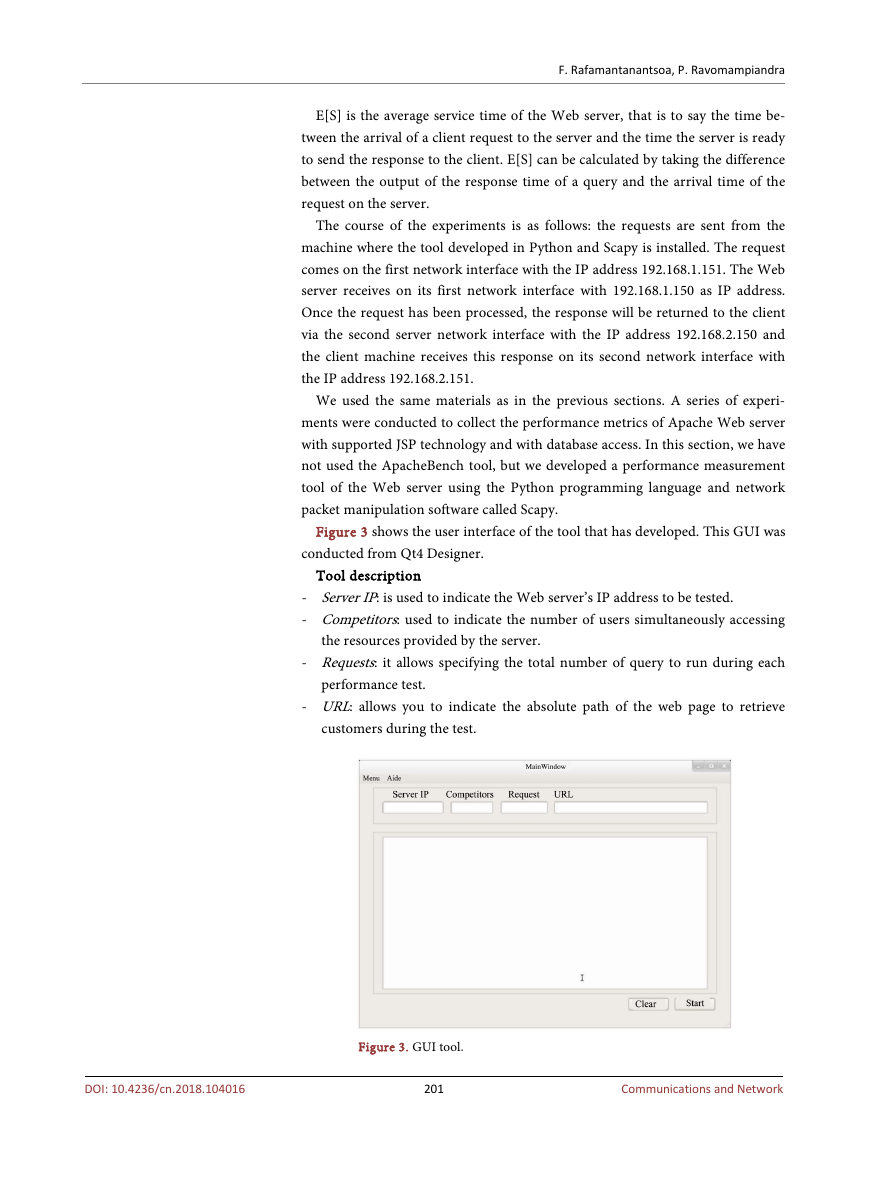
Figure 3 shows the user interface of the tool that has developed. This GUI was
conducted from Qt4 Designer.
Tool description
- Server IP: is used to indicate the Web server’s IP address to be tested.
- Competitors: used to indicate the number of users simultaneously accessing
the resources provided by the server.
- Requests: it allows specifying the total number of query to run during each
performance test.
- URL: allows you to indicate the absolute path of the web page to retrieve
customers during the test.
DOI: 10.4236/cn.2018.104016
Figure 3. GUI tool.
201
Communications and Network
�
F. Rafamantanantsoa, P. Ravomampiandra
The Start button is used to start the Web server performance test. And as for
the Clear button, it is used to clear the display area of the results of experiments.
We used this tool to run performance tests. The size of the document was va-
ried from 20 to 100 bytes in steps of 20. And for each value, the tool retrieves
metrics on Web server performance. As a result of the test, is particularly useful
in measuring the time of E[S] of the server.
5. Experimental Results
A series of tests were performed to measure and then examine the performance
of the Web server. The various test consisted of ApacheBench running on client
machines with the workload shown in Table 1 after each test, the ApacheBench
tool collects statistics on various performance metrics such as average response
time, the number of errors.
The “top” tool for Linux allows monitoring system resources on the server
machine. The monitoring resources are: memory and the CPU.
For each experiment, we will establish the relationship between the data size
and the average response time. To properly organize this section we will
represent the results of the various tests as follows:
Experiment 1: Access to the first column of the databases table.
Experiment 2: Access to the second column of the database table.
Experiment 3: Access to the third column of the database table.
Experiment 4: Access to the fourth column of the database table.
5.1. Experiment 1: Access to the First of the Database Table
The average response time is an important metric of the performance of a Web
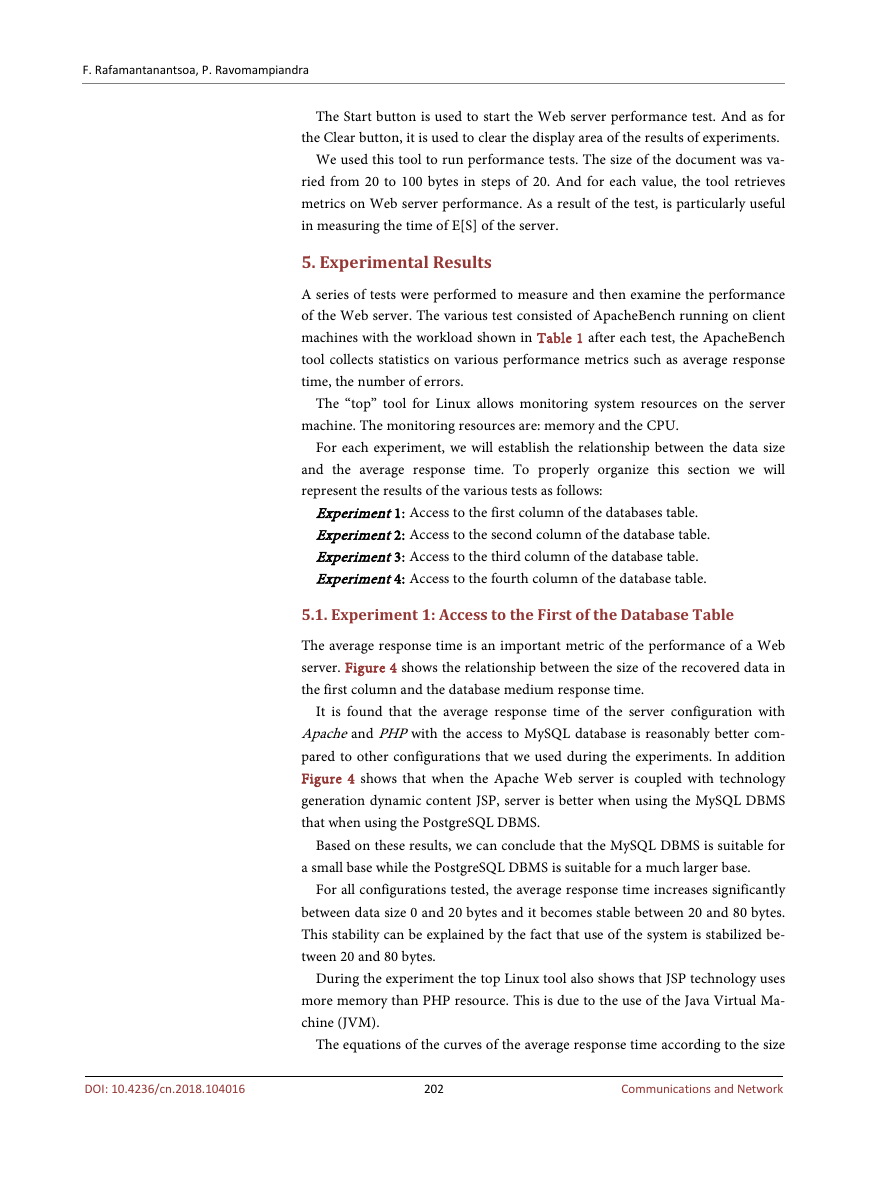
server. Figure 4 shows the relationship between the size of the recovered data in
the first column and the database medium response time.
It is found that the average response time of the server configuration with
Apache and PHP with the access to MySQL database is reasonably better com-
pared to other configurations that we used during the experiments. In addition
Figure 4 shows that when the Apache Web server is coupled with technology
generation dynamic content JSP, server is better when using the MySQL DBMS
that when using the PostgreSQL DBMS.
Based on these results, we can conclude that the MySQL DBMS is suitable for
a small base while the PostgreSQL DBMS is suitable for a much larger base.
For all configurations tested, the average response time increases significantly
between data size 0 and 20 bytes and it becomes stable between 20 and 80 bytes.
This stability can be explained by the fact that use of the system is stabilized be-
tween 20 and 80 bytes.
During the experiment the top Linux tool also shows that JSP technology uses
more memory than PHP resource. This is due to the use of the Java Virtual Ma-
chine (JVM).
The equations of the curves of the average response time according to the size
202
Communications and Network
DOI: 10.4236/cn.2018.104016
�
F. Rafamantanantsoa, P. Ravomampiandra
Figure 4. Average time response depending on the size of the retrieved data in the 1st
column.
of data for Apache and JSP with PostgreSQL, Apache and JSP with the access to
MySQL database, Apache and PHP with the DBMS PostgreSQL, Apache and
PHP with MySQL obtained from MATLAB are respectively as follows:
y
=
0.00056
x
3
−
x
0.1
2
+
6.5
x
+
1.4
(1)
(2)
(3)
(4)
y
=
0.00057
x
3
−
x
0.11
2
+
6.3
x
+
y
=
x
0.00011
3
−
0.019
x
2
+
1.4
x
+
3.5
1.4
y
=
x
0.0021
3
−
0.39
x
2
+
22
x
+
10
5.2. Experiment 2: Access to the Second Column of the Database
Table
Figure 5 shows the results of experiments in the second column of the table of
databases PostgreSQL and MySQL. The recovered data size varies in databases
20, 40, 60, 80 and 100 bytes.
As in the first experiment the configuration Apache Web serverimplementing
PHP with the access to MySQL database gives us better performance than other
configurations. In addition, there is no major difference between the response
times on access to the first column of the table in the database. One can see this
small difference on the equations of the curves obtained from the second expe-
riment (the order of the equations is the same as in the first experiment):
y
=
0.00052
x
3
−
x
0.1
2
+
6.8
x
+
2.9
y
=
0.00052
x
3
−
x
0.11
2
+
6.4
x
+
3.2
(5)
(6)
DOI: 10.4236/cn.2018.104016
203
Communications and Network
�




 2023年江西萍乡中考道德与法治真题及答案.doc
 2012年重庆南川中考生物真题及答案.doc
 2013年江西师范大学地理学综合及文艺理论基础考研真题.doc
 2020年四川甘孜小升初语文真题及答案I卷.doc
 2020年注册岩土工程师专业基础考试真题及答案.doc
 2023-2024学年福建省厦门市九年级上学期数学月考试题及答案.doc
 2021-2022学年辽宁省沈阳市大东区九年级上学期语文期末试题及答案.doc
 2022-2023学年北京东城区初三第一学期物理期末试卷及答案.doc
 2018上半年江西教师资格初中地理学科知识与教学能力真题及答案.doc
 2012年河北国家公务员申论考试真题及答案-省级.doc
 2020-2021学年江苏省扬州市江都区邵樊片九年级上学期数学第一次质量检测试题及答案.doc
 2022下半年黑龙江教师资格证中学综合素质真题及答案.doc