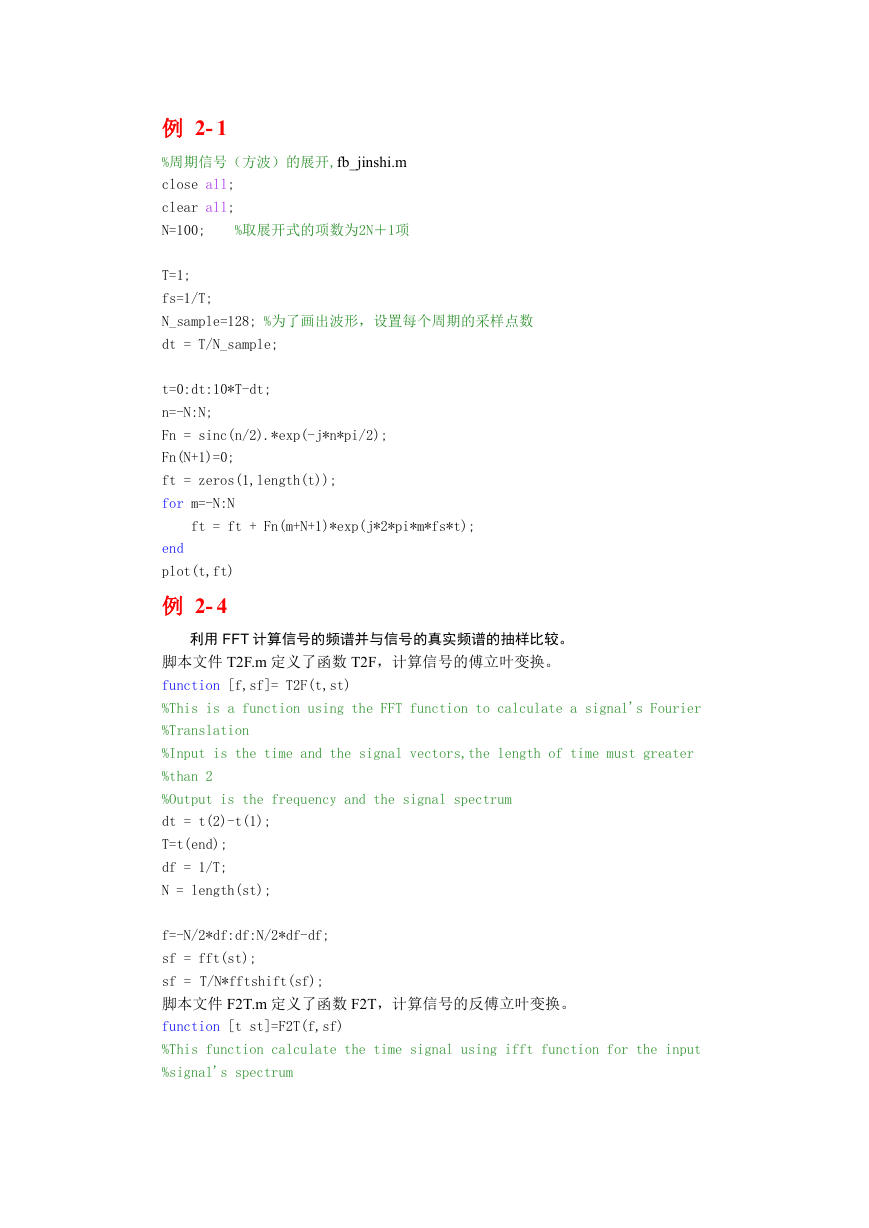
例 2- 1
%周期信号(方波)的展开,fb_jinshi.m
close all;
clear all;
N=100;
%取展开式的项数为2N+1项
T=1;
fs=1/T;
N_sample=128; %为了画出波形,设置每个周期的采样点数
dt = T/N_sample;
t=0:dt:10*T-dt;
n=-N:N;
Fn = sinc(n/2).*exp(-j*n*pi/2);
Fn(N+1)=0;
ft = zeros(1,length(t));
for m=-N:N
ft = ft + Fn(m+N+1)*exp(j*2*pi*m*fs*t);
end
plot(t,ft)
例 2- 4
利用 FFT 计算信号的频谱并与信号的真实频谱的抽样比较。
脚本文件 T2F.m 定义了函数 T2F,计算信号的傅立叶变换。
function [f,sf]= T2F(t,st)
%This is a function using the FFT function to calculate a signal's Fourier
%Translation
%Input is the time and the signal vectors,the length of time must greater
%than 2
%Output is the frequency and the signal spectrum
dt = t(2)-t(1);
T=t(end);
df = 1/T;
N = length(st);
f=-N/2*df:df:N/2*df-df;
sf = fft(st);
sf = T/N*fftshift(sf);
脚本文件 F2T.m 定义了函数 F2T,计算信号的反傅立叶变换。
function [t st]=F2T(f,sf)
%This function calculate the time signal using ifft function for the input
%signal's spectrum
�
df = f(2)-f(1);
Fmx = ( f(end)-f(1) +df);
dt = 1/Fmx;
N = length(sf);
T = dt*N;
%t=-T/2:dt:T/2-dt;
t = 0:dt:T-dt;
sff = fftshift(sf);
st = Fmx*ifft(sff);
另写脚本文件 fb_spec.m 如下:
%方波的傅氏变换, fb_spec.m
clear all;close all;
T=1;
N_sample = 128;
dt=T/N_sample;
t=0:dt:T-dt;
st=[ones(1,N_sample/2), -ones(1,N_sample/2)]; %方波一个周期
subplot(211);
plot(t,st);
axis([0 1 -2 2]);
xlabel('t'); ylabel('s(t)');
subplot(212);
[f sf]=T2F(t,st);
plot(f,abs(sf)); hold on;
axis([-10 10 0 1]);
xlabel('f');ylabel('|S(f)|');
%方波频谱
%根据傅氏变换计算得到的信号频谱相应位置的抽样值
sff= T^2*j*pi*f*0.5.*exp(-j*2*pi*f*T).*sinc(f*T*0.5).*sinc(f*T*0.5);
plot(f,abs(sff),'r-')
例 2- 5
%信号的能量计算或功率计算,sig_pow.m
clear all;
close all;
dt = 0.01;
t = 0:dt:5;
s1 = exp(-5*t).*cos(20*pi*t);
s2 = cos(20*pi*t);
�
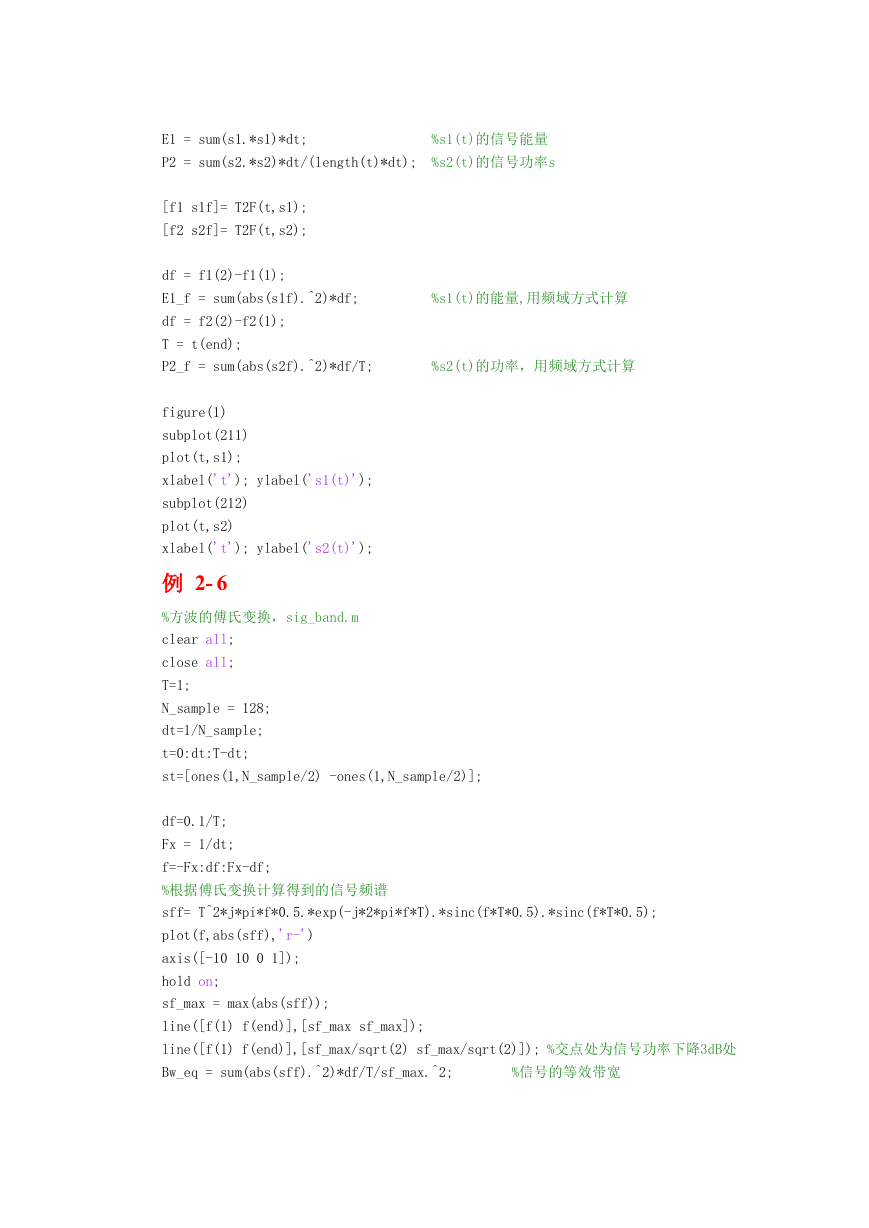
E1 = sum(s1.*s1)*dt;
%s1(t)的信号能量
P2 = sum(s2.*s2)*dt/(length(t)*dt);
%s2(t)的信号功率s
[f1 s1f]= T2F(t,s1);
[f2 s2f]= T2F(t,s2);
df = f1(2)-f1(1);
E1_f = sum(abs(s1f).^2)*df;
%s1(t)的能量,用频域方式计算
df = f2(2)-f2(1);
T = t(end);
P2_f = sum(abs(s2f).^2)*df/T;
%s2(t)的功率,用频域方式计算
figure(1)
subplot(211)
plot(t,s1);
xlabel('t'); ylabel('s1(t)');
subplot(212)
plot(t,s2)
xlabel('t'); ylabel('s2(t)');
例 2- 6
%方波的傅氏变换,sig_band.m
clear all;
close all;
T=1;
N_sample = 128;
dt=1/N_sample;
t=0:dt:T-dt;
st=[ones(1,N_sample/2) -ones(1,N_sample/2)];
df=0.1/T;
Fx = 1/dt;
f=-Fx:df:Fx-df;
%根据傅氏变换计算得到的信号频谱
sff= T^2*j*pi*f*0.5.*exp(-j*2*pi*f*T).*sinc(f*T*0.5).*sinc(f*T*0.5);
plot(f,abs(sff),'r-')
axis([-10 10 0 1]);
hold on;
sf_max = max(abs(sff));
line([f(1) f(end)],[sf_max sf_max]);
line([f(1) f(end)],[sf_max/sqrt(2) sf_max/sqrt(2)]); %交点处为信号功率下降3dB处
Bw_eq = sum(abs(sff).^2)*df/T/sf_max.^2;
%信号的等效带宽
�
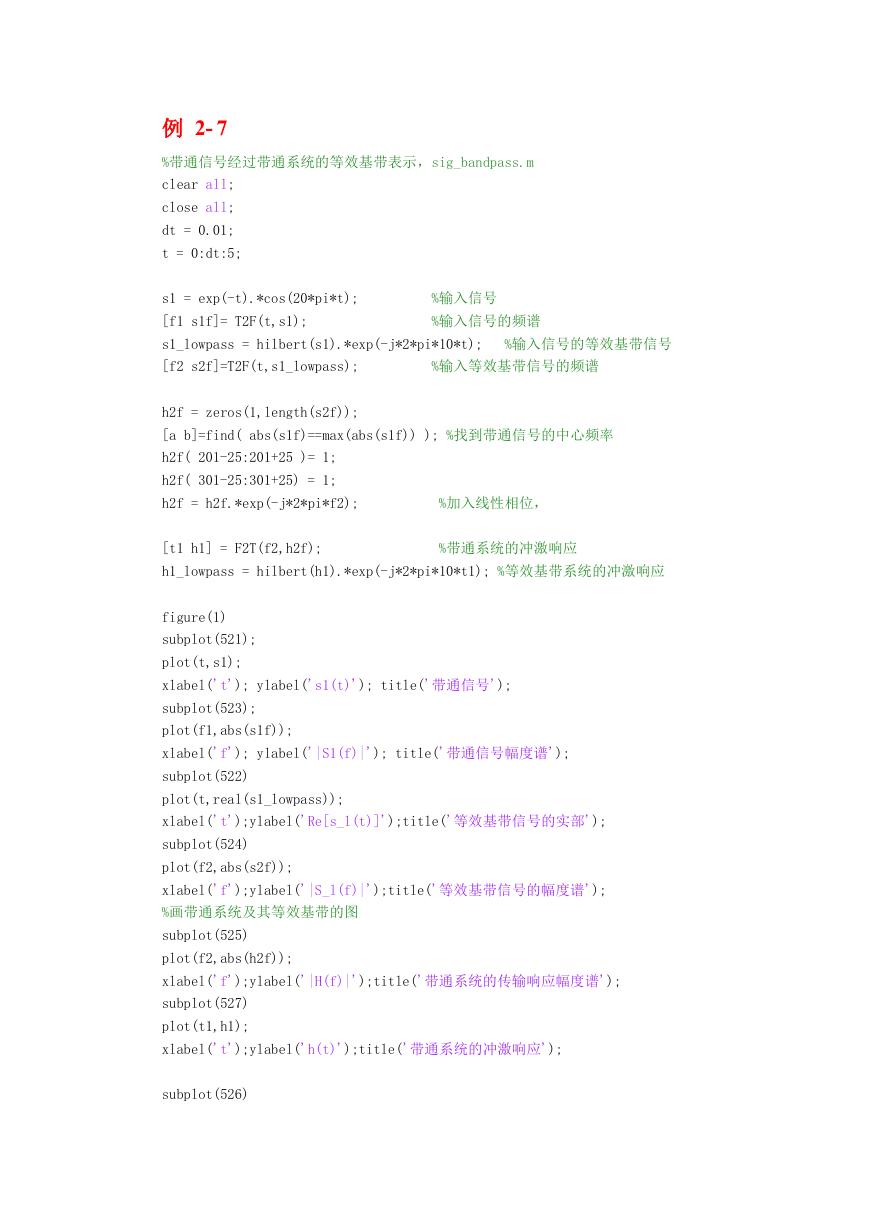
例 2- 7
%带通信号经过带通系统的等效基带表示,sig_bandpass.m
clear all;
close all;
dt = 0.01;
t = 0:dt:5;
s1 = exp(-t).*cos(20*pi*t);
%输入信号
[f1 s1f]= T2F(t,s1);
%输入信号的频谱
s1_lowpass = hilbert(s1).*exp(-j*2*pi*10*t);
%输入信号的等效基带信号
[f2 s2f]=T2F(t,s1_lowpass);
%输入等效基带信号的频谱
h2f = zeros(1,length(s2f));
[a b]=find( abs(s1f)==max(abs(s1f)) ); %找到带通信号的中心频率
h2f( 201-25:201+25 )= 1;
h2f( 301-25:301+25) = 1;
h2f = h2f.*exp(-j*2*pi*f2);
%加入线性相位,
[t1 h1] = F2T(f2,h2f);
%带通系统的冲激响应
h1_lowpass = hilbert(h1).*exp(-j*2*pi*10*t1); %等效基带系统的冲激响应
figure(1)
subplot(521);
plot(t,s1);
xlabel('t'); ylabel('s1(t)'); title('带通信号');
subplot(523);
plot(f1,abs(s1f));
xlabel('f'); ylabel('|S1(f)|'); title('带通信号幅度谱');
subplot(522)
plot(t,real(s1_lowpass));
xlabel('t');ylabel('Re[s_l(t)]');title('等效基带信号的实部');
subplot(524)
plot(f2,abs(s2f));
xlabel('f');ylabel('|S_l(f)|');title('等效基带信号的幅度谱');
%画带通系统及其等效基带的图
subplot(525)
plot(f2,abs(h2f));
xlabel('f');ylabel('|H(f)|');title('带通系统的传输响应幅度谱');
subplot(527)
plot(t1,h1);
xlabel('t');ylabel('h(t)');title('带通系统的冲激响应');
subplot(526)
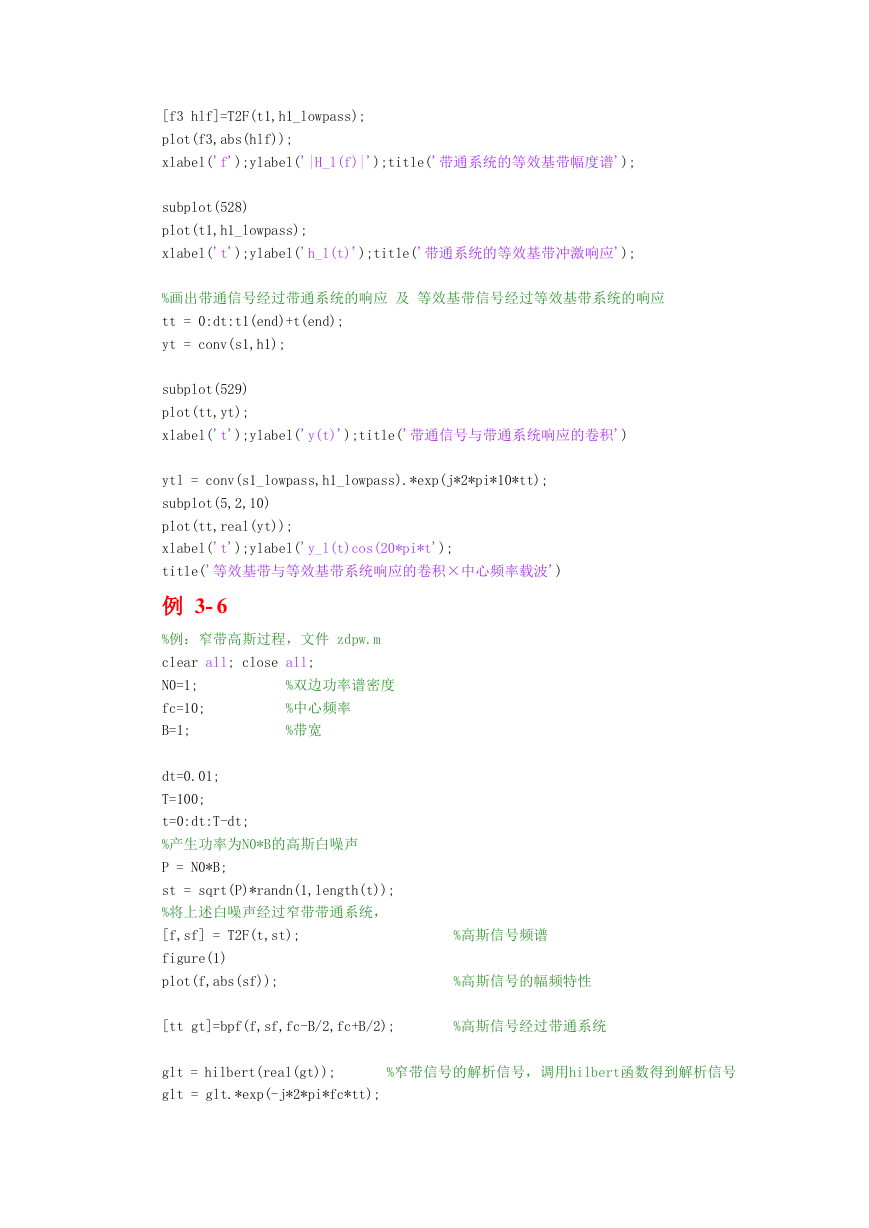
�
[f3 hlf]=T2F(t1,h1_lowpass);
plot(f3,abs(hlf));
xlabel('f');ylabel('|H_l(f)|');title('带通系统的等效基带幅度谱');
subplot(528)
plot(t1,h1_lowpass);
xlabel('t');ylabel('h_l(t)');title('带通系统的等效基带冲激响应');
%画出带通信号经过带通系统的响应 及 等效基带信号经过等效基带系统的响应
tt = 0:dt:t1(end)+t(end);
yt = conv(s1,h1);
subplot(529)
plot(tt,yt);
xlabel('t');ylabel('y(t)');title('带通信号与带通系统响应的卷积')
ytl = conv(s1_lowpass,h1_lowpass).*exp(j*2*pi*10*tt);
subplot(5,2,10)
plot(tt,real(yt));
xlabel('t');ylabel('y_l(t)cos(20*pi*t');
title('等效基带与等效基带系统响应的卷积×中心频率载波')
例 3- 6
%例:窄带高斯过程,文件 zdpw.m
clear all; close all;
N0=1;
fc=10;
B=1;
%双边功率谱密度
%中心频率
%带宽
dt=0.01;
T=100;
t=0:dt:T-dt;
%产生功率为N0*B的高斯白噪声
P = N0*B;
st = sqrt(P)*randn(1,length(t));
%将上述白噪声经过窄带带通系统,
[f,sf] = T2F(t,st);
figure(1)
plot(f,abs(sf));
%高斯信号频谱
%高斯信号的幅频特性
[tt gt]=bpf(f,sf,fc-B/2,fc+B/2);
%高斯信号经过带通系统
glt = hilbert(real(gt));
%窄带信号的解析信号,调用hilbert函数得到解析信号
glt = glt.*exp(-j*2*pi*fc*tt);
�
[ff,glf]=T2F( tt, glt );
figure(2)
plot(ff,abs(glf));
xlabel('频率(Hz)'); ylabel('窄带高斯过程样本的幅频特性')
figure(3)
subplot(411);
plot(tt,real(gt));
title('窄带高斯过程样本')
subplot(412)
plot(tt,real(glt).*cos(2*pi*fc*tt)-imag(glt).*sin(2*pi*fc*tt))
title('由等效基带重构的窄带高斯过程样本')
subplot(413)
plot(tt,real(glt));
title('窄带高斯过程样本的同相分量')
subplot(414)
plot(tt,imag(glt));
xlabel('时间t(秒)'); title('窄带高斯过程样本的正交分量')
%求窄带高斯信号功率;注:由于样本的功率近似等于随机过程的功率,因此可能出现一些
偏差
P_gt=sum(real(gt).^2)/T;
P_glt_real = sum(real(glt).^2)/T;
P_glt_imag = sum(imag(glt).^2)/T;
%验证窄带高斯过程的同相分量、正交分量的正交性
a = real(glt)*(imag(glt))'/T;
用到的子函数
function [t,st]=bpf(f,sf,B1,B2)
%This function filter an input at frequency domain by an ideal bandpass filter
%Inputs:
%
%
%
%
f:
frequency samples
sf: input data spectrum samples
B1: bandpass's lower frequency
B2: bandpass's higher frequency
%Outputs:
%
%
t: frequency samples
st: output data's time samples
df = f(2)-f(1);
T = 1/df;
hf = zeros(1,length(f));
bf = [floor( B1/df ): floor( B2/df )] ;
�
bf1 = floor( length(f)/2 ) + bf;
bf2 = floor( length(f)/2 ) - bf;
hf(bf1)=1/sqrt(2*(B2-B1));
hf(bf2)=1/sqrt(2*(B2-B1));
yf=hf.*sf.*exp(-j*2*pi*f*0.1*T);
[t,st]=F2T(f,yf);
例 4- 1
%显示模拟调制的波形及解调方法DSB,文件mdsb.m
%信源
close all;
clear all;
dt = 0.001;
fm=1;
fc=10;
T=5;
t = 0:dt:T;
%时间采样间隔
%信源最高频率
%载波中心频率
%信号时长
mt = sqrt(2)*cos(2*pi*fm*t);
%信源
%N0 = 0.01;
%白噪单边功率谱密度
%DSB modulation
s_dsb = mt.*cos(2*pi*fc*t);
B=2*fm;
%noise = noise_nb(fc,B,N0,t);
%s_dsb=s_dsb+noise;
figure(1)
subplot(311)
plot(t,s_dsb);hold on;
%画出DSB信号波形
plot(t,mt,'r--');
%标示mt的波形
title('DSB调制信号');
xlabel('t');
%DSB demodulation
rt = s_dsb.*cos(2*pi*fc*t);
rt = rt-mean(rt);
[f,rf] = T2F(t,rt);
[t,rt] = lpf(f,rf,2*fm);
subplot(312)
plot(t,rt); hold on;
plot(t,mt/2,'r--');
title('相干解调后的信号波形与输入信号的比较');
xlabel('t')
subplot(313)
[f,sf]=T2F(t,s_dsb);
psf = (abs(sf).^2)/T;
�
plot(f,psf);
axis([-2*fc 2*fc 0 max(psf)]);
title('DSB信号功率谱');
xlabel('f');
function [t st]=lpf(f,sf,B)
%This function filter an input data using a lowpass filter
%Inputs: f:
frequency samples
%
%
sf: input data spectrum samples
B:
lowpass's bandwidth with a rectangle lowpass
%Outputs:
t: time samples
%
st: output data's time samples
df = f(2)-f(1);
T = 1/df;
hf = zeros(1,length(f));
bf = [-floor( B/df ): floor( B/df )] + floor( length(f)/2 );
hf(bf)=1;
yf=hf.*sf;
[t,st]=F2T(f,yf);
st = real(st);
例 4- 2
%显示模拟调制的波形及解调方法 AM,文件 mam.m
%信源
close all;
clear all;
dt = 0.001;
fm=1;
fc=10;
T=5;
t = 0:dt:T;
%时间采样间隔
%信源最高频率
%载波中心频率
%信号时长
mt = sqrt(2)*cos(2*pi*fm*t);
%信源
%N0 = 0.01;
%白噪单边功率谱密度
%AM modulation
A=2;
s_am = (A+mt).*cos(2*pi*fc*t);
B = 2*fm;
%带通滤波器带宽
%noise = noise_nb(fc,B,N0,t);
%窄带高斯噪声产生
%s_am = s_am + noise;
figure(1)
subplot(311)
plot(t,s_am);hold on;
%画出AM信号波形
plot(t,A+mt,'r--');
%标示AM的包络
�



 2023年江西萍乡中考道德与法治真题及答案.doc
 2012年重庆南川中考生物真题及答案.doc
 2013年江西师范大学地理学综合及文艺理论基础考研真题.doc
 2020年四川甘孜小升初语文真题及答案I卷.doc
 2020年注册岩土工程师专业基础考试真题及答案.doc
 2023-2024学年福建省厦门市九年级上学期数学月考试题及答案.doc
 2021-2022学年辽宁省沈阳市大东区九年级上学期语文期末试题及答案.doc
 2022-2023学年北京东城区初三第一学期物理期末试卷及答案.doc
 2018上半年江西教师资格初中地理学科知识与教学能力真题及答案.doc
 2012年河北国家公务员申论考试真题及答案-省级.doc
 2020-2021学年江苏省扬州市江都区邵樊片九年级上学期数学第一次质量检测试题及答案.doc
 2022下半年黑龙江教师资格证中学综合素质真题及答案.doc