logo资料库

Scipy Lecture Notes.pdf

第1页 / 共367页
第2页 / 共367页
第3页 / 共367页
第4页 / 共367页
第5页 / 共367页
第6页 / 共367页
第7页 / 共367页
第8页 / 共367页
资料共367页,剩余部分请下载后查看
I Getting started with Python for science
Scientific computing with tools and workflow
Why Python?
Scientific Python building blocks
The interactive workflow: IPython and a text editor
The Python language
First steps
Basic types
Control Flow
Defining functions
Reusing code: scripts and modules
Input and Output
Standard Library
Exception handling in Python
Object-oriented programming (OOP)
NumPy: creating and manipulating numerical data
The Numpy array object
Numerical operations on arrays
More elaborate arrays
Advanced operations
Some exercises
Matplotlib: plotting
Introduction
Simple plot
Figures, Subplots, Axes and Ticks
Other Types of Plots: examples and exercises
Beyond this tutorial
Quick references
Scipy : high-level scientific computing
File input/output: scipy.io
Special functions: scipy.special
Linear algebra operations: scipy.linalg
Fast Fourier transforms: scipy.fftpack
Optimization and fit: scipy.optimize
Statistics and random numbers: scipy.stats
Interpolation: scipy.interpolate
Numerical integration: scipy.integrate
Signal processing: scipy.signal
Image processing: scipy.ndimage
Summary exercises on scientific computing
Getting help and finding documentation
II Advanced topics
Advanced Python Constructs
Iterators, generator expressions and generators
Decorators
Context managers
Advanced Numpy
Life of ndarray
Universal functions
Interoperability features
Array siblings: chararray, maskedarray, matrix
Summary
Contributing to Numpy/Scipy
Debugging code
Avoiding bugs
Debugging workflow
Using the Python debugger
Debugging segmentation faults using gdb
Optimizing code
Optimization workflow
Profiling Python code
Making code go faster
Writing faster numerical code
Sparse Matrices in SciPy
Introduction
Storage Schemes
Linear System Solvers
Other Interesting Packages
Image manipulation and processing using Numpy and Scipy
Opening and writing to image files
Displaying images
Basic manipulations
Image filtering
Feature extraction
Measuring objects properties: ndimage.measurements
Mathematical optimization: finding minima of functions
Knowing your problem
A review of the different optimizers
Practical guide to optimization with scipy
Special case: non-linear least-squares
Optimization with constraints
Interfacing with C
Introduction
Python-C-Api
Ctypes
SWIG
Cython
Summary
Further Reading and References
Exercises
III Packages and applications
Statistics in Python
Data representation and interaction
Hypothesis testing: comparing two groups
Linear models, multiple factors, and analysis of variance
More visualization: seaborn for statistical exploration
Testing for interactions
Sympy : Symbolic Mathematics in Python
First Steps with SymPy
Algebraic manipulations
Calculus
Equation solving
Linear Algebra
Scikit-image: image processing
Introduction and concepts
Input/output, data types and colorspaces
Image preprocessing / enhancement
Image segmentation
Measuring regions' properties
Data visualization and interaction
Feature extraction for computer vision
Traits: building interactive dialogs
Introduction
Example
What are Traits
3D plotting with Mayavi
Mlab: the scripting interface
Interactive work
Slicing and dicing data: sources, modules and filters
Animating the data
Making interactive dialogs
Putting it together
scikit-learn: machine learning in Python
Loading an example dataset
Classification
Clustering: grouping observations together
Dimension Reduction with Principal Component Analysis
Putting it all together: face recognition
Linear model: from regression to sparsity
Model selection: choosing estimators and their parameters
Index
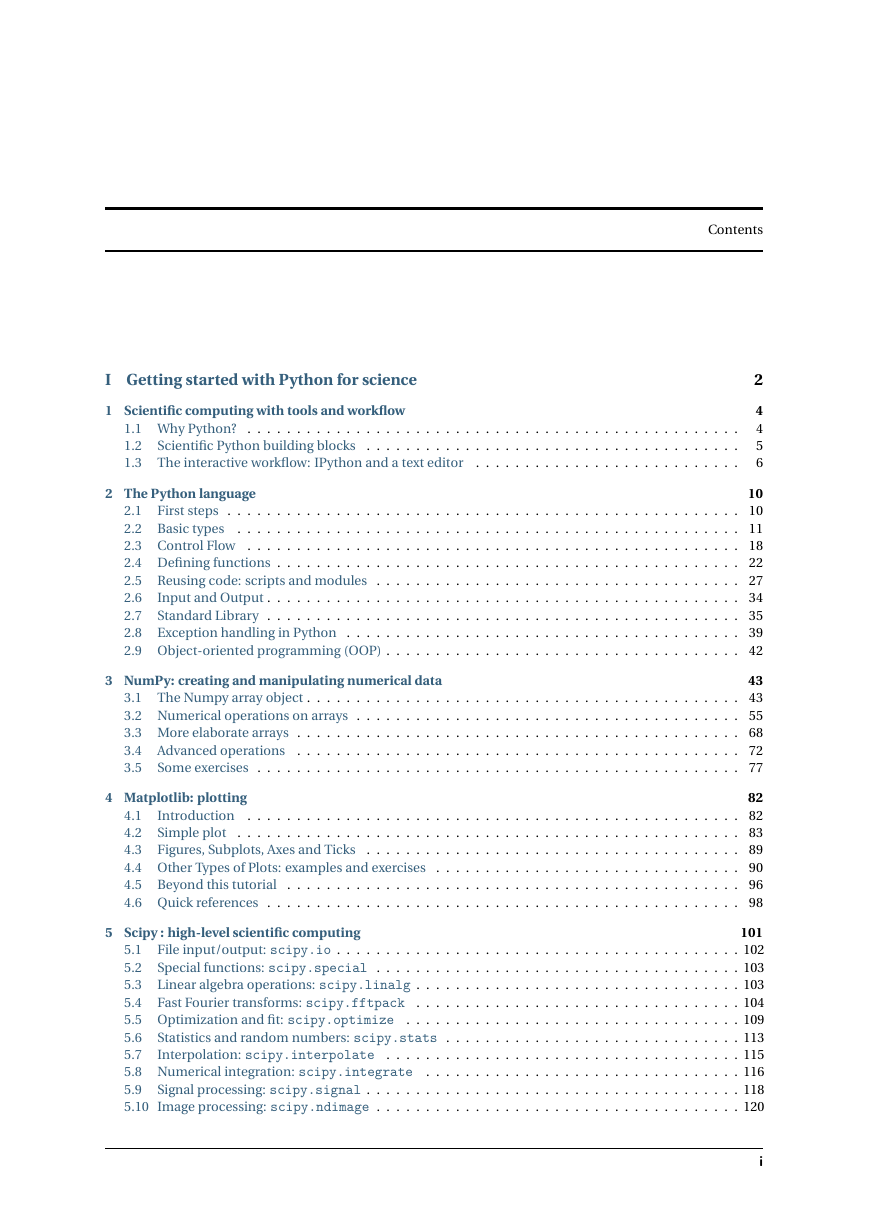
PythonMatplotlibSciKitsNumpySciPyIPythonIP[y]:Cython2015EDITIONEdited byGaël VaroquauxEmmanuelle GouillartOlaf VahtrasScipyLecture Noteswww.scipy-lectures.orgGaël Varoquaux • Emmanuelle Gouillart • Olav VahtrasValentin Haenel • Nicolas P. Rougier • Ralf GommersFabian Pedregosa • Zbigniew Jędrzejewski-Szmek • Pauli VirtanenChristophe Combelles • Didrik Pinte • Robert CimrmanAndré Espaze • Adrian Chauve • Christopher Burns
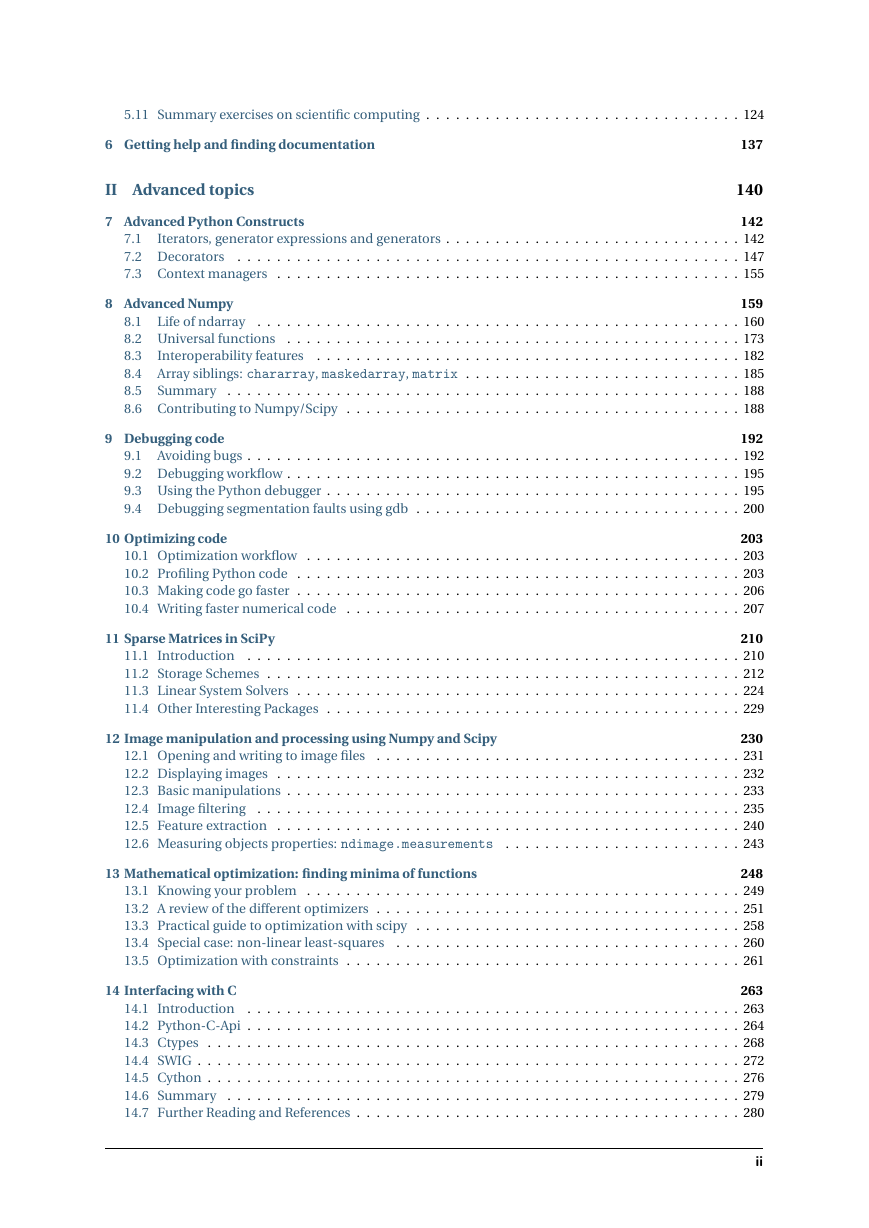
Contents I Getting started with Python for science 1 Scientific computing with tools and workflow 1.1 Why Python? 1.2 1.3 The interactive workflow: IPython and a text editor . . . . . . . . . . . . . . . . . . . . . . . . . . . . . . . . . . . . . . . . . . . . . . . . . . Scientific Python building blocks . . . . . . . . . . . . . . . . . . . . . . . . . . . . . . . . . . . . . . . . . . . . . . . . . . . . . . . . . . . . . . . . . 2 4 4 5 6 2 The Python language 10 First steps . . . . . . . . . . . . . . . . . . . . . . . . . . . . . . . . . . . . . . . . . . . . . . . . . . . . 10 2.1 2.2 Basic types . . . . . . . . . . . . . . . . . . . . . . . . . . . . . . . . . . . . . . . . . . . . . . . . . . . 11 2.3 Control Flow . . . . . . . . . . . . . . . . . . . . . . . . . . . . . . . . . . . . . . . . . . . . . . . . . . 18 2.4 Defining functions . . . . . . . . . . . . . . . . . . . . . . . . . . . . . . . . . . . . . . . . . . . . . . . 22 2.5 Reusing code: scripts and modules . . . . . . . . . . . . . . . . . . . . . . . . . . . . . . . . . . . . . 27 Input and Output . . . . . . . . . . . . . . . . . . . . . . . . . . . . . . . . . . . . . . . . . . . . . . . . 34 2.6 2.7 Standard Library . . . . . . . . . . . . . . . . . . . . . . . . . . . . . . . . . . . . . . . . . . . . . . . . 35 2.8 Exception handling in Python . . . . . . . . . . . . . . . . . . . . . . . . . . . . . . . . . . . . . . . . 39 2.9 Object-oriented programming (OOP) . . . . . . . . . . . . . . . . . . . . . . . . . . . . . . . . . . . . 42 3 NumPy: creating and manipulating numerical data 43 3.1 The Numpy array object . . . . . . . . . . . . . . . . . . . . . . . . . . . . . . . . . . . . . . . . . . . . 43 3.2 Numerical operations on arrays . . . . . . . . . . . . . . . . . . . . . . . . . . . . . . . . . . . . . . . 55 3.3 More elaborate arrays . . . . . . . . . . . . . . . . . . . . . . . . . . . . . . . . . . . . . . . . . . . . . 68 3.4 Advanced operations . . . . . . . . . . . . . . . . . . . . . . . . . . . . . . . . . . . . . . . . . . . . . 72 Some exercises . . . . . . . . . . . . . . . . . . . . . . . . . . . . . . . . . . . . . . . . . . . . . . . . . 77 3.5 4 Matplotlib: plotting 82 4.1 Introduction . . . . . . . . . . . . . . . . . . . . . . . . . . . . . . . . . . . . . . . . . . . . . . . . . . 82 4.2 Simple plot . . . . . . . . . . . . . . . . . . . . . . . . . . . . . . . . . . . . . . . . . . . . . . . . . . . 83 4.3 Figures, Subplots, Axes and Ticks . . . . . . . . . . . . . . . . . . . . . . . . . . . . . . . . . . . . . . 89 4.4 Other Types of Plots: examples and exercises . . . . . . . . . . . . . . . . . . . . . . . . . . . . . . . 90 4.5 Beyond this tutorial . . . . . . . . . . . . . . . . . . . . . . . . . . . . . . . . . . . . . . . . . . . . . . 96 4.6 Quick references . . . . . . . . . . . . . . . . . . . . . . . . . . . . . . . . . . . . . . . . . . . . . . . . 98 5 Scipy : high-level scientific computing 101 File input/output: scipy.io . . . . . . . . . . . . . . . . . . . . . . . . . . . . . . . . . . . . . . . . . 102 5.1 Special functions: scipy.special . . . . . . . . . . . . . . . . . . . . . . . . . . . . . . . . . . . . . 103 5.2 Linear algebra operations: scipy.linalg . . . . . . . . . . . . . . . . . . . . . . . . . . . . . . . . . 103 5.3 Fast Fourier transforms: scipy.fftpack . . . . . . . . . . . . . . . . . . . . . . . . . . . . . . . . . 104 5.4 5.5 Optimization and fit: scipy.optimize . . . . . . . . . . . . . . . . . . . . . . . . . . . . . . . . . . 109 Statistics and random numbers: scipy.stats . . . . . . . . . . . . . . . . . . . . . . . . . . . . . . 113 5.6 Interpolation: scipy.interpolate . . . . . . . . . . . . . . . . . . . . . . . . . . . . . . . . . . . . 115 5.7 5.8 Numerical integration: scipy.integrate . . . . . . . . . . . . . . . . . . . . . . . . . . . . . . . . 116 Signal processing: scipy.signal . . . . . . . . . . . . . . . . . . . . . . . . . . . . . . . . . . . . . . 118 5.9 5.10 Image processing: scipy.ndimage . . . . . . . . . . . . . . . . . . . . . . . . . . . . . . . . . . . . . 120 i
5.11 Summary exercises on scientific computing . . . . . . . . . . . . . . . . . . . . . . . . . . . . . . . . 124 6 Getting help and finding documentation II Advanced topics 137 140 7 Advanced Python Constructs 142 Iterators, generator expressions and generators . . . . . . . . . . . . . . . . . . . . . . . . . . . . . . 142 7.1 . . . . . . . . . . . . . . . . . . . . . . . . . . . . . . . . . . . . . . . . . . . . . . . . . . . 147 7.2 Decorators 7.3 Context managers . . . . . . . . . . . . . . . . . . . . . . . . . . . . . . . . . . . . . . . . . . . . . . . 155 8 Advanced Numpy 159 8.1 Life of ndarray . . . . . . . . . . . . . . . . . . . . . . . . . . . . . . . . . . . . . . . . . . . . . . . . . 160 8.2 Universal functions . . . . . . . . . . . . . . . . . . . . . . . . . . . . . . . . . . . . . . . . . . . . . . 173 8.3 . . . . . . . . . . . . . . . . . . . . . . . . . . . . . . . . . . . . . . . . . . . 182 8.4 Array siblings: chararray, maskedarray, matrix . . . . . . . . . . . . . . . . . . . . . . . . . . . . 185 8.5 Summary . . . . . . . . . . . . . . . . . . . . . . . . . . . . . . . . . . . . . . . . . . . . . . . . . . . . 188 8.6 Contributing to Numpy/Scipy . . . . . . . . . . . . . . . . . . . . . . . . . . . . . . . . . . . . . . . . 188 Interoperability features 9 Debugging code 192 9.1 Avoiding bugs . . . . . . . . . . . . . . . . . . . . . . . . . . . . . . . . . . . . . . . . . . . . . . . . . . 192 9.2 Debugging workflow . . . . . . . . . . . . . . . . . . . . . . . . . . . . . . . . . . . . . . . . . . . . . . 195 9.3 Using the Python debugger . . . . . . . . . . . . . . . . . . . . . . . . . . . . . . . . . . . . . . . . . . 195 9.4 Debugging segmentation faults using gdb . . . . . . . . . . . . . . . . . . . . . . . . . . . . . . . . . 200 10 Optimizing code 203 10.1 Optimization workflow . . . . . . . . . . . . . . . . . . . . . . . . . . . . . . . . . . . . . . . . . . . . 203 10.2 Profiling Python code . . . . . . . . . . . . . . . . . . . . . . . . . . . . . . . . . . . . . . . . . . . . . 203 10.3 Making code go faster . . . . . . . . . . . . . . . . . . . . . . . . . . . . . . . . . . . . . . . . . . . . . 206 10.4 Writing faster numerical code . . . . . . . . . . . . . . . . . . . . . . . . . . . . . . . . . . . . . . . . 207 11 Sparse Matrices in SciPy 210 11.1 Introduction . . . . . . . . . . . . . . . . . . . . . . . . . . . . . . . . . . . . . . . . . . . . . . . . . . 210 11.2 Storage Schemes . . . . . . . . . . . . . . . . . . . . . . . . . . . . . . . . . . . . . . . . . . . . . . . . 212 11.3 Linear System Solvers . . . . . . . . . . . . . . . . . . . . . . . . . . . . . . . . . . . . . . . . . . . . . 224 11.4 Other Interesting Packages . . . . . . . . . . . . . . . . . . . . . . . . . . . . . . . . . . . . . . . . . . 229 12 Image manipulation and processing using Numpy and Scipy 230 12.1 Opening and writing to image files . . . . . . . . . . . . . . . . . . . . . . . . . . . . . . . . . . . . . 231 12.2 Displaying images . . . . . . . . . . . . . . . . . . . . . . . . . . . . . . . . . . . . . . . . . . . . . . . 232 12.3 Basic manipulations . . . . . . . . . . . . . . . . . . . . . . . . . . . . . . . . . . . . . . . . . . . . . . 233 12.4 Image filtering . . . . . . . . . . . . . . . . . . . . . . . . . . . . . . . . . . . . . . . . . . . . . . . . . 235 12.5 Feature extraction . . . . . . . . . . . . . . . . . . . . . . . . . . . . . . . . . . . . . . . . . . . . . . . 240 12.6 Measuring objects properties: ndimage.measurements . . . . . . . . . . . . . . . . . . . . . . . . 243 13 Mathematical optimization: finding minima of functions 248 13.1 Knowing your problem . . . . . . . . . . . . . . . . . . . . . . . . . . . . . . . . . . . . . . . . . . . . 249 13.2 A review of the different optimizers . . . . . . . . . . . . . . . . . . . . . . . . . . . . . . . . . . . . . 251 13.3 Practical guide to optimization with scipy . . . . . . . . . . . . . . . . . . . . . . . . . . . . . . . . . 258 13.4 Special case: non-linear least-squares . . . . . . . . . . . . . . . . . . . . . . . . . . . . . . . . . . . 260 13.5 Optimization with constraints . . . . . . . . . . . . . . . . . . . . . . . . . . . . . . . . . . . . . . . . 261 14 Interfacing with C 263 14.1 Introduction . . . . . . . . . . . . . . . . . . . . . . . . . . . . . . . . . . . . . . . . . . . . . . . . . . 263 14.2 Python-C-Api . . . . . . . . . . . . . . . . . . . . . . . . . . . . . . . . . . . . . . . . . . . . . . . . . . 264 14.3 Ctypes . . . . . . . . . . . . . . . . . . . . . . . . . . . . . . . . . . . . . . . . . . . . . . . . . . . . . . 268 14.4 SWIG . . . . . . . . . . . . . . . . . . . . . . . . . . . . . . . . . . . . . . . . . . . . . . . . . . . . . . . 272 14.5 Cython . . . . . . . . . . . . . . . . . . . . . . . . . . . . . . . . . . . . . . . . . . . . . . . . . . . . . . 276 14.6 Summary . . . . . . . . . . . . . . . . . . . . . . . . . . . . . . . . . . . . . . . . . . . . . . . . . . . . 279 14.7 Further Reading and References . . . . . . . . . . . . . . . . . . . . . . . . . . . . . . . . . . . . . . . 280 ii
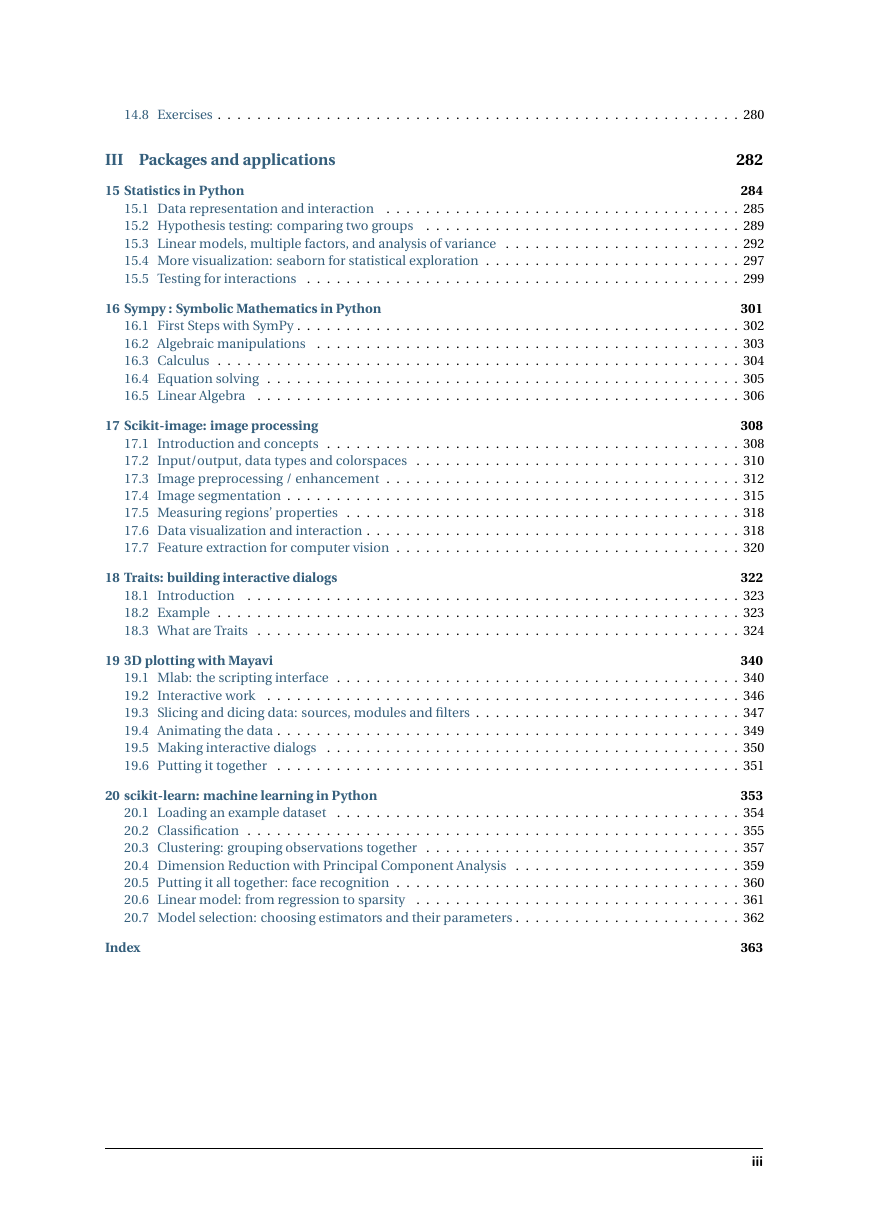
14.8 Exercises . . . . . . . . . . . . . . . . . . . . . . . . . . . . . . . . . . . . . . . . . . . . . . . . . . . . . 280 III Packages and applications 282 15 Statistics in Python 284 15.1 Data representation and interaction . . . . . . . . . . . . . . . . . . . . . . . . . . . . . . . . . . . . 285 15.2 Hypothesis testing: comparing two groups . . . . . . . . . . . . . . . . . . . . . . . . . . . . . . . . 289 15.3 Linear models, multiple factors, and analysis of variance . . . . . . . . . . . . . . . . . . . . . . . . 292 15.4 More visualization: seaborn for statistical exploration . . . . . . . . . . . . . . . . . . . . . . . . . . 297 15.5 Testing for interactions . . . . . . . . . . . . . . . . . . . . . . . . . . . . . . . . . . . . . . . . . . . . 299 16 Sympy : Symbolic Mathematics in Python 301 16.1 First Steps with SymPy . . . . . . . . . . . . . . . . . . . . . . . . . . . . . . . . . . . . . . . . . . . . . 302 16.2 Algebraic manipulations . . . . . . . . . . . . . . . . . . . . . . . . . . . . . . . . . . . . . . . . . . . 303 16.3 Calculus . . . . . . . . . . . . . . . . . . . . . . . . . . . . . . . . . . . . . . . . . . . . . . . . . . . . . 304 16.4 Equation solving . . . . . . . . . . . . . . . . . . . . . . . . . . . . . . . . . . . . . . . . . . . . . . . . 305 16.5 Linear Algebra . . . . . . . . . . . . . . . . . . . . . . . . . . . . . . . . . . . . . . . . . . . . . . . . . 306 17 Scikit-image: image processing 308 17.1 Introduction and concepts . . . . . . . . . . . . . . . . . . . . . . . . . . . . . . . . . . . . . . . . . . 308 17.2 Input/output, data types and colorspaces . . . . . . . . . . . . . . . . . . . . . . . . . . . . . . . . . 310 17.3 Image preprocessing / enhancement . . . . . . . . . . . . . . . . . . . . . . . . . . . . . . . . . . . . 312 17.4 Image segmentation . . . . . . . . . . . . . . . . . . . . . . . . . . . . . . . . . . . . . . . . . . . . . . 315 17.5 Measuring regions’ properties . . . . . . . . . . . . . . . . . . . . . . . . . . . . . . . . . . . . . . . . 318 17.6 Data visualization and interaction . . . . . . . . . . . . . . . . . . . . . . . . . . . . . . . . . . . . . . 318 17.7 Feature extraction for computer vision . . . . . . . . . . . . . . . . . . . . . . . . . . . . . . . . . . . 320 18 Traits: building interactive dialogs 322 18.1 Introduction . . . . . . . . . . . . . . . . . . . . . . . . . . . . . . . . . . . . . . . . . . . . . . . . . . 323 18.2 Example . . . . . . . . . . . . . . . . . . . . . . . . . . . . . . . . . . . . . . . . . . . . . . . . . . . . . 323 18.3 What are Traits . . . . . . . . . . . . . . . . . . . . . . . . . . . . . . . . . . . . . . . . . . . . . . . . . 324 19 3D plotting with Mayavi 340 19.1 Mlab: the scripting interface . . . . . . . . . . . . . . . . . . . . . . . . . . . . . . . . . . . . . . . . . 340 19.2 Interactive work . . . . . . . . . . . . . . . . . . . . . . . . . . . . . . . . . . . . . . . . . . . . . . . . 346 19.3 Slicing and dicing data: sources, modules and filters . . . . . . . . . . . . . . . . . . . . . . . . . . . 347 19.4 Animating the data . . . . . . . . . . . . . . . . . . . . . . . . . . . . . . . . . . . . . . . . . . . . . . . 349 19.5 Making interactive dialogs . . . . . . . . . . . . . . . . . . . . . . . . . . . . . . . . . . . . . . . . . . 350 19.6 Putting it together . . . . . . . . . . . . . . . . . . . . . . . . . . . . . . . . . . . . . . . . . . . . . . . 351 20 scikit-learn: machine learning in Python 353 20.1 Loading an example dataset . . . . . . . . . . . . . . . . . . . . . . . . . . . . . . . . . . . . . . . . . 354 20.2 Classification . . . . . . . . . . . . . . . . . . . . . . . . . . . . . . . . . . . . . . . . . . . . . . . . . . 355 20.3 Clustering: grouping observations together . . . . . . . . . . . . . . . . . . . . . . . . . . . . . . . . 357 20.4 Dimension Reduction with Principal Component Analysis . . . . . . . . . . . . . . . . . . . . . . . 359 20.5 Putting it all together: face recognition . . . . . . . . . . . . . . . . . . . . . . . . . . . . . . . . . . . 360 20.6 Linear model: from regression to sparsity . . . . . . . . . . . . . . . . . . . . . . . . . . . . . . . . . 361 20.7 Model selection: choosing estimators and their parameters . . . . . . . . . . . . . . . . . . . . . . . 362 Index 363 iii
Scipy lecture notes, Edition 2015.2 Contents 1
Part I Getting started with Python for science 2
This part of the Scipy lecture notes is a self-contained introduction to everything that is needed to use Python for science, from the language itself, to numerical computing or plotting. Scipy lecture notes, Edition 2015.2 3
CHAPTER 1 Scientific computing with tools and workflow Authors: Fernando Perez, Emmanuelle Gouillart, Gaël Varoquaux, Valentin Haenel 1.1 Why Python? 1.1.1 The scientist’s needs • Get data (simulation, experiment control), • Manipulate and process data, • Visualize results (to understand what we are doing!), • Communicate results: produce figures for reports or publications, write presentations. 1.1.2 Specifications • Rich collection of already existing bricks corresponding to classical numerical methods or basic actions: we don’t want to re-program the plotting of a curve, a Fourier transform or a fitting algorithm. Don’t reinvent the wheel! • Easy to learn: computer science is neither our job nor our education. We want to be able to draw a curve, smooth a signal, do a Fourier transform in a few minutes. • Easy communication with collaborators, students, customers, to make the code live within a lab or a company: the code should be as readable as a book. Thus, the language should contain as few syn- tax symbols or unneeded routines as possible that would divert the reader from the mathematical or scientific understanding of the code. • Efficient code that executes quickly... but needless to say that a very fast code becomes useless if we spend too much time writing it. So, we need both a quick development time and a quick execution time. • A single environment/language for everything, if possible, to avoid learning a new software for each new problem. 1.1.3 Existing solutions Which solutions do scientists use to work? Compiled languages: C, C++, Fortran, etc. • Advantages: – Very fast. Very optimized compilers. For heavy computations, it’s difficult to outperform these languages. 4
分享到:
收藏