Application of Cluster-Based Local Outlier Factor
Algorithm in Anti-Money Laundering
Gao Zengan
Post Doctoral Station of Theoretical Economics
China Center for Anti-Money Laundering Studies
Fudan University
Shanghai, P. R. China
School of Economics and Management
Southwest Jiaotong University
Chengdu, P. R. China
E-mail address: gaozengan133@163.com
institutions’ capability
Abstract—Financial
in recognizing
suspicious money laundering transactional behavioral patterns
(SMLTBPs) is critical to anti-money laundering. Combining
distance-based unsupervised clustering and
local outlier
detection, this paper designs a new cluster-based local outlier
factor (CBLOF) algorithm to identify SMLTBPs and use
authentic and synthetic data experimentally
its
applicability and effectiveness.
test
to
Keywords-clustering; outlier detection; local outlier factor
(LOF); suspicious money laundering transactional behavioral
patterns (SMLTBPs); anti-money laundering (AML)
I. INTRODUCTION
Anti-money laundering (AML) in financial industry is
based on the analysis and processing of Suspicious Activity
Reports (SARs) filed by financial institutions (FIs), but the
very
large number of SARs usually makes financial
intelligence units’ (FIUs’) analysis a waste of time and
resources simply because only a few transactions are really
suspicious in a given amount [1], so financial AML is far from
a real-time, dynamic, and self-adaptable recognition of
suspicious money laundering transactional behavioral patterns
(SMLTBPs). Literature review finds that artificial intelligence
[2], support vector machine (SVM) [3], outlier detection [4],
and break-point analysis (BPA) [5] are used to improve FIs’
ability in processing suspicious data, various approaches to
novelty detection on time series data are examined in [6],
outlier detection methodologies are surveyed by [7], and a
data mining-based framework for AML research is proposed
in [8] after a comprehensive comment is made on relative
studies. But the effectiveness and efficiency of SMLTBP
identification remains a hot spot for research since the passage
of the USA Patriot Act and the creation of the U.S.
Department of Homeland Security signaled a new era in
applying information technology and data mining in detecting
money laundering and terrorist financing [9].
As SMLTBP recognition is short of training data, the
number of clusters is usually unknown, and the result of
clustering is always changing dynamically [10, 11], this paper
designs a cluster-based local outlier factor (CBLOF) algorithm
to help FIUs concentrate on a desirable number of SMLTBPs
having a proper degree of suspiciousness as determined by
their actual needs and resources endowments. Following the
introduction, Section II describes the design of the algorithm,
Section III is about the experimental process, and Section IV
ends the paper with a suggestion for future research.
II. ALGORITHM DESIGN
combines
algorithm
The CBLOF
distance-based
unsupervised clustering and local outlier [12] detection, and
clustering is for the purpose of pre-processing data for the
consequent anomaly identification.
A. Clustering
As far as the nature of money laundering (ML) is
concerned, the chosen clustering algorithm should be able to
generate the number of clusters automatically (with no need
for pre-establishment) and all the clusters are to be ranked
according to the number of the components in each. Thus we
propose the following procedures:
1) Start with any object (say p) in a dataset and create a
cluster. The initial cluster is supposed to be C1.
2) Choose any other object q, calculate its distance to the
existing clusters C1, C2, C3, …, Ci and denote it by
distance q Ci
, and then figure out the minimal distance
( ,
value
( ,
distance q Cmin .
)
)
3) Let the threshold be ε. If
distance q Cmin ε≤ holds
and “q has never been clustered” satisfies, add q to the cluster
Ci which is assumed to be nearest to q when compared with all
( ,
)
The research is supported by the National Social Science Foundation of China (No. 08BGJ013).
978-1-4244-4639-1/09/$25.00 ©2009 IEEE
�
( ,
distance q Cmin ε> ,
the other known clusters. Conversely, if
implying that q has not yet been clustered into any category,
build a new cluster Cj and embed q into it. Nevertheless,
distance q Cm ε≤ ,
suppose there is a cluster Cm outside Ci, if
then integrate Cm and Ci into one cluster, that is, if we have
distance q Cm ε≤ and
distance q Ci ε≤ simultaneously,
then clusters Cm and Ci are merged into one.
( ,
( ,
( ,
)
)
)
)
4) Repeat Steps 2) and 3) until all the objects have been
clustered.
5) Rank all the clusters in the decreasing number of their
components involved.
B. Outlier Detection
An outlier is a point that deviates so much from
surrounding “normal” points as to arouse suspicion that it was
generated by a different mechanism. After clustering, all the
samples have been categorized into mutually exclusive
clusters ranked as per the number of their components. As
most transactions in an account are usually normal or legal,
the clusters generated from above are divided into Large
Category (LC) and Small Category (SC) in this paper, with the
former being supposed to represent normal transactional
behavioral patterns free of ML suspicion and the latter, on the
contrary, for anomalous patterns worth notice.
+
1
C
b
for LC, that is,
}
b
c i
{
i
>
b
}
≤
=
where
and
c
=
. While (1) represents the majority of the
SC
c j
{
j
objects in the dataset, (2) indicates that the number of LC
components is greatly different from that of SC components.
c i
i
LC
=
≤
b
{
}
Furthermore, the points in SC are all outliers when
compared with those in LC [13, 14]. But for AML research,
seasonal industries and some special industries must be
exempted because abnormal phenomena in a particular period
can never be treated as ML red flags. So the paper will study n
number of data points with top local outlier factor (LOF)
values because they are more of ML suspicion. Also, this can
effectively improve AML pertinence.
In the light of the local outlier definition in [12], LOF can
be employed to measure the deviant degree of SC points from
LC, i.e., how far the transactional behavioral patterns
represented by the points in SC deviate from the normal or
legitimate patterns, where LOF value is determined by the
number of the components in the clusters sample data belong
to and the distance from sample data to the nearest LC.
Given a point o in the dataset, its LOF value is:
LOF( o )
=
∗
c min[distance( o,c )]
i
i
(3)
2
k
,
c
}
of
c
the
,
dataset D,
For
{
=
c c
,
1
clustering
c
c
and 1
let
> . Given any two
result
>
C
parameters α and β, we have:
+
≥ (2)
β
(1)
D α
= ∑
c
C
b
T a
c
b
ta
+
+
≥
∗
c
ij
=
n
1
2
1
2
k
i
j
j
o
∈
∈
LC
c c
,
i
i
the farther
∈
SC c
,
the point o deviates from
. The higher the LOF value
where
the normal
is,
transactional behavioral patterns. Once the LOF value is fixed
for each object, we can get to know how suspicious the
transactional behavioral patterns are in the given account.
Rank the data points as per their LOF values, we can get a
feature-oriented ordering of SMLTBPs to help FIs choose n
number of objects as they like for a detailed exploration and
finally determine what to file to FIUs under the restraints of
investigation resources in labor, capital, and technology, etc.
III. EXPERIMENTAL PROCESS
The experimental process mainly includes extracting
research variables, preparing data samples, actualize the
algorithm, and discussing the experimental results.
A. Choose and Define the Features to Be Studied
We are more interested in the transactional behavioral
attributes like amount and frequency than in the account
owner’s subjective characters,
transaction amount,
transaction amount deviation coefficiency, and transaction
frequency (i.e., withdrawal frequency and deposit frequency)
are chosen to be research variables with the following
definitions:
thus
Definition 1: Transaction amount (Tai) is the total amount
of all the transactional segments or subsequences, that is,
(4)
where, Tai is the transaction amount of the ith transactional
segment of a given account, Taij is the amount of the jth
transaction in the ith segment (and so and so forth hereinafter).
Transaction amount is a critical criterion for us to determine
whether a transaction is suspicious or not since a large cash
transaction is viewed as a special kind of suspicious
transaction in this research.
Definition 2: Transaction amount deviation coefficiency
2)
(Tadi) is the ratio between transaction amount variation (Tsi
and average transaction amount (
2
Ts
i
=
Tad
i
=
n
i
−
n
i
1
•
Ta
i
iTa ), that is,
∑
Ta
i
ta
ij
−
(
)
in
=
1
j
n
∑
=
1
j
ta
ij
2
(5)
Tadi is used to measure the degree of equalization of
transaction amount (i.e., structuring) which means a large cash
transaction, either deposit or withdrawal, is purposefully
divided into several transactions of a nearly equal amount in
order to exempt from filing Currency Transaction Reports
(CTRs) as required by the authority. The less the Tadi value is,
the more equalized the transaction amount is, and the more
suspicious the transaction is as far as CTR regulations are
concerned.
Definition 3: Withdrawal/deposit frequency is the ratio of
�
the number of withdrawal/deposit transfers to the aggregated
frequency of transactions.
Denote
the withdrawal
the deposit
frequency of the ith transactional segment of a given account
by Tfwi and Tfdi, respectively, and denote the total frequency
of transactions by tf, we have the following formulas:
frequency and
t f
=
T f w
T f d
i
i
t f w
=
i
t f w
+
i
t f d
i
=
t f d
i
t f
t f
(6)
is
capital
centralized
Analyzing withdrawal frequency and deposit frequency
can identify two novel capital flows within a short time frame:
followed by
one
in-transfers
decentralized capital out-transfers, and
the other
is
decentralized capital in-transfers followed by centralized
out-transfers. Also, this analysis can compensate for the
research of [5].
B. Prepare Data Samples
Just like the authors of [6], we are most interested in data
patterns that deviate from the normal operational data. So
historical transaction records are to be transformed into
several segments or subsequences of neighboring single
transactions, with one segment (subsequence) representing
one behavioral pattern, and the transactional data embedded in
SMLTBPs are just the suspicious objects we hope to find out.
For each feature as above mentioned, calculate its feature
value for each segment and take the feature vectors composed
of feature values as research samples.
In this research, we have collected from 108 accounts of
one commercial bank 34,303 authentic transactional data from
January 1 through October 30, 2006 out of which the account
data of 25 firms in 4 industries sharing similar turnover scale
and transactional frequency are taken as experimental samples.
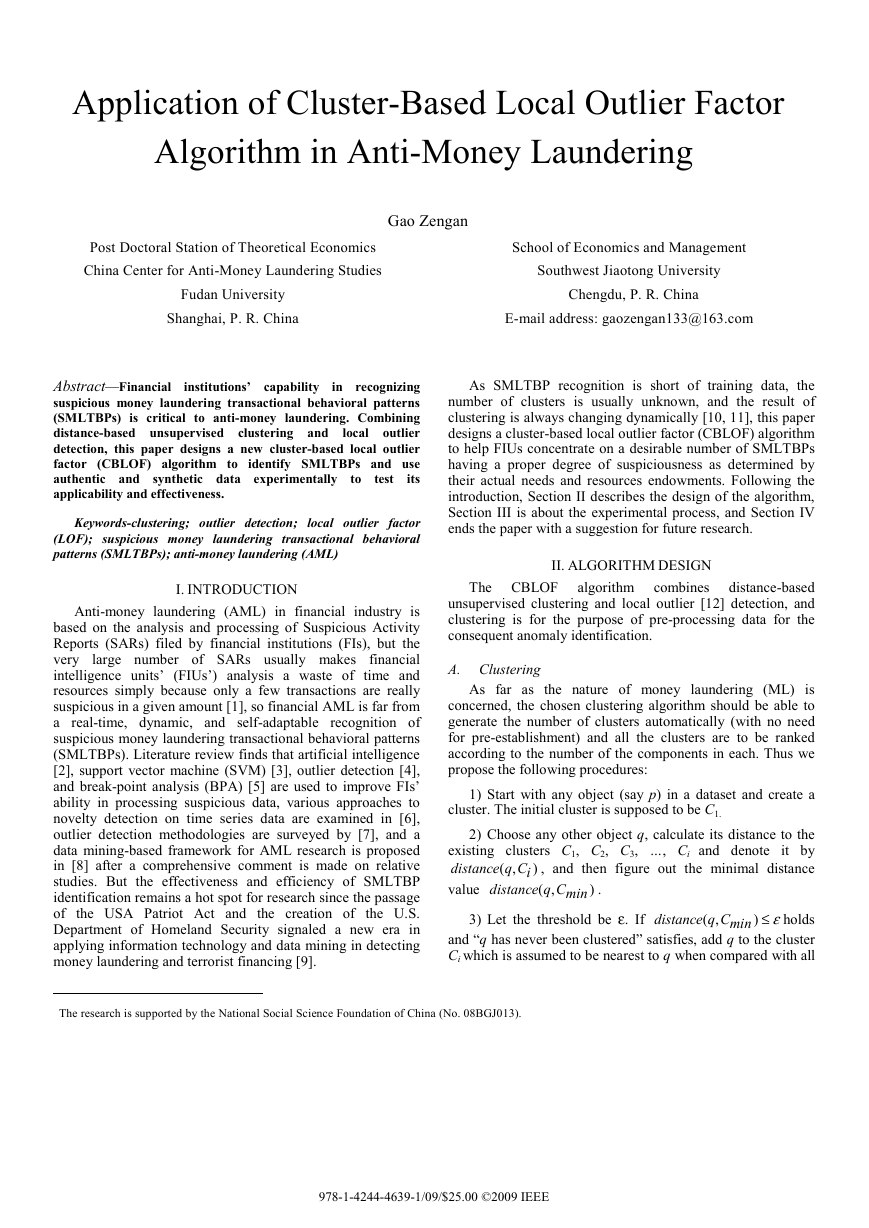
Meanwhile, twenty segments of synthetic data are generated
by the mechanism in Figure 1 [15, 16] to test the applicability
of the algorithm in detecting abnormal objects. Each segment
of artificial simulation data is employed twice.
As per the Regulations for Financial Institutions to File
Currency Transaction Reports and Suspicious Transaction
Reports of the People’s Bank of China, ten days is accepted as
transactional data. After
the
standard
pre-processing
the
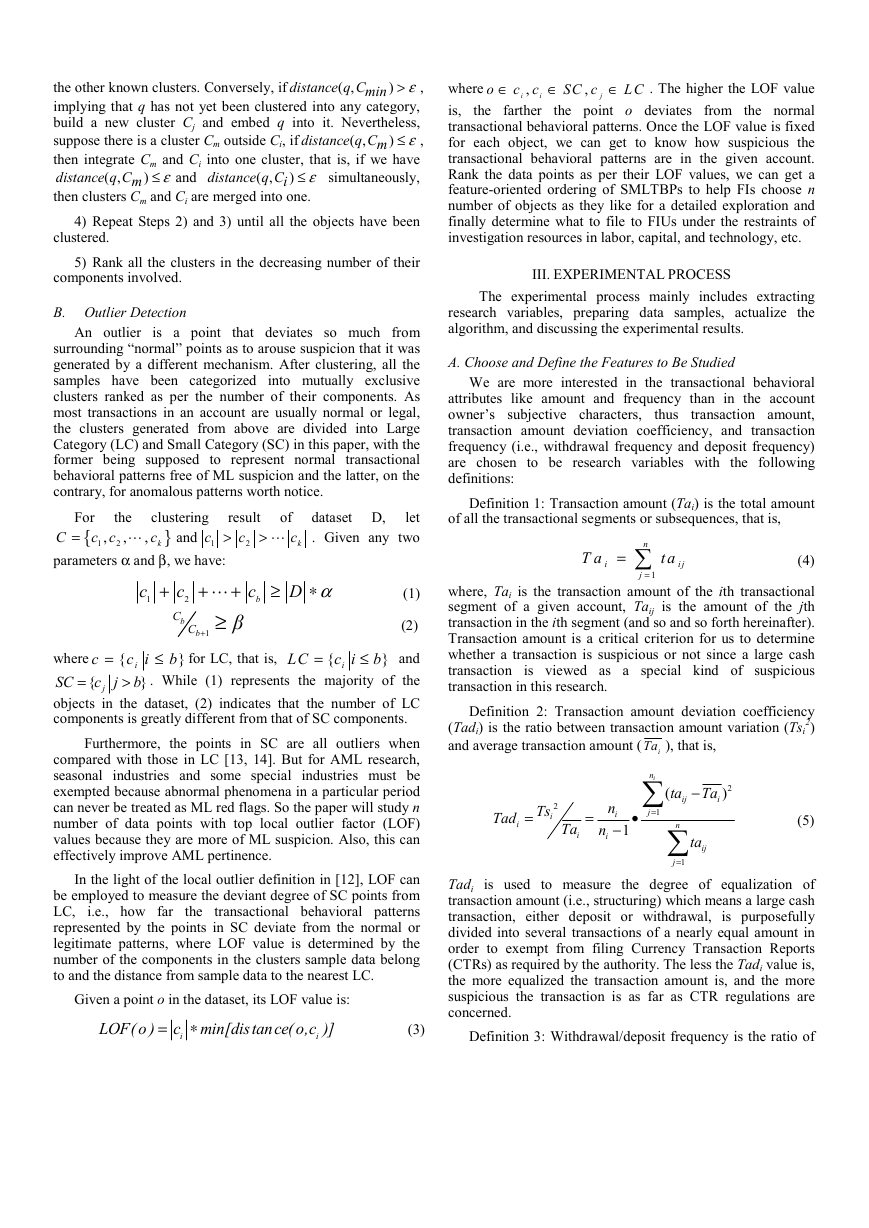
subsequences, and extracting the feature values, we obtain 696
experimental samples of 25 accounts, of which only 40
synthetic data samples are listed in Table 1 due to the limit of
the paper.
to
the experimental data, segmenting
segment
C. Actualize the Algorithm
Do experiment with the CBLOF algorithm on the sample
set. As global outlier detection cannot mine all the outliers
[12], give LOF value to each sample, and then identify n
number of samples with the highest LOF values for further
investigation and final reporting.
D. Experimental Results and Discussions
Let clustering threshold ε = 0.15 and categorization
parameters α=75% and β=4, we will first of all standardize
the dimensions of data samples, and then program with C++
language, cluster, categorize LC and SC, and compute LOF
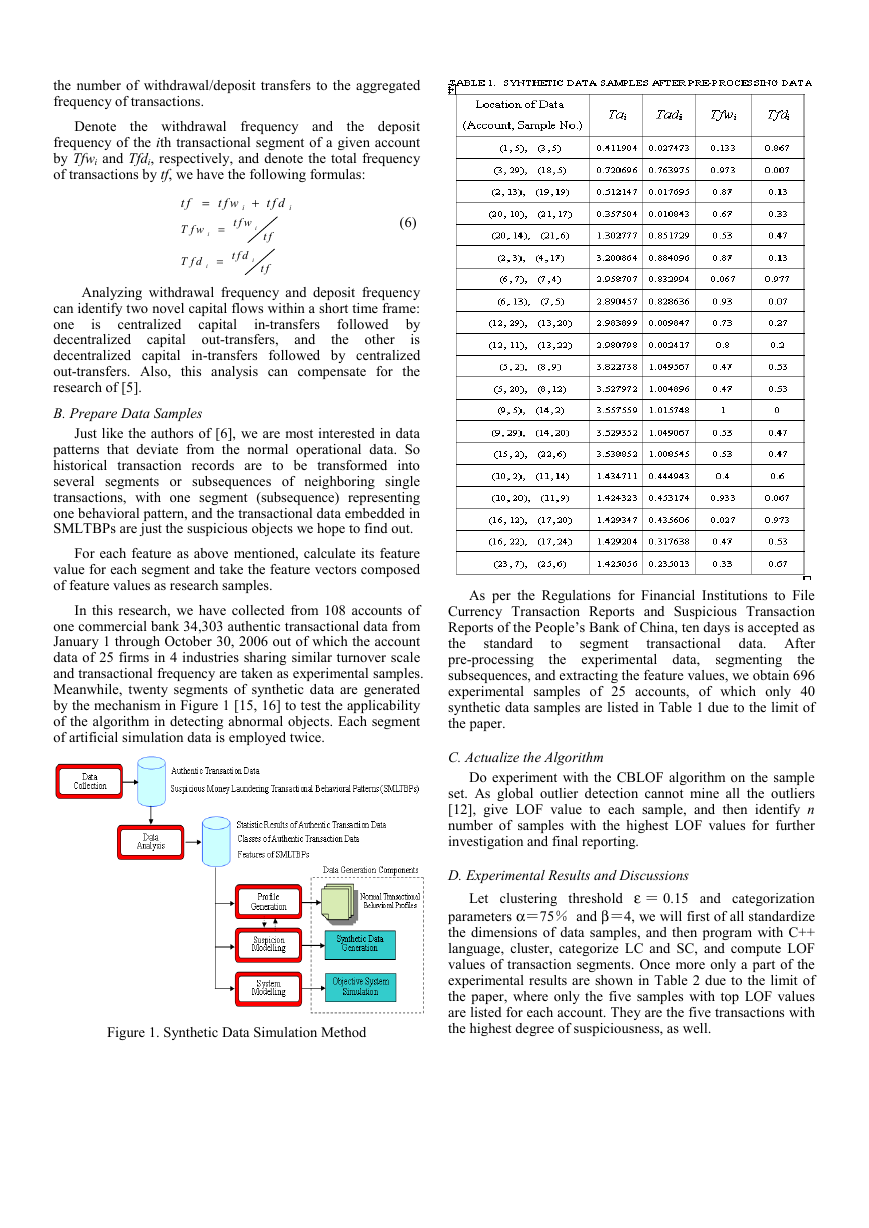
values of transaction segments. Once more only a part of the
experimental results are shown in Table 2 due to the limit of
the paper, where only the five samples with top LOF values
are listed for each account. They are the five transactions with
the highest degree of suspiciousness, as well.
Figure 1. Synthetic Data Simulation Method
�
REFERENCES
[1] H. G. Goldberg and R. W. H. Wong. “Restructuring transactional data
for link analysis in the FinCEN AI System”. In: Proceedings of 1998
AAAI Fall Symposium on Artificial Intelligence and Link Analysis,
Menlo Park, C. A.: AAAI Press, 1998.
[2] H. G. Goldberg and T. E. Senator. “Restructuring database for
knowledge discovery by consolidation and link formation”. In:
Proceedings of the First International Conference on Knowledge
Discovery in Database (KDD-95), Menlo Park, Calif.: AAAI Press,
1995: 136-141.
J. Tang and J. Yin. “Developing an intelligent data discriminating
system of antimoney laundering based on SVM”. In: Proc. of the Fourth
International Conference on Machine Learning and Cybernetics,
Guangzhou, 2005: 3453-3457.
[3]
[4] R. C. Watkins, K. M. Reynolds, R. Demara, M. Georgiopoulos, A.
Gonzalez, and R. Eaglin. “Tracking dirty proceeds: exploring data
mining technologies as tools to investigate money laundering”. Police
Practice and Research, 2003, 4 (2): 163-178.
[5] R. J. Bolton and D. J. Hand. “Unsupervised profiling methods for fraud
detection”. Conference on Credit Scoring and Credit Control VII,
Edinburgh, UK, 2001: 5-7.
J. Anstey, D. Peters, and C. Dawson. “Discovering novelty in time
series data”. In: Proceedings of the 15th Annual Newfoundland
Electrical and Computer Engineering Conference, Canada, 2005.
[6]
[7] V. Hodge and J. Austin, “A survey of outlier detection methodologies.”
Artif. Intell. Rev., 2004, 22 (2): 85-126.
[8] Z. Gao and M. Ye. “A framework for data mining-based anti-money
laundering research”. Journal of Money Laundering Control, 2007, 10
(2): 170-179.
J. S. Zdanowicz. “Detecting money laundering and terrorist financing
via data mining”. Communications of the ACM, 2004, 47 (5): 53–55.
[9]
[10] J. Han, Y. Huang, and N. Cercone. “Data mining: an overview from
database perspective”. IEEE Transaction on Knowledge and Data
Engineering, 1996, 8 (6): 1-40.
[11] J. Han and M. Kamber. Data Mining: Concepts and Technique. Morgan
Kaufmann Publishers, 2001.
[12] M. M. Breuning, H. P. Kriegel, T. Ng. Raymond, and J. Sander. “LOF:
identifying density-based local outliers”. In: Proc. ACM SIGMOD
2000. Int. Conf. on Management of Data. Dallas, TX, 2000: 93-104.
[13] Z. He, X. Xu, and S. Deng. “Discovering cluster-based local outliers”.
Pattern Recognition Letters. 2003, 24 (9-10): 1641-1650.
[14] M. F. Jiang, S. S. Tseng, and C. M. Su. “Two-phase clustering process
for outliers detection”. Pattern Cognition Letters, 2001, 22: 691-700.
[15] E. Lundin, H. Kvarnström, and E. A. Jonsson. “Synthetic fraud data
generation methodology”. In: Lecture Note in Computer Science,
ICICS2002. Laboratories for Information Technology, Singapore,
Springer Verlag, 2002: 265-277.
[16] E. Barse, H. Kvarnström, and E. Jonsson. “Synthesizing, test data for
fraud detection systems”. In: Proceedings of the 19th Annual Computer
Security Applications Conference. 2003: 384-395.
[17] Z. Gao. “Comments on anti-money laundering suspicious activity
report regime”. In: Proceedings of 2006 International Conference on
Public Administration. X. Zhu and S. Zhao, Eds. Chengdu: University
of Electronic Science and Technology of China Press, 2006: 970–975.
What is more, all the anomalous samples in the 25
accounts are ranked in the decreasing order of their LOF
values. Particularly, 33 of 40 artificial samples are found with
relatively higher LOF values and they even rank the top five
of their accounts, which proves the effectiveness of the
CBLOF algorithm in identifying suspicious data.
IV. CONCLUSION
Making a good use of
the advantages of both
distance-based unsupervised clustering and
local outlier
detecting, the CBLOF algorithm can effectively identify the
synthetic data suspicious of ML transactions with a high
processing speed and a satisfactory accuracy. Needing neither
prior samples to serve as training data nor the number of
clusters to be designated in advance can solve the problem
that AML research is always in short of case data. In
particular, the algorithm is self-adaptable to the evolution of
ML methods and can recognize SMLTBPs that haven’t been
detected before, which is quite beneficial in saving limited
investigation resources and preventing FIs from filing
defensive SARs [17].
However, only a few transactional behavioral features of
amount and frequency are studied in this paper, so relative
subjective characters of the account owner remains open to
our future research.
�


 2023年江西萍乡中考道德与法治真题及答案.doc
 2012年重庆南川中考生物真题及答案.doc
 2013年江西师范大学地理学综合及文艺理论基础考研真题.doc
 2020年四川甘孜小升初语文真题及答案I卷.doc
 2020年注册岩土工程师专业基础考试真题及答案.doc
 2023-2024学年福建省厦门市九年级上学期数学月考试题及答案.doc
 2021-2022学年辽宁省沈阳市大东区九年级上学期语文期末试题及答案.doc
 2022-2023学年北京东城区初三第一学期物理期末试卷及答案.doc
 2018上半年江西教师资格初中地理学科知识与教学能力真题及答案.doc
 2012年河北国家公务员申论考试真题及答案-省级.doc
 2020-2021学年江苏省扬州市江都区邵樊片九年级上学期数学第一次质量检测试题及答案.doc
 2022下半年黑龙江教师资格证中学综合素质真题及答案.doc