Anomaly Detection: A Survey
VARUN CHANDOLA, ARINDAM BANERJEE, and VIPIN KUMAR
University of Minnesota
15
Anomaly detection is an important problem that has been researched within diverse research areas and
application domains. Many anomaly detection techniques have been specifically developed for certain appli-
cation domains, while others are more generic. This survey tries to provide a structured and comprehensive
overview of the research on anomaly detection. We have grouped existing techniques into different categories
based on the underlying approach adopted by each technique. For each category we have identified key as-
sumptions, which are used by the techniques to differentiate between normal and anomalous behavior. When
applying a given technique to a particular domain, these assumptions can be used as guidelines to assess
the effectiveness of the technique in that domain. For each category, we provide a basic anomaly detection
technique, and then show how the different existing techniques in that category are variants of the basic
technique. This template provides an easier and more succinct understanding of the techniques belonging to
each category. Further, for each category, we identify the advantages and disadvantages of the techniques in
that category. We also provide a discussion on the computational complexity of the techniques since it is an
important issue in real application domains. We hope that this survey will provide a better understanding
of the different directions in which research has been done on this topic, and how techniques developed in
one area can be applied in domains for which they were not intended to begin with.
Categories and Subject Descriptors: H.2.8 [Database Management]: Database Applications—Data mining
General Terms: Algorithms
Additional Key Words and Phrases: Anomaly detection, outlier detection
ACM Reference Format:
Chandola, V., Banerjee, A., and Kumar, V. 2009. Anomaly detection: A survey. ACM Comput. Surv. 41, 3,
Article 15 (July 2009), 58 pages. DOI = 10.1145/1541880.1541882
http://doi.acm.org/10.1145/1541880.1541882
1. INTRODUCTION
Anomaly detection refers to the problem of finding patterns in data that do not conform
to expected behavior. These nonconforming patterns are often referred to as anomalies,
outliers, discordant observations, exceptions, aberrations, surprises, peculiarities, or
This work was supported by NASA under award NNX08AC36A, NSF grant number CNS-0551551, NSF
ITR Grant ACI-0325949, NSF IIS-0713227, and NSF Grant IIS-0308264. Access to computing facilities was
provided by the Digital Technology Consortium.
Author’s address: V. Chandola, Computer Science Department, University of Minnesota, 200 Union St.,
Minneapolis, MN 55414.
Permission to make digital or hard copies of part or all of this work for personal or classroom use is granted
without fee provided that copies are not made or distributed for profit or commercial advantage and that
copies show this notice on the first page or initial screen of a display along with the full citation. Copyrights for
components of this work owned by others than ACM must be honored. Abstracting with credit is permitted.
To copy otherwise, to republish, to post on servers, to redistribute to lists, or to use any component of this
work in other works requires prior specific permission and/or a fee. Permissions may be requested from
Publications Dept., ACM, Inc., 2 Penn Plaza, Suite 701, New York, NY 10121-0701 USA, fax +1 (212) 869-
0481, or permissions@acm.org.
c2009 ACM 0360-0300/2009/07-ART15 $10.00
DOI 10.1145/1541880.1541882 http://doi.acm.org/10.1145/ 1541880.1541882
ACM Computing Surveys, Vol. 41, No. 3, Article 15, Publication date: July 2009.
�
15:2
V. Chandola et al.
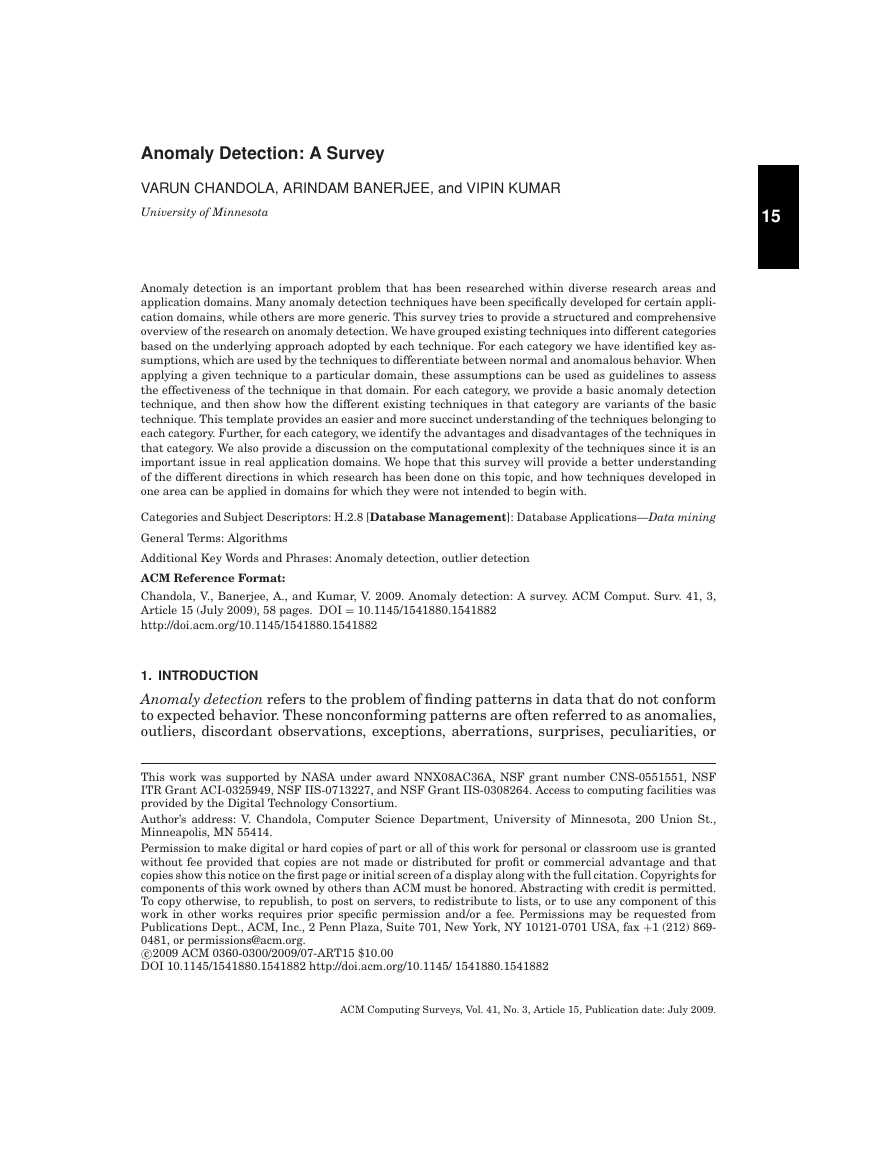
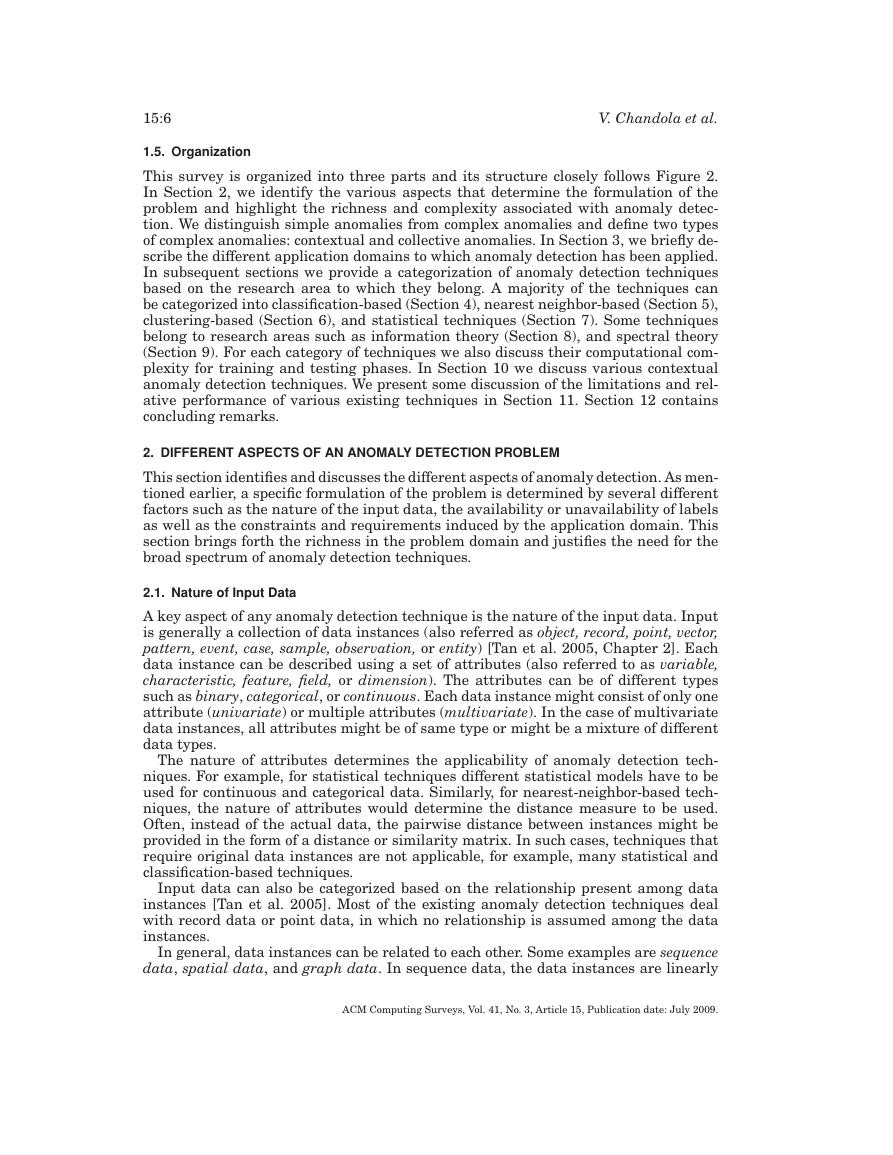
Fig. 1. A simple example of anomalies in a two-dimensional data set.
contaminants in different application domains. Of these, anomalies and outliers are
two terms used most commonly in the context of anomaly detection; sometimes inter-
changeably. Anomaly detection finds extensive use in a wide variety of applications
such as fraud detection for credit cards, insurance, or health care, intrusion detection
for cyber-security, fault detection in safety critical systems, and military surveillance
for enemy activities.
The importance of anomaly detection is due to the fact that anomalies in data trans-
late to significant, and often critical, actionable information in a wide variety of appli-
cation domains. For example, an anomalous traffic pattern in a computer network could
mean that a hacked computer is sending out sensitive data to an unauthorized destina-
tion [Kumar 2005]. An anomalous MRI image may indicate the presence of malignant
tumors [Spence et al. 2001]. Anomalies in credit card transaction data could indicate
credit card or identity theft [Aleskerov et al. 1997], or anomalous readings from a space
craft sensor could signify a fault in some component of the space craft [Fujimaki et al.
2005].
Detecting outliers or anomalies in data has been studied in the statistics community
as early as the 19th century [Edgeworth 1887]. Over time, a variety of anomaly detection
techniques have been developed in several research communities. Many of these tech-
niques have been specifically developed for certain application domains, while others
are more generic.
This survey tries to provide a structured and comprehensive overview of the research
on anomaly detection. We hope that it facilitates a better understanding of the different
directions in which research has been done on this topic, and how techniques developed
in one area can be applied in domains for which they were not intended to begin with.
1.1. What are Anomalies?
Anomalies are patterns in data that do not conform to a well defined notion of normal
behavior. Figure 1 illustrates anomalies in a simple two-dimensional data set. The data
has two normal regions, N1 and N2, since most observations lie in these two regions.
Points that are sufficiently far away from these regions, for example, points o1 and o2,
and points in region O3, are anomalies.
Anomalies might be induced in the data for a variety of reasons, such as malicious
activity, for example, credit card fraud, cyber-intrusion, terrorist activity or break-
down of a system, but all of the reasons have the common characteristic that they are
ACM Computing Surveys, Vol. 41, No. 3, Article 15, Publication date: July 2009.
�
Anomaly Detection: A Survey
15:3
interesting to the analyst. The interestingness or real life relevance of anomalies is a
key feature of anomaly detection.
Anomaly detection is related to, but distinct from noise removal [Teng et al. 1990] and
noise accommodation [Rousseeuw and Leroy 1987], both of which deal with unwanted
noise in the data. Noise can be defined as a phenomenon in data that is not of interest
to the analyst, but acts as a hindrance to data analysis. Noise removal is driven by
the need to remove the unwanted objects before any data analysis is performed. Noise
accommodation refers to immunizing a statistical model estimation against anomalous
observations [Huber 1974].
Another topic related to anomaly detection is novelty detection [Markou and Singh
2003a, 2003b; Saunders and Gero 2000], which aims at detecting previously unobserved
(emergent, novel) patterns in the data, for example, a new topic of discussion in a news
group. The distinction between novel patterns and anomalies is that the novel patterns
are typically incorporated into the normal model after being detected.
It should be noted that solutions for these related problems are often used for anomaly
detection and vice versa, and hence are discussed in this review as well.
1.2. Challenges
At an abstract level, an anomaly is defined as a pattern that does not conform to
expected normal behavior. A straightforward anomaly detection approach, therefore,
is to define a region representing normal behavior and declare any observation in the
data that does not belong to this normal region as an anomaly. But several factors make
this apparently simple approach very challenging:
—Defining a normal region that encompasses every possible normal behavior is very
difficult. In addition, the boundary between normal and anomalous behavior is of-
ten not precise. Thus an anomalous observation that lies close to the boundary can
actually be normal, and vice versa.
—When anomalies are the result of malicious actions, the malicious adversaries of-
ten adapt themselves to make the anomalous observations appear normal, thereby
making the task of defining normal behavior more difficult.
—In many domains normal behavior keeps evolving and a current notion of normal
behavior might not be sufficiently representative in the future.
—The exact notion of an anomaly is different for different application domains. For
example, in the medical domain a small deviation from normal (e.g., fluctuations
in body temperature) might be an anomaly, while similar deviation in the stock
market domain (e.g., fluctuations in the value of a stock) might be considered as
normal. Thus applying a technique developed in one domain to another, is not
straightforward.
—Availability of labeled data for training/validation of models used by anomaly detec-
tion techniques is usually a major issue.
—Often the data contains noise that tends to be similar to the actual anomalies and
hence is difficult to distinguish and remove.
Due to these challenges, the anomaly detection problem, in its most general form,
is not easy to solve. In fact, most of the existing anomaly detection techniques solve a
specific formulation of the problem. The formulation is induced by various factors such
as the nature of the data, availability of labeled data, type of anomalies to be detected,
and so on. Often, these factors are determined by the application domain in which the
anomalies need to be detected. Researchers have adopted concepts from diverse disci-
plines such as statistics, machine learning, data mining, information theory, spectral
ACM Computing Surveys, Vol. 41, No. 3, Article 15, Publication date: July 2009.
�
15:4
V. Chandola et al.
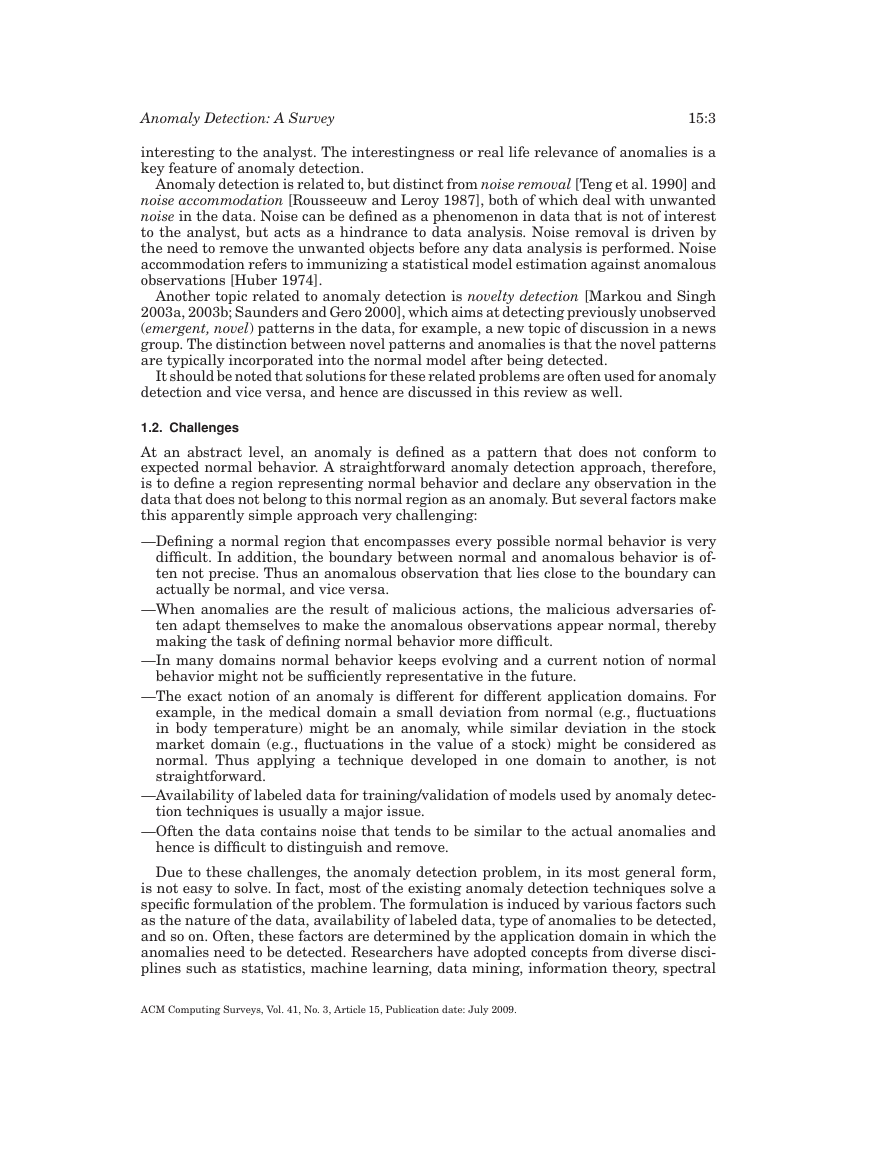
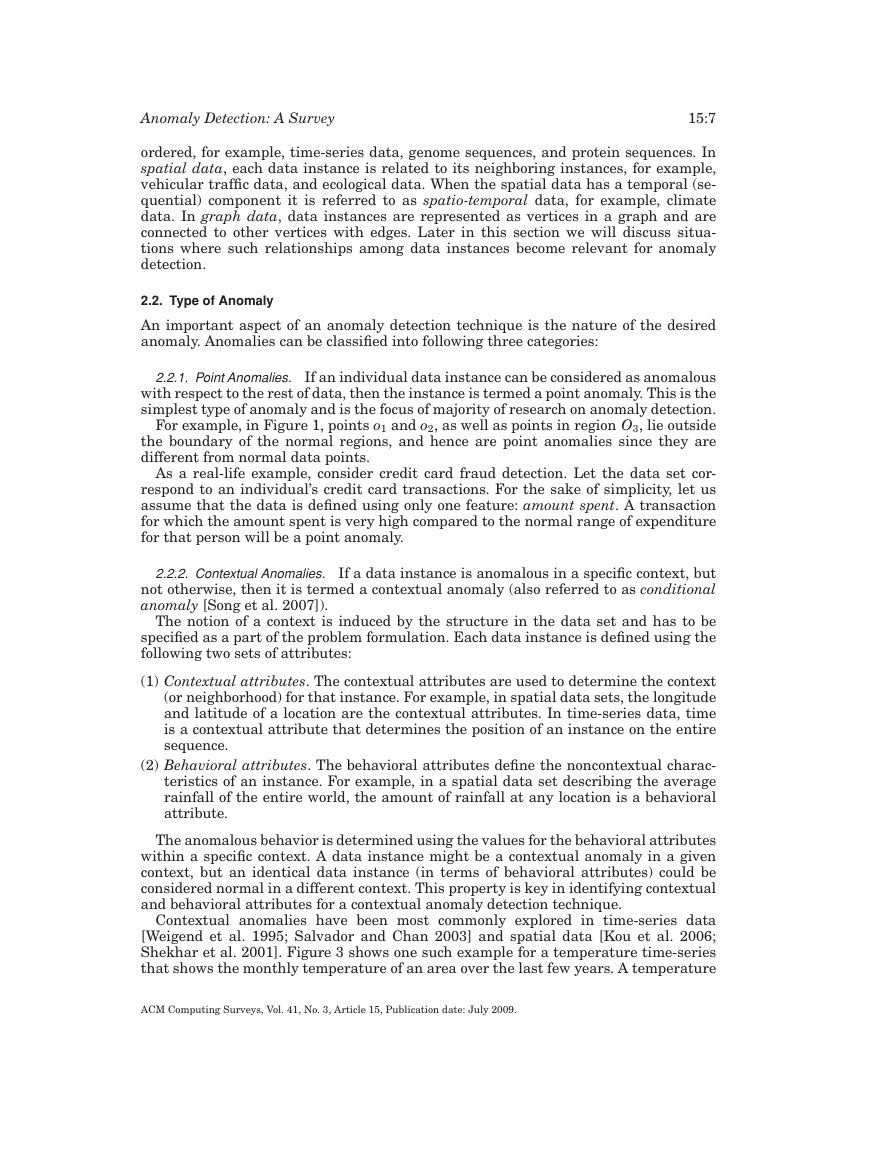
Fig. 2. Key components associated with an anomaly detection technique.
theory, and have applied them to specific problem formulations. Figure 2 shows the key
components associated with any anomaly detection technique.
1.3. Related Work
Anomaly detection has been the topic of a number of surveys and review articles, as
well as books. Hodge and Austin [2004] provide an extensive survey of anomaly de-
tection techniques developed in machine learning and statistical domains. A broad
review of anomaly detection techniques for numeric as well as symbolic data is pre-
sented by Agyemang et al. [2006]. An extensive review of novelty detection techniques
using neural networks and statistical approaches has been presented in Markou and
Singh [2003a] and Markou and Singh [2003b], respectively. Patcha and Park [2007]
and Snyder [2001] present a survey of anomaly detection techniques used specifically
for cyber-intrusion detection. A substantial amount of research on outlier detection
has been done in statistics and has been reviewed in several books [Rousseeuw and
Leroy 1987; Barnett and Lewis 1994; Hawkins 1980] as well as other survey articles
[Beckman and Cook 1983; Bakar et al. 2006].
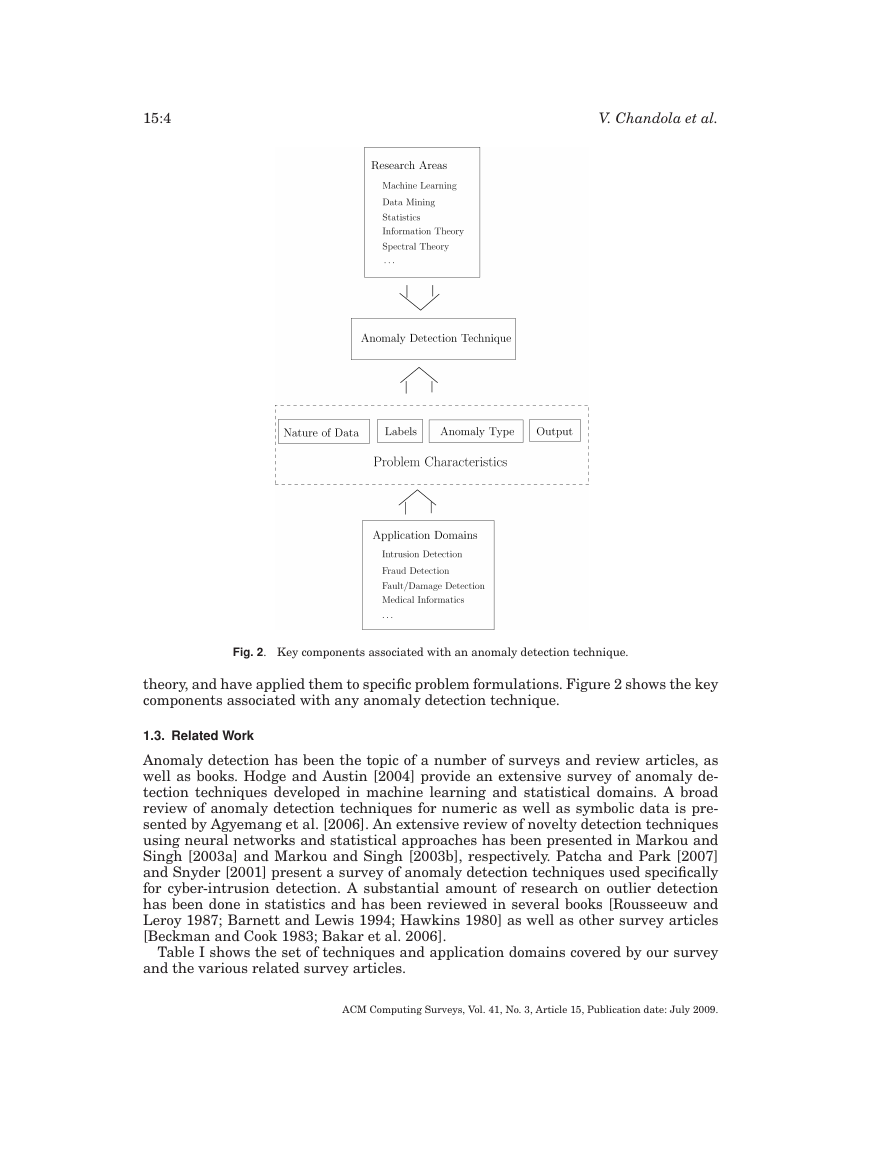
Table I shows the set of techniques and application domains covered by our survey
and the various related survey articles.
ACM Computing Surveys, Vol. 41, No. 3, Article 15, Publication date: July 2009.
�
Anomaly Detection: A Survey
15:5
Table I. Comparison of our Survey to Other Related Survey Articles. 1—Our Survey,
2—Hodge and Austin [2004], 3—Agyemang et al. [2006], 4—Markou and Singh [2003a],
5—Markou and Singh [2003b], 6—Patcha and Park [2007], 7—Beckman and Cook [1983],
8—Bakar et al. [2006]
Techniques
Applications
Classification Based
Clustering Based
Nearest Neighbor Based
Statistical
Information Theoretic
Spectral
Cyber-Intrusion Detection
Fraud Detection
Medical Anomaly Detection
Industrial Damage Detection
Image Processing
Textual Anomaly Detection
Sensor Networks
2
√ √ √ √
1
4
3
√ √ √
√ √ √
√ √ √
√
√
√
√
√
√
√
√
√
5
7
8
√
√ √ √ √
√
6
√
√
√
1.4. Our Contributions
This survey is an attempt to provide a structured and broad overview of extensive
research on anomaly detection techniques spanning multiple research areas and ap-
plication domains.
Most of the existing surveys on anomaly detection either focus on a particu-
lar application domain or on a single research area. Agyemang et al. [2006] and
Hodge and Austin [2004] are two related works that group anomaly detection
into multiple categories and discuss techniques under each category. This survey
builds upon these two works by significantly expanding the discussion in several
directions.
We add two more categories of anomaly detection techniques, information theoretic
and spectral techniques, to the four categories discussed in Agyemang et al. [2006]
and Hodge and Austin [2004]. For each of the six categories, we not only discuss the
techniques, but also identify unique assumptions regarding the nature of anomalies
made by the techniques in that category. These assumptions are critical for determining
when the techniques in that category would be able to detect anomalies, and when they
would fail. For each category, we provide a basic anomaly detection technique, and
then show how the different existing techniques in that category are variants of the
basic technique. This template provides an easier and more succinct understanding of
the techniques belonging to each category. Further, for each category we identify the
advantages and disadvantages of the techniques. We also provide a discussion of the
computational complexity of the techniques since that is an important issue in real
application domains.
While some of the existing surveys mention the different applications of anomaly
detection, we provide a detailed discussion of the application domains where anomaly
detection techniques have been used. For each domain we discuss the notion of an
anomaly, the different aspects of the anomaly detection problem, and the challenges
faced by the anomaly detection techniques. We also provide a list of techniques that
have been applied in each application domain.
The existing surveys discuss anomaly detection techniques that detect the simplest
form of anomalies. We distinguish simple anomalies from complex anomalies. The dis-
cussion of applications of anomaly detection reveals that for most application domains,
the interesting anomalies are complex in nature, while most of the algorithmic research
has focussed on simple anomalies.
ACM Computing Surveys, Vol. 41, No. 3, Article 15, Publication date: July 2009.
�
15:6
V. Chandola et al.
1.5. Organization
This survey is organized into three parts and its structure closely follows Figure 2.
In Section 2, we identify the various aspects that determine the formulation of the
problem and highlight the richness and complexity associated with anomaly detec-
tion. We distinguish simple anomalies from complex anomalies and define two types
of complex anomalies: contextual and collective anomalies. In Section 3, we briefly de-
scribe the different application domains to which anomaly detection has been applied.
In subsequent sections we provide a categorization of anomaly detection techniques
based on the research area to which they belong. A majority of the techniques can
be categorized into classification-based (Section 4), nearest neighbor-based (Section 5),
clustering-based (Section 6), and statistical techniques (Section 7). Some techniques
belong to research areas such as information theory (Section 8), and spectral theory
(Section 9). For each category of techniques we also discuss their computational com-
plexity for training and testing phases. In Section 10 we discuss various contextual
anomaly detection techniques. We present some discussion of the limitations and rel-
ative performance of various existing techniques in Section 11. Section 12 contains
concluding remarks.
2. DIFFERENT ASPECTS OF AN ANOMALY DETECTION PROBLEM
This section identifies and discusses the different aspects of anomaly detection. As men-
tioned earlier, a specific formulation of the problem is determined by several different
factors such as the nature of the input data, the availability or unavailability of labels
as well as the constraints and requirements induced by the application domain. This
section brings forth the richness in the problem domain and justifies the need for the
broad spectrum of anomaly detection techniques.
2.1. Nature of Input Data
A key aspect of any anomaly detection technique is the nature of the input data. Input
is generally a collection of data instances (also referred as object, record, point, vector,
pattern, event, case, sample, observation, or entity) [Tan et al. 2005, Chapter 2]. Each
data instance can be described using a set of attributes (also referred to as variable,
characteristic, feature, field, or dimension). The attributes can be of different types
such as binary, categorical, or continuous. Each data instance might consist of only one
attribute (univariate) or multiple attributes (multivariate). In the case of multivariate
data instances, all attributes might be of same type or might be a mixture of different
data types.
The nature of attributes determines the applicability of anomaly detection tech-
niques. For example, for statistical techniques different statistical models have to be
used for continuous and categorical data. Similarly, for nearest-neighbor-based tech-
niques, the nature of attributes would determine the distance measure to be used.
Often, instead of the actual data, the pairwise distance between instances might be
provided in the form of a distance or similarity matrix. In such cases, techniques that
require original data instances are not applicable, for example, many statistical and
classification-based techniques.
Input data can also be categorized based on the relationship present among data
instances [Tan et al. 2005]. Most of the existing anomaly detection techniques deal
with record data or point data, in which no relationship is assumed among the data
instances.
In general, data instances can be related to each other. Some examples are sequence
data, spatial data, and graph data. In sequence data, the data instances are linearly
ACM Computing Surveys, Vol. 41, No. 3, Article 15, Publication date: July 2009.
�
Anomaly Detection: A Survey
15:7
ordered, for example, time-series data, genome sequences, and protein sequences. In
spatial data, each data instance is related to its neighboring instances, for example,
vehicular traffic data, and ecological data. When the spatial data has a temporal (se-
quential) component it is referred to as spatio-temporal data, for example, climate
data. In graph data, data instances are represented as vertices in a graph and are
connected to other vertices with edges. Later in this section we will discuss situa-
tions where such relationships among data instances become relevant for anomaly
detection.
2.2. Type of Anomaly
An important aspect of an anomaly detection technique is the nature of the desired
anomaly. Anomalies can be classified into following three categories:
2.2.1. Point Anomalies.
If an individual data instance can be considered as anomalous
with respect to the rest of data, then the instance is termed a point anomaly. This is the
simplest type of anomaly and is the focus of majority of research on anomaly detection.
For example, in Figure 1, points o1 and o2, as well as points in region O3, lie outside
the boundary of the normal regions, and hence are point anomalies since they are
different from normal data points.
As a real-life example, consider credit card fraud detection. Let the data set cor-
respond to an individual’s credit card transactions. For the sake of simplicity, let us
assume that the data is defined using only one feature: amount spent. A transaction
for which the amount spent is very high compared to the normal range of expenditure
for that person will be a point anomaly.
2.2.2. Contextual Anomalies.
If a data instance is anomalous in a specific context, but
not otherwise, then it is termed a contextual anomaly (also referred to as conditional
anomaly [Song et al. 2007]).
The notion of a context is induced by the structure in the data set and has to be
specified as a part of the problem formulation. Each data instance is defined using the
following two sets of attributes:
(1) Contextual attributes. The contextual attributes are used to determine the context
(or neighborhood) for that instance. For example, in spatial data sets, the longitude
and latitude of a location are the contextual attributes. In time-series data, time
is a contextual attribute that determines the position of an instance on the entire
sequence.
(2) Behavioral attributes. The behavioral attributes define the noncontextual charac-
teristics of an instance. For example, in a spatial data set describing the average
rainfall of the entire world, the amount of rainfall at any location is a behavioral
attribute.
The anomalous behavior is determined using the values for the behavioral attributes
within a specific context. A data instance might be a contextual anomaly in a given
context, but an identical data instance (in terms of behavioral attributes) could be
considered normal in a different context. This property is key in identifying contextual
and behavioral attributes for a contextual anomaly detection technique.
Contextual anomalies have been most commonly explored in time-series data
[Weigend et al. 1995; Salvador and Chan 2003] and spatial data [Kou et al. 2006;
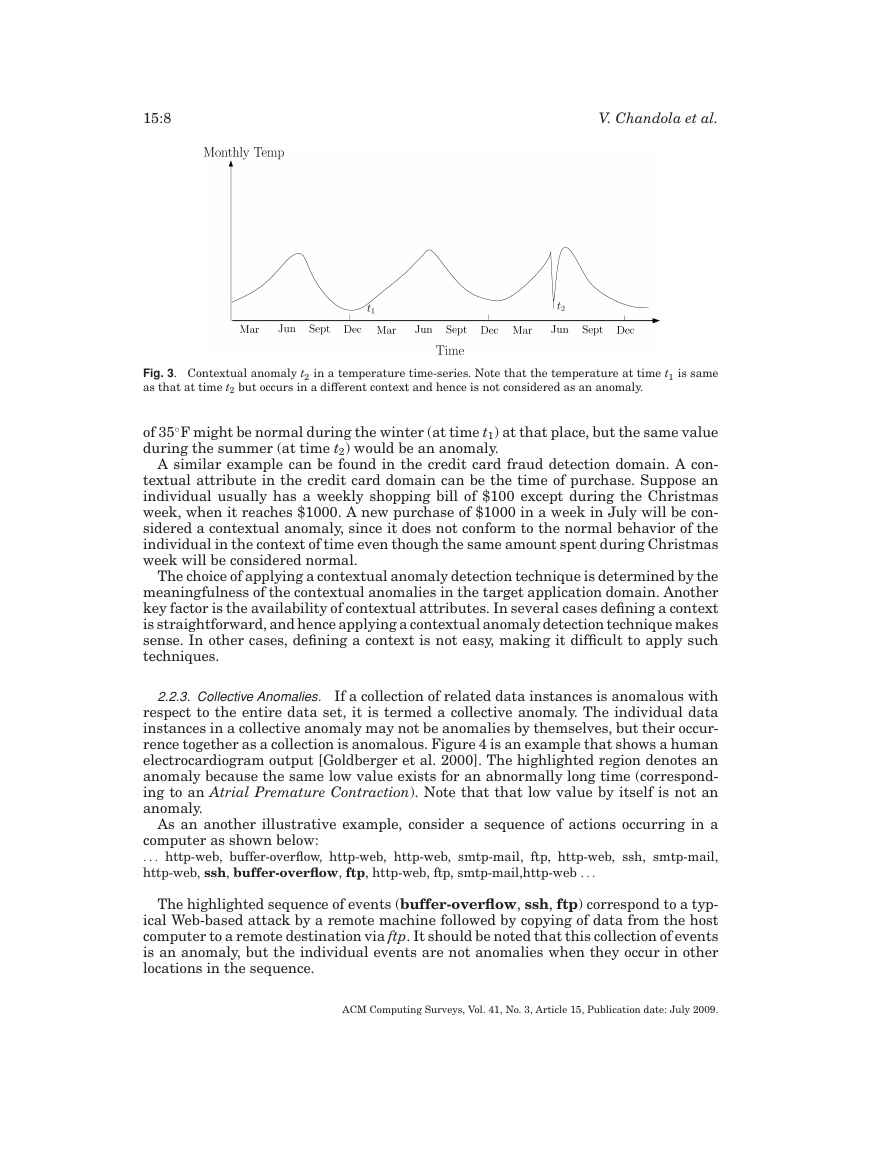
Shekhar et al. 2001]. Figure 3 shows one such example for a temperature time-series
that shows the monthly temperature of an area over the last few years. A temperature
ACM Computing Surveys, Vol. 41, No. 3, Article 15, Publication date: July 2009.
�
15:8
V. Chandola et al.
Fig. 3. Contextual anomaly t2 in a temperature time-series. Note that the temperature at time t1 is same
as that at time t2 but occurs in a different context and hence is not considered as an anomaly.
◦
F might be normal during the winter (at time t1) at that place, but the same value
of 35
during the summer (at time t2) would be an anomaly.
A similar example can be found in the credit card fraud detection domain. A con-
textual attribute in the credit card domain can be the time of purchase. Suppose an
individual usually has a weekly shopping bill of $100 except during the Christmas
week, when it reaches $1000. A new purchase of $1000 in a week in July will be con-
sidered a contextual anomaly, since it does not conform to the normal behavior of the
individual in the context of time even though the same amount spent during Christmas
week will be considered normal.
The choice of applying a contextual anomaly detection technique is determined by the
meaningfulness of the contextual anomalies in the target application domain. Another
key factor is the availability of contextual attributes. In several cases defining a context
is straightforward, and hence applying a contextual anomaly detection technique makes
sense. In other cases, defining a context is not easy, making it difficult to apply such
techniques.
2.2.3. Collective Anomalies.
If a collection of related data instances is anomalous with
respect to the entire data set, it is termed a collective anomaly. The individual data
instances in a collective anomaly may not be anomalies by themselves, but their occur-
rence together as a collection is anomalous. Figure 4 is an example that shows a human
electrocardiogram output [Goldberger et al. 2000]. The highlighted region denotes an
anomaly because the same low value exists for an abnormally long time (correspond-
ing to an Atrial Premature Contraction). Note that that low value by itself is not an
anomaly.
As an another illustrative example, consider a sequence of actions occurring in a
computer as shown below:
. . . http-web, buffer-overflow, http-web, http-web, smtp-mail, ftp, http-web, ssh, smtp-mail,
http-web, ssh, buffer-overflow, ftp, http-web, ftp, smtp-mail,http-web . . .
The highlighted sequence of events (buffer-overflow, ssh, ftp) correspond to a typ-
ical Web-based attack by a remote machine followed by copying of data from the host
computer to a remote destination via ftp. It should be noted that this collection of events
is an anomaly, but the individual events are not anomalies when they occur in other
locations in the sequence.
ACM Computing Surveys, Vol. 41, No. 3, Article 15, Publication date: July 2009.
�



 2023年江西萍乡中考道德与法治真题及答案.doc
 2012年重庆南川中考生物真题及答案.doc
 2013年江西师范大学地理学综合及文艺理论基础考研真题.doc
 2020年四川甘孜小升初语文真题及答案I卷.doc
 2020年注册岩土工程师专业基础考试真题及答案.doc
 2023-2024学年福建省厦门市九年级上学期数学月考试题及答案.doc
 2021-2022学年辽宁省沈阳市大东区九年级上学期语文期末试题及答案.doc
 2022-2023学年北京东城区初三第一学期物理期末试卷及答案.doc
 2018上半年江西教师资格初中地理学科知识与教学能力真题及答案.doc
 2012年河北国家公务员申论考试真题及答案-省级.doc
 2020-2021学年江苏省扬州市江都区邵樊片九年级上学期数学第一次质量检测试题及答案.doc
 2022下半年黑龙江教师资格证中学综合素质真题及答案.doc