GSAS/EXPGUI Alumina Tutorial Intro
Home
Instruments
Science
Experiments
SiteMap
GSAS/EXPGUI Alumina example (Intro)
What's this all about?
The goal of Rietveld analysis is to fit a structural model ("crystal structure") to powder diffraction data. To do this requires determining the
structural parameters [unit cell, atom positions and displacement (thermal) parameters, etc.] for all crystalline phases present, as well as a variety of
instrumental and sample parameters that describe the experimental and sample conditions: scale factors, peak broadening, the background,
preferred orientation, etc. In most cases Rietveld analysis is performed to determine the structural parameters, but increasingly, the method is also
used to determine relative amounts of the crystallographic phases, the amount and type of peak broadening, the preferred orientation, or similar
types of sample characterization.
This exercise provides a tutorial example of how to use the GSAS software package with the EXPGUI interface to perform Rietveld analysis. The
material chosen for this exercise, corundum (aka alumina, sapphire or ruby), has a simple structure, so the starting coordinates have been distorted
so that there is an improvement obtained by performing the fit. Likewise, this sample exhibited virtually no sample-related broadening, so the
instrumental peak profile was altered so that the peak profile terms would not agree with the data, again so that the exercise would demonstrate the
sorts of steps needed for typical Rietveld refinements. The tutorial consists of 11 web pages, each has a series of related steps. There are also
editorial comments, that explain a point further or explain how these steps might be applied differently in another case. These comments are in
specified in italic type.
Rietveld analysis works using non-linear least-squares fitting to optimize (refine) parameters. This means that we must start with approximate
values for all parameters that will be fit. We then allow the software to optimize a small subset of the parameters -- a minimal number of
parameters that must be fit before any progress can be made. Slowly, additional parameters are selected to be refined, until all parameters in the
model (if the data support that) are refined. Despite the simplicity of the material, this exercise demonstrates many of the procedures needed for
more complex materials.
EXPGUI and GSAS run on Windows, Linux and IRIX (Silicon Graphics computers). The example figures show in this tutorial were generated in
Unix, but virtually all GSAS and EXPGUI operation is identical between Unix and Windows. Note also that the appearance of EXPGUI changes
slightly as new features are added. The screen images do not exactly match the current version of EXPGUI.
Getting Started
To perform this tutorial on your own computer, you will need to have GSAS and EXPGUI loaded on your computer (see installation links on the
EXPGUI home page). You will also need three files that are referenced in the following web pages:
l
The Raw data: al2o3001.gsa
l
The instrument parameter file: bt1demo.ins
l
A CIF file with unit cell and atomic parameters: alumina.cif
These three files can be downloaded as a single .ZIP file, or accessed via anonymous ftp from site ftp.ncnr.nist.gov in directory
/pub/cryst/gsas/tutorials
Note: While it is possible to have your working GSAS files (i.e. the .EXP file, etc.) in a separate directory from the raw data
file(s), I discourage this practice, as it then becomes quite difficult to later copy or move the .EXP file from one directory or
computer to another. For this reason, I suggest copying these files into the directory where you will keep your GSAS files.
http://www.ncnr.nist.gov/xtal/software/expgui/tutorial3/merged.html (1 of 32) [4/16/2003 1:06:08 PM]
�
GSAS/EXPGUI Alumina Tutorial Intro
Tutorial Outline
1.
Create a GSAS Experiment File
2.
Adding a phase
3.
Specifying Powder Diffraction Data (Adding a Histogram)
4.
Changing the Background Function
5.
Initial Fitting: Refine Scale Factor and Background
6.
Plotting the Initial Fit
7.
Fitting the Unit Cell
8.
Fitting the Diffractometer Zero Correction
9.
Initial Fitting of Profile Parameters
10.
Group Uiso parameters & Refine coordinates and Overall Uiso
11.
Finishing Up
Sample files
l
al2o3001.gsa -- the alumina neutron diffraction data
l
bt1demo.ins -- the instrument parameter file
l
alumina.cif -- a CIF file with unit cell and atomic parameters:
Acknowledgments
GSAS is written by Allen C. Larson and Robert B. Von Dreele, MS-H805, Los Alamos National Laboratory, Los Alamos, NM 87545. Problems,
questions or kudos concerning GSAS should be sent to Robert B. Von Dreele at vondreele@anl.gov
GSAS is Copyright, 1984-2003, The Regents of the University of California. The GSAS software was produced under a U.S. Government contract
(W-7405-ENG-36) by the Los Alamos National Laboratory, which is operated by the University of California for the U.S. Department of Energy.
The U.S. Government is licensed to use, reproduce, and distribute this software. Permission is granted to the public to copy and use this software
without charge, provided that this notice and any statement of authorship are reproduced on all copies. Neither the Government nor the University
makes any warranty, express or implied, or assumes any liability or responsibility for the use of this software.
EXPGUI is written by Brian H. Toby of the NIST Center for Neutron Research, Brian.Toby@NIST.GOV
EXPGUI is not subject to copyright. Have fun with it.
Neither the U.S. Government nor any author makes any warranty, expressed or implied, or assumes any liability or responsibility for the use of this
information or the software described here. Brand names cited here are used for identification purposes and do not constitute an endorsement by
NIST.
GSAS/EXPGUI Alumina tutorial (part 1)
Creating an Experiment File
For this exercise we will use the EXPGUI interface to access the features of GSAS. The method used to start EXPGUI depends on what type of
computer you are using. On Windows, EXPGUI is typically started by clicking on the appropriate desktop icon, or by selecting an entry in the
START menu. In Unix, it is typically started by typing the command expgui in a Unix terminal window (it is also possible to create icons & menu
entries in some versions of Unix).
http://www.ncnr.nist.gov/xtal/software/expgui/tutorial3/merged.html (2 of 32) [4/16/2003 1:06:09 PM]
�
GSAS/EXPGUI Alumina Tutorial Intro
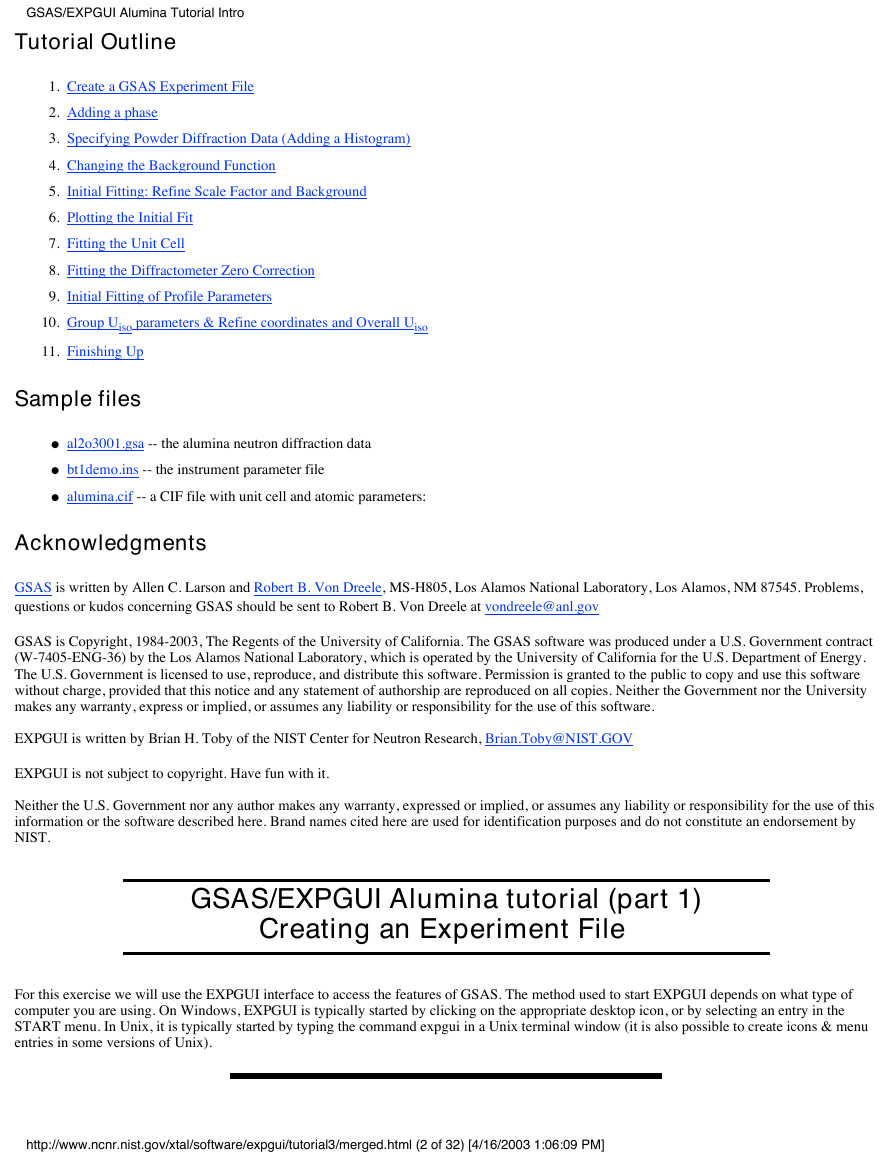
In all platforms, once EXPGUI has been started, a GSAS Experiment (.EXP) file must be
selected. The window shown to the right is opened when EXPGUI is started, where file to be
used is selected. The .EXP file is the heart of a GSAS project. While other files are used by
GSAS programs, all structural information and control parameters are contained within this
file.
The first step in this tutorial is to select the directory where the al2o3001.gsa, bt1demo.ins and
alumina.cif files were placed. Do this by clicking on the "Directory" button at the top of the
window, or by navigating up and down the directory tree by clicking on the "
" or
individual directory names. Clicking on the folder icon with an arrow on it (to the right of the
directory button) has the same effect as the "" entry.
Once the correct directory has been located, the next step is to create a new, empty, .EXP file.
To do this, the file name we wish to use (corundum) is typed into the bottom box of the file
selection window. Note that the capitalization you use here does not matter and .EXP is added
by default. After the name has been entered press the "Read" button or press the keyboard
"Enter" key.
To make sure that you really intend to create a new Experiment file, rather than
the more common task of opening a previous file, the warning message to the right
is displayed and you must click on the "Create" button to continue.
At this point, you are prompted to provide an overall title for the experiment file. Enter
anything you would like (preferably something that will remind you what you were
doing a year from now, when you try to figure out what this strange file was for. When
you have finished entering information, press the "Set" button.
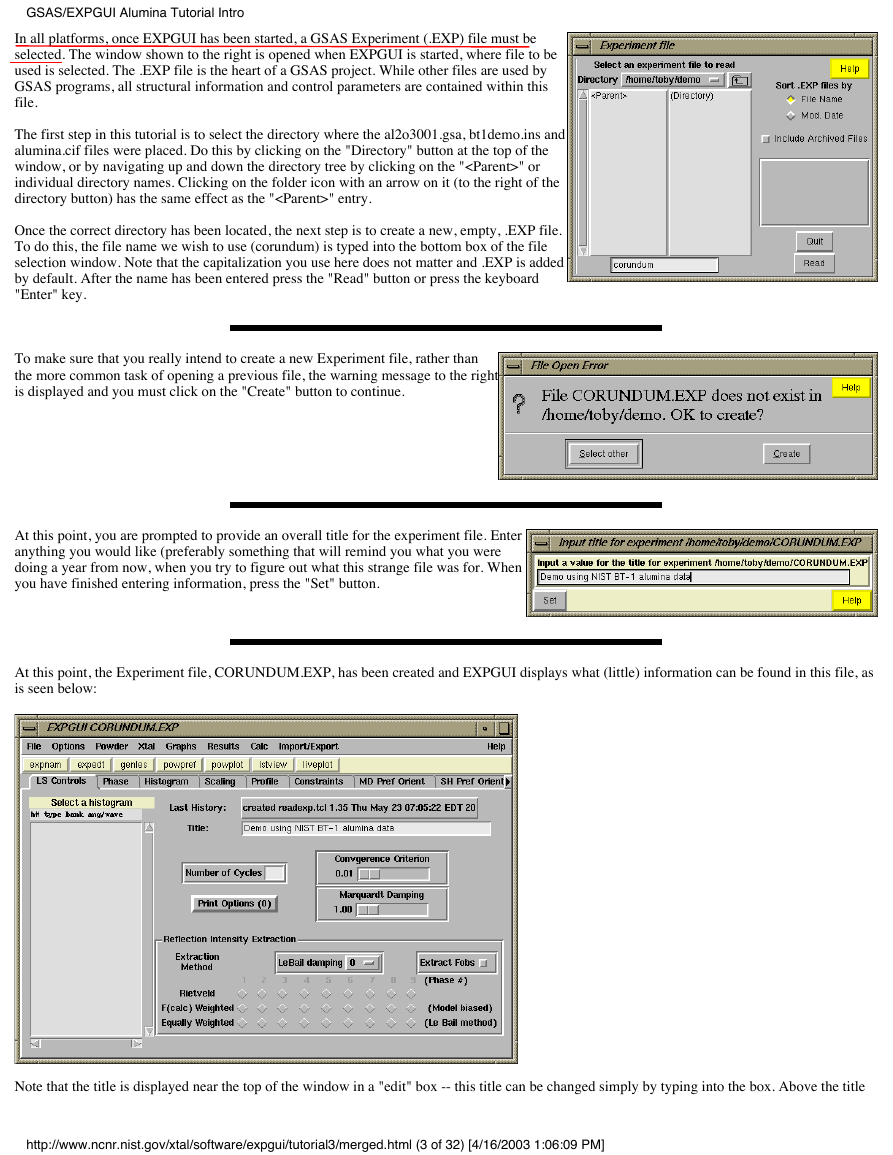
At this point, the Experiment file, CORUNDUM.EXP, has been created and EXPGUI displays what (little) information can be found in this file, as
is seen below:
Note that the title is displayed near the top of the window in a "edit" box -- this title can be changed simply by typing into the box. Above the title
http://www.ncnr.nist.gov/xtal/software/expgui/tutorial3/merged.html (3 of 32) [4/16/2003 1:06:09 PM]
�GSAS/EXPGUI Alumina Tutorial Intro
is the last "history record." GSAS records a history record each time a program is run that modifies the .EXP file and this information is displayed
here. In the next step we will start adding information to this experiment file.
GSAS/EXPGUI Alumina tutorial (part 2)
Adding a phase
When a GSAS experiment file is first created, a fair amount of information must be supplied before the refinement of parameters can be started. At
a minimum, a crystallographic phase must be defined, a set of diffraction data must be loaded and a starting values for experimental parameters
must be defined. Fortunately, this can be a fairly simple operation with GSAS and EXPGUI.
This page shows how a crystallographic phase is specified in EXPGUI. For a mixture, this step would be repeated for each crystallographic phase.
If an impurity is identified in a later stage of the refinement, this step can be run at that point to define this additional crystallographic phase. GSAS
allows up to nine crystallographic phases to be included in a model.
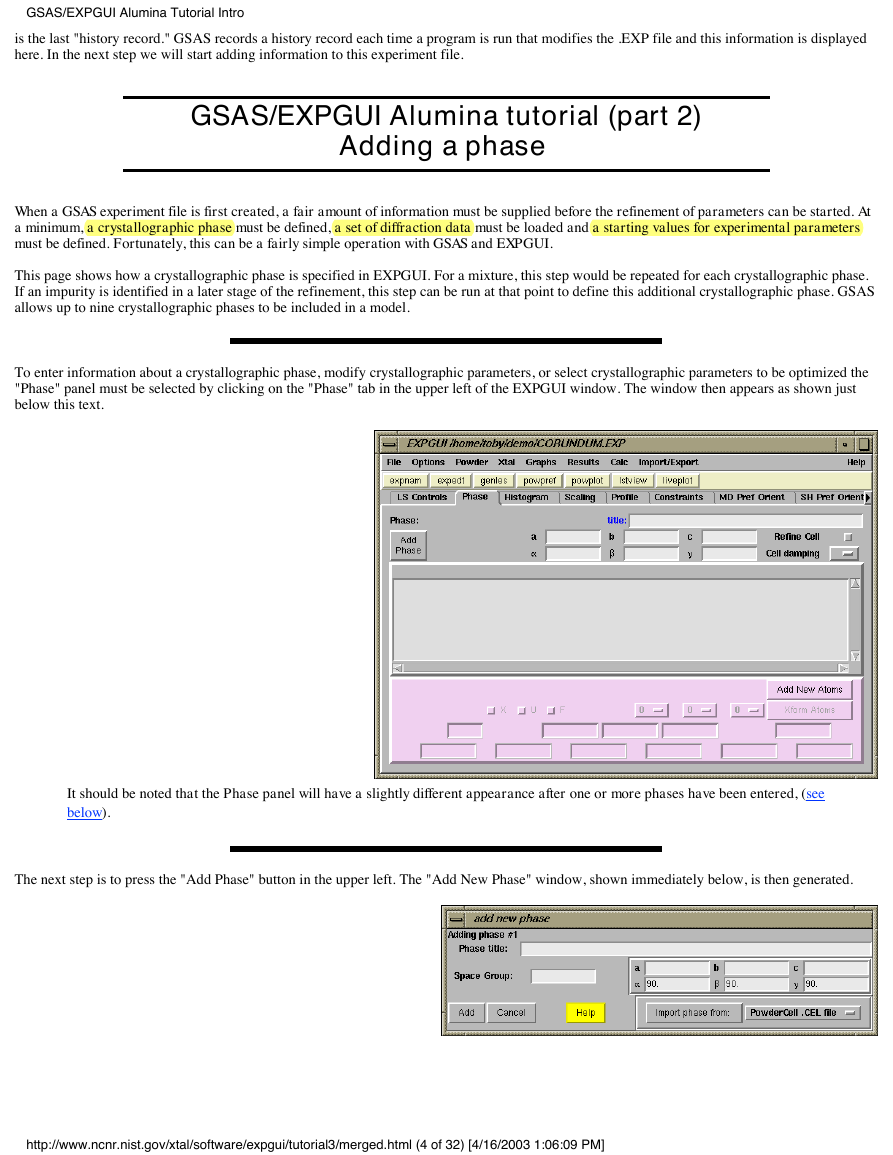
To enter information about a crystallographic phase, modify crystallographic parameters, or select crystallographic parameters to be optimized the
"Phase" panel must be selected by clicking on the "Phase" tab in the upper left of the EXPGUI window. The window then appears as shown just
below this text.
It should be noted that the Phase panel will have a slightly different appearance after one or more phases have been entered, (see
below).
The next step is to press the "Add Phase" button in the upper left. The "Add New Phase" window, shown immediately below, is then generated.
http://www.ncnr.nist.gov/xtal/software/expgui/tutorial3/merged.html (4 of 32) [4/16/2003 1:06:09 PM]
�
GSAS/EXPGUI Alumina Tutorial Intro
Information about the phase can be added directly into the boxes, or phase information can be read from a file.
For this exercise, we will read unit cell parameters, the space group and atom parameters from a CIF file. This
means that we need to select the "Crystallographic Information File (CIF)" format from the options by pressing
the file format button in the lower right-hand corner.
When the "Import Phase from" button is pressed, an "open file" window is created (this window has a slightly different appearance, but the same
function in Windows). On this window, the file to be read is selected, and then the "Read" button is pressed.
The CIF is then read and the unit cell information is included in the appropriate entry boxes, as shown below. If this input is acceptable, press
"Continue".
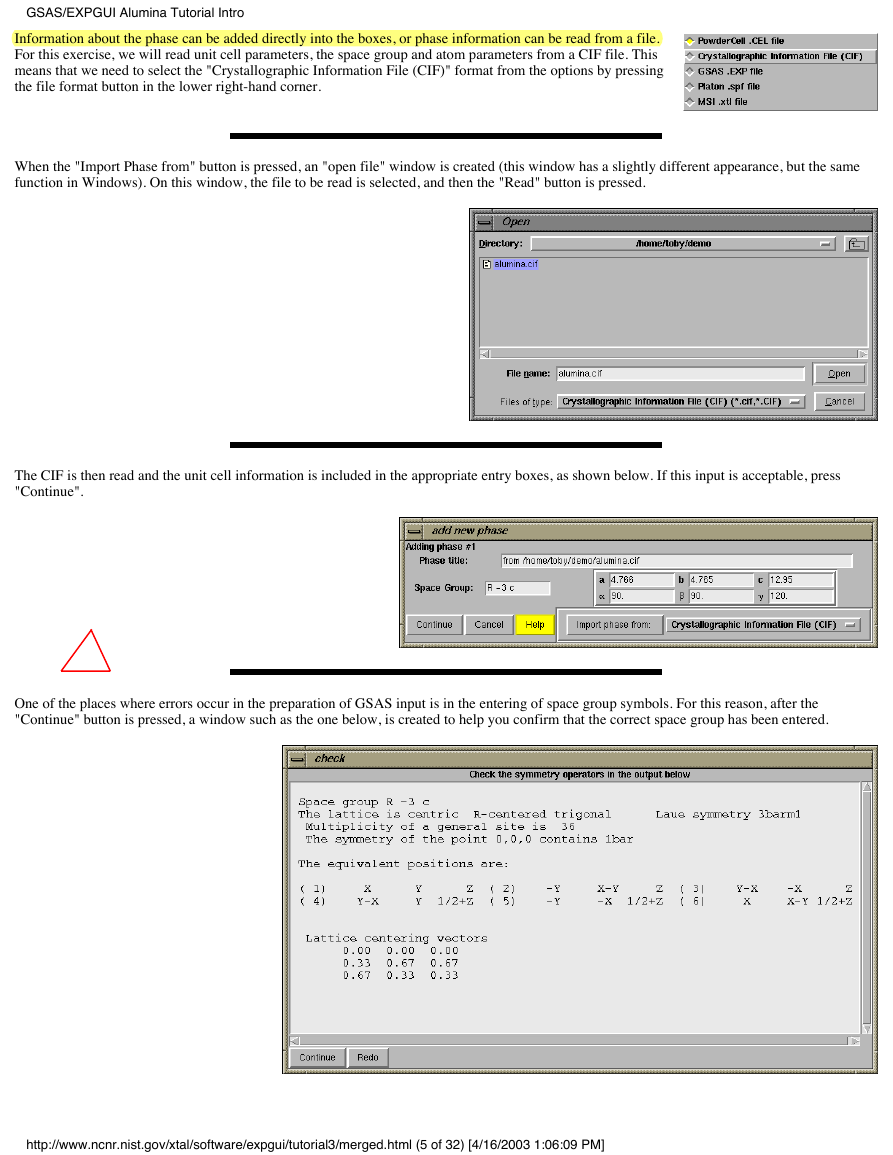
One of the places where errors occur in the preparation of GSAS input is in the entering of space group symbols. For this reason, after the
"Continue" button is pressed, a window such as the one below, is created to help you confirm that the correct space group has been entered.
http://www.ncnr.nist.gov/xtal/software/expgui/tutorial3/merged.html (5 of 32) [4/16/2003 1:06:09 PM]
�
GSAS/EXPGUI Alumina Tutorial Intro
It is recommended that you read through this information to check that this is correct. As an example of a possible error, if one
entered the corundum example in the rhombohedral setting, rather than the hexagonal setting, then the space group should be
entered as "R -3 c R" (where the final R indicates the rhombohedral setting). The listing of lattice centering vectors is only
appropriate for the hexagonal (centered) cell.
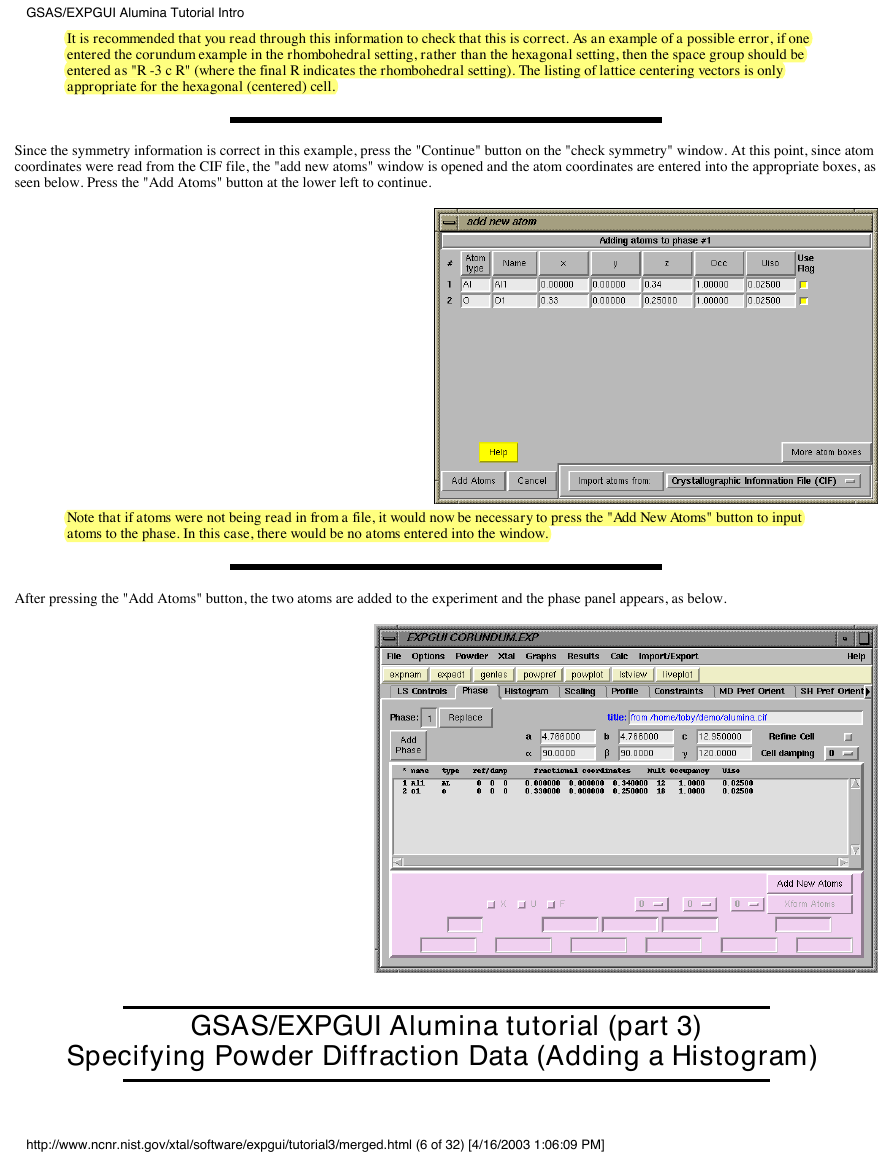
Since the symmetry information is correct in this example, press the "Continue" button on the "check symmetry" window. At this point, since atom
coordinates were read from the CIF file, the "add new atoms" window is opened and the atom coordinates are entered into the appropriate boxes, as
seen below. Press the "Add Atoms" button at the lower left to continue.
Note that if atoms were not being read in from a file, it would now be necessary to press the "Add New Atoms" button to input
atoms to the phase. In this case, there would be no atoms entered into the window.
After pressing the "Add Atoms" button, the two atoms are added to the experiment and the phase panel appears, as below.
GSAS/EXPGUI Alumina tutorial (part 3)
Specifying Powder Diffraction Data (Adding a Histogram)
http://www.ncnr.nist.gov/xtal/software/expgui/tutorial3/merged.html (6 of 32) [4/16/2003 1:06:09 PM]
�
GSAS/EXPGUI Alumina Tutorial Intro
GSAS uses the term "histogram" to refer to a diffraction data set. A histogram can also be a set of "soft constraints," e.g. a set of target
parameters, such as bond distances, that the model will also try to fit. GSAS can fit a model to up to 99 histograms simultaneously, although the
majority of refinements done in GSAS use a single histogram or at most only a few histograms. GSAS can use single crystal or powder diffraction
data, either neutron or x-ray. For neutron powder diffraction data, the data can be obtained from either time-of-flight (TOF) or constant
wavelength (CW) instruments. GSAS can use x-ray data from synchrotron, laboratory alpha-1,2, and even energy-dispersive x-ray instruments.
Two files are needed to load a powder diffraction histogram. The first is a file containing the powder diffraction data, often called a GSAS raw
data file (often using the extension .RAW, .GSA or .GSAS) and the second file is an instrument parameter file (.INS or .INST) that defines what type
of data is included in the raw file (x-ray/neutron, CW/TOF/ED, etc.) as well as starting values for the diffractometer constants and peak shape
parameters. There are a number of available formats for the raw data files and types of records in the instrument parameter file; this information
is defined in the GSAS documentation. Note that raw data files can contain more than one set of data and that an instrument parameter file can
contain more than one set of parameters. This feature is rarely used, with the exception of TOF instrumentation, where detectors are grouped into
banks and the results for each bank are included in a single file. Software for translating diffraction data into a format accepted by GSAS is
available at most user facilities or can be found at the CCP14 web site Appropriate instrument parameter files can usually be provided by the
instrument scientist at a user facility or prototypes can be found in the GSAS distribution files.
This web page demonstrates how the alumina powder diffraction data are now added to the experiment file. For this tutorial exercise, a special
instrument parameter file that has peak shape values narrower than the actual instrument is provided. The tutorial would be less challenging if the
appropriate instrument parameter file is used.
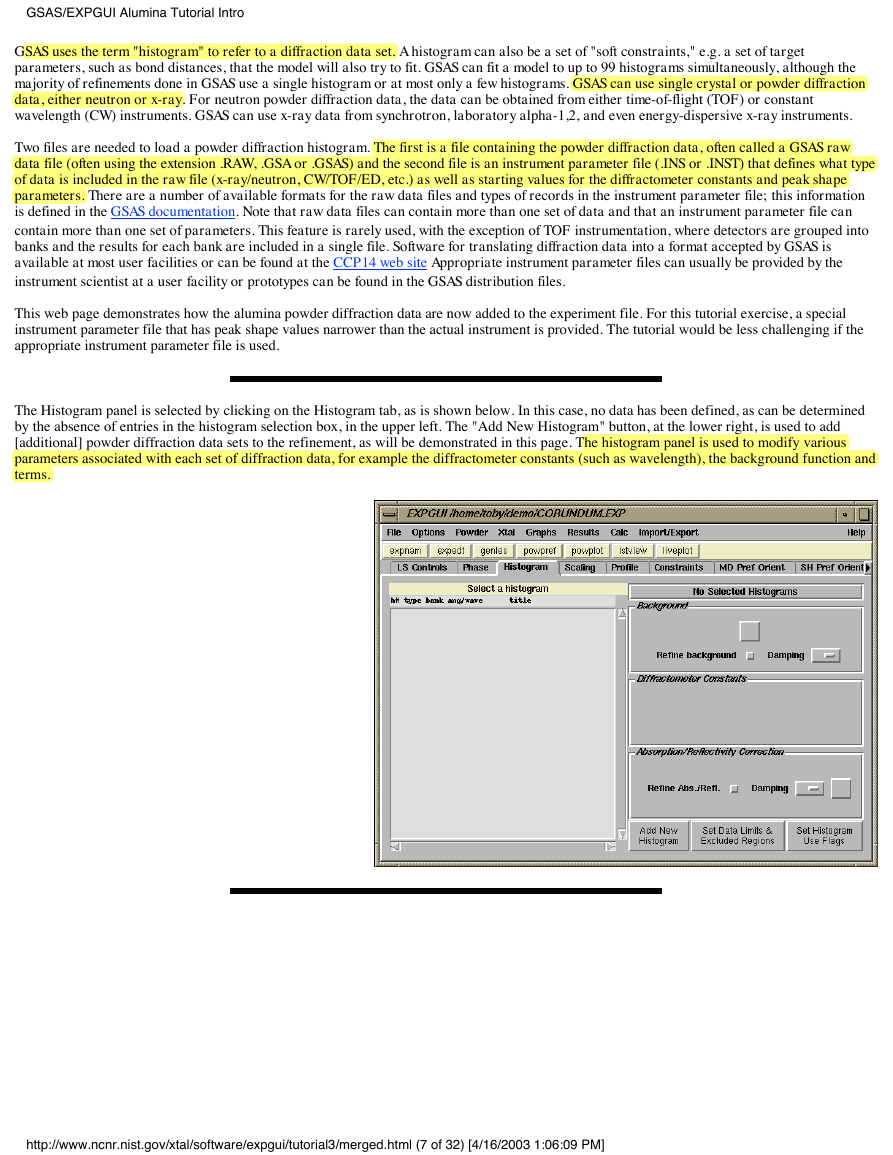
The Histogram panel is selected by clicking on the Histogram tab, as is shown below. In this case, no data has been defined, as can be determined
by the absence of entries in the histogram selection box, in the upper left. The "Add New Histogram" button, at the lower right, is used to add
[additional] powder diffraction data sets to the refinement, as will be demonstrated in this page. The histogram panel is used to modify various
parameters associated with each set of diffraction data, for example the diffractometer constants (such as wavelength), the background function and
terms.
http://www.ncnr.nist.gov/xtal/software/expgui/tutorial3/merged.html (7 of 32) [4/16/2003 1:06:09 PM]
�
GSAS/EXPGUI Alumina Tutorial Intro
Pressing the "Add New Histogram" button causes the "add new histogram" window, shown to
the right, to be displayed. The entries on this window are usually considered from top to bottom.
The "Dummy Histogram" option is used to simulate powder diffraction data, and is not used in
this tutorial example. So the next item of interest is to select a data file. This is done by pressing
the upper of the two "Select File" buttons.
Pressing the "Select File" button creates a file open window, such as the one to the
right (or slightly different in appearance in windows). Select the input file for this
exercise, the file you downloaded earlier, al2o3001.gsa. Double-click on the entry, or
select is and press the "Open" button. This open window will then close.
Selecting the raw data file in the open window causes the al2o3001.gsa file to be loaded into the
upper box on the "add new histogram" window. This file is scanned to and check mark entries
are created for each bank in the file. The al2o3001.gsa file also defines a default instrument
parameter file, which is the bt1demo.ins that was downloaded earlier, so this file name is entered
into the "Instrument Parameter File" section.
The "Usable data limit" sets the maximum range of data to be used in fitting. This is usually
determined by plotting the data to see where no further peaks are present. This can be done here
with the GSAS RAWPLOT program. For this exercise, change the defaulted value (the entire
data range) to 155 degrees, to exclude a single very broad high-angle peak. The press the "Add"
button in the lower left.
After the "Add" button is pressed, the EXPGUI program runs a GSAS program, EXPTOOL, that actually adds the data reference to the experiment.
If an error occurs, this result is shown. If no error occurs, the histogram panel is redisplayed, but this time a histogram appears in the upper left, as
seen below.
http://www.ncnr.nist.gov/xtal/software/expgui/tutorial3/merged.html (8 of 32) [4/16/2003 1:06:09 PM]
�



 2023年江西萍乡中考道德与法治真题及答案.doc
 2012年重庆南川中考生物真题及答案.doc
 2013年江西师范大学地理学综合及文艺理论基础考研真题.doc
 2020年四川甘孜小升初语文真题及答案I卷.doc
 2020年注册岩土工程师专业基础考试真题及答案.doc
 2023-2024学年福建省厦门市九年级上学期数学月考试题及答案.doc
 2021-2022学年辽宁省沈阳市大东区九年级上学期语文期末试题及答案.doc
 2022-2023学年北京东城区初三第一学期物理期末试卷及答案.doc
 2018上半年江西教师资格初中地理学科知识与教学能力真题及答案.doc
 2012年河北国家公务员申论考试真题及答案-省级.doc
 2020-2021学年江苏省扬州市江都区邵樊片九年级上学期数学第一次质量检测试题及答案.doc
 2022下半年黑龙江教师资格证中学综合素质真题及答案.doc