Fault Evaluation and Performance of an
IEEE Bus 30 Power Distribution Network
with Distributed Generation (DG)
Angeles, C.J1, Mercader, E.J.2, Tan, G.E3, Pacis, M.C.4, Bersano Jr. R.F.5
4mikeinmars@yahoo.com
School of Electrical, Electronics and Computer Engineering
Mapua University1,2,3,4
Intramuros, Manila, Philippines
Mindanao State University, Iligan Institute of Technology5
Iligan City, Philippines
Abstract—Due to the penetration of Renewable energy
to the power system which is inevitable, the power
system will experience a drastic change, not only in its
performance but also on the protective settings of
relays. Thus, characterization of faults is necessary to
determine the settings of the protective devices. In this
paper, Fault Characterization studies are used to
determine the performance and the fault values of all of
the busses of the power system but with the impact of
Distributed generation (DG). An IEEE Bus 30 system
is a good selection of power system test case since it
can be easily penetrated by a DG and can be connected
as a mesh network. System performance during steady
state and transient state is analyzed using the ETAP 6.0
software. A thorough investigation is needed so that the
researchers can analyze the effect of DG's in the
protection scheme of the relay settings, circuit breaker
selection and protective device coordination. The
simulation of results indicates that penetration of DG’s
in the network affects the fault current nevertheless
where
fault current
contribution depends on the location of the fault point
to the penetrated DG in the system. Based from the
graph of the DG contribution for different fault
locations, the DG contributes the most fault current
when the fault occurs connected at their respective
busses. When the fault occurs at bus 29, DG 11 has the
least contribution since it is far away from the fault
point. In the summary of fault percentages, the
researchers may say that the worst case of fault current
occurs at Case 17 where Gen 2, Gen5 and Gen13 are
removed in the system.
Index Terms IEEE Bus 30 system, Distributed
Generation, Fault Characterization, ETAP
fault occurs. But
the
the
I. INTRODUCTION
Distributed generation plays a vast part in our power
system. As the demand of electric energy demand goes
978-1-5386-0912-5/17/$31.00 ©2017 IEEE
to
these
fulfill
vague, there is a significant increase of distributed
generation
necessities.
Interconnection of DG on power system will give a
huge advantage on power generation on remote
areas and will give additional benefits on the grid,
distribution and to the supply. Due to carbon
dioxide reduction goals, many of small sources of
DG are renewable energy sources such as wind
turbines, biomass, solar panels, micro turbines etc.
Large scale integration of DG at MV and LV side
of the system is presented to cover the supply of
some loads. The problem to be solved in this
study is the effect of the high penetration of DG’s
in the performance of the protective devices in a
distribution/sub transmission network connected as
a mesh or loop. The performance of these relay
settings plays a vital role in the selection of a new
protective scheme of the power system with the
inclusion of DG. The introduction of DG’s in the
distribution
of
disadvantages on
the operation, stability and
protection. The change of fault current because of
this additional source will create problems such as
false tripping, out of synchronism problems and
increase and decrease short circuit levels [1]. The
penetration of DG will have a huge impact on
controls, voltage collapse, and protection. The
significance of this study will help to identify
related problems in the power system and will
minimize these issues using the proposed strategies
from the results of this study.
system will
plenty
have
II. REVIEW OF RELATED LITERATURE
I. Traditional Concepts of Power Systems
Generation of electricity was a complex process,
from power plants to transmission and utilization,
these processes is a long way step for the
production of
[2,3]. Distribution
electricity
�
in radial where
Networks are usually connected
majority of consumers are connected. In the radial
connections, the flow of power will be in one direction,
from the power source which is your source, to the
transmission and to the distribution. The first process is
the generation stage, these are your power plants
located remotely from the city because of economics
and environmental concerns. Through the second
process, with the help of substations, transmission lines
and cables, the transmission of electrical energy from
longer distances was executed. The last process is the
distribution systems, the links between the secondary
transmission to primary distribution and where the
power quality of the system takes place [3]. Due to
increasing demand of electrical energy in the society,
electrical source should also increase. Thus, penetration
of distributed generation
this
economical problem. Nowadays, the technological
evolution, environmental policies, the expansion of the
finance and electrical markets, are promoting new
conditions in the sector of the electricity generation.
[4,5].
is a solution
to
III. METHODOLOGY
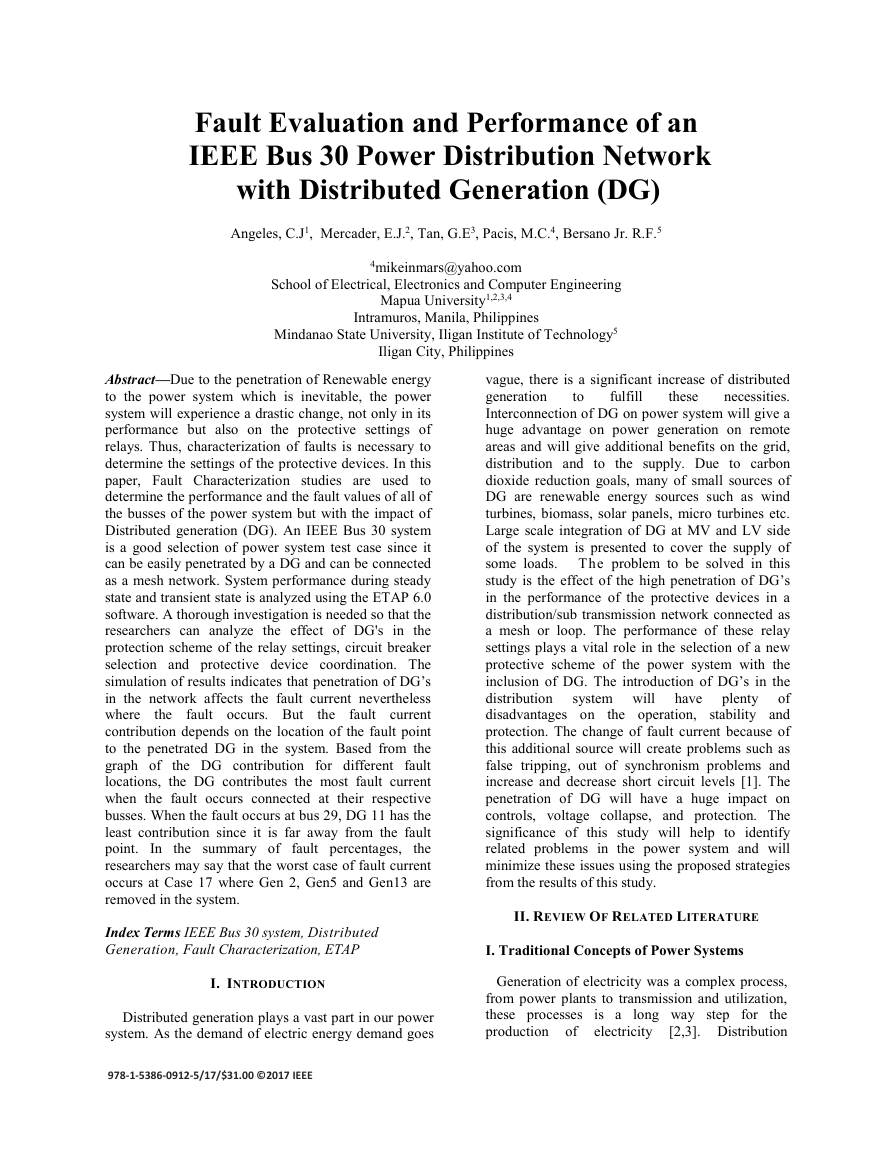
The step by step procedure of the study is given on
Figure 1.
Figure 1. Flowchart of the study
Test System
the study
framework of
The conceptual
is
presented on Figure 1.Using the data from [13], the
IEEE 30 bus system is designed using the ETAP
software. The bus system is a prototype, and real
time systems are designed and developed with
reference to such prototype models. The prototypes
are subjected to contingency analysis and results
were obtained. The load flow analysis and transient
stability for the standard IEEE-30 bus system are
performed. The standard IEEE 30 bus system
consists of 30 buses, 6 generators, 24 loads and 4
transformers. Generator1 is the swing bus and the
other generators are in voltage control mode. The
generators are rated 135kV, with speed 1800 rpm
and with 4 poles. All of the loads in service are 3-
phase and with rated voltage of 135kV. The unit of
the lines have impedances in ohms per kilometer
and the transformers are connected in 3-phase with
rated voltage of 135 kV-140kV.
Software Used
The simulation software used here is the ETAP or
Electrical Transient Stability Analysis Program by
Operation Technology. There are different kinds of
analysis that can be performed using this software
such as Load flow analysis, Short Circuit Analysis,
Arc Flash analysis, Harmonic Analysis and
Transient stability analysis. The one line diagram
for IEEE-30 bus system is drawn using the one line
editor. ETAP is a user friendly graphical electrical
analysis software that can be run on Windows XP
and Microsoft Vista operating systems. The results
of the analysis on the prototype models is used for
real
time simulation, optimization, advanced
monitoring and intelligent load shedding at high
speeds. ETAP allows
to perform
operations like varying the loads, allowing the
system to contingency and study the characteristics
of the faults. These virtual faults in the simulation
model can be compared to the real time system
faults
[6]. The Single Line Diagram was
constructed using the ETAP software.
the user
Load Flow Analysis and Short Circuit Analysis
Load flow analysis also called as power flow
analysis is an important tool for performance
analysis of a power system. The basic knowledge
required to perform load flow analysis of a system
is to understand the one line diagram and the
representation of the components of the power
system in its per unit values.
�
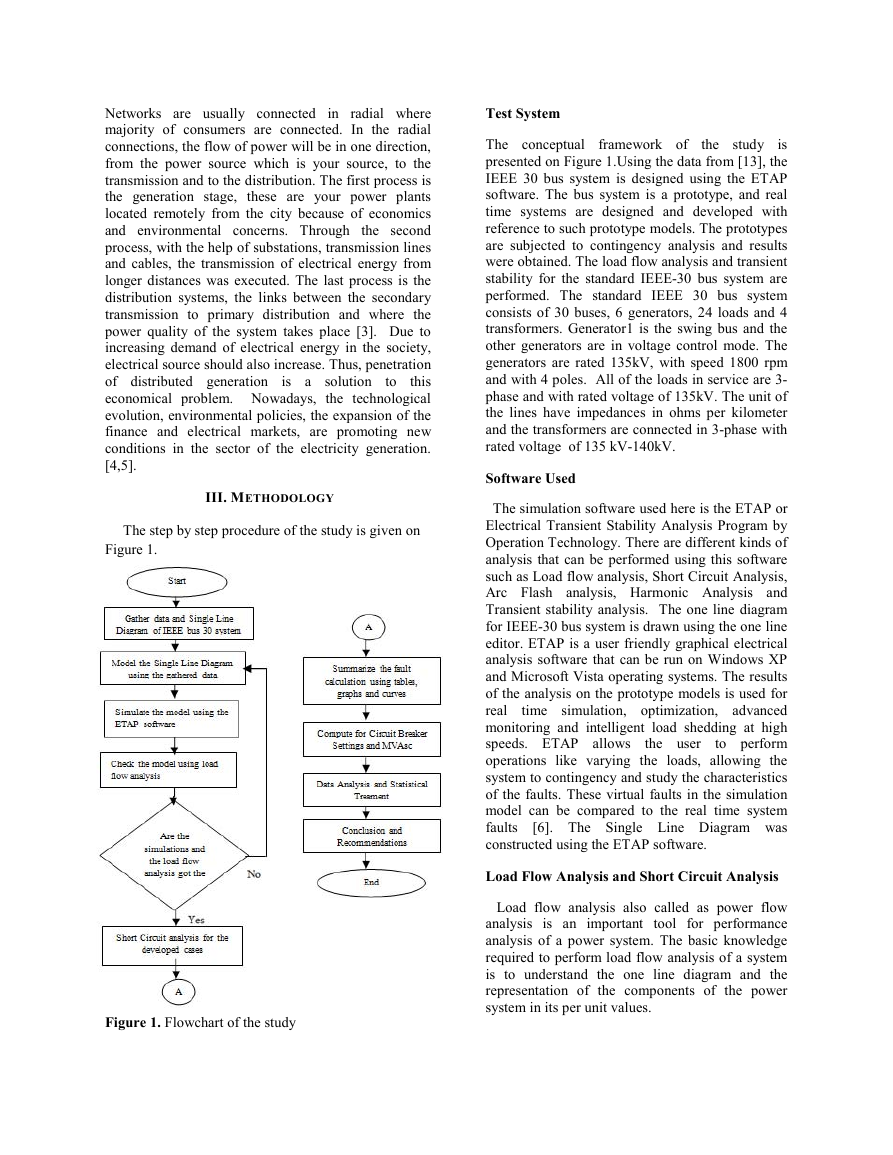
Based on Table 1, 17 cases were presented with the
results of load flow and comprehensive short circuit
study. Fault Studies was limited to shunt faults only
and the comparison for all the cases will be discussed
on Section IV.
Table 1. Power System Cases
Case
1
2
3
4
5
6
7
8
9
10
11
12
13
14
15
16
17
Configurations
No DG
DG 11 Out
DG 12 Out
DG 29 Out
DG 30 Out
Gen 13 Out
Gen 11 Out
Gen 5 Out
Line 27 out
Line 41 out
No Swing Bus
DG 11 and DG 12 Out
DG 12 and Dg 29 Out
DG 29 and DG 30 Out
DG 30 and DG 11 Out
Swing Bus and Gen 8 Out
Gen 2, 5, and 13 Out
Data Gathering:
Computation of the DG’s rating. According to [7]
Pmax = ….. (1)
Qmax = x Pmax …… (2)
It is assume that the maximum production gives the
highest voltage rise. The reactive power at maximum
production is a certain fraction of the active power as
seen on eq (2).
Based on the computation of the DG ratings, the
researchers used a 1000m length with a cross sectional
area of 50 square millimeters as their base length
because the computed power rating was close to the
ratings for the modeled IEEE Bus 30 system [8,9].
IV. RESULTS AND DISCUSSION
After modeling the IEEE Bus 30 system, the
researcher has to compare if the bus voltage result
of the modeled power system is approximately
equal to the IEEE bus 30 system. Using equation 3,
the voltage error was computed and compared to
the reference.
%error =
%diff =
……….(3)
- ……(4)
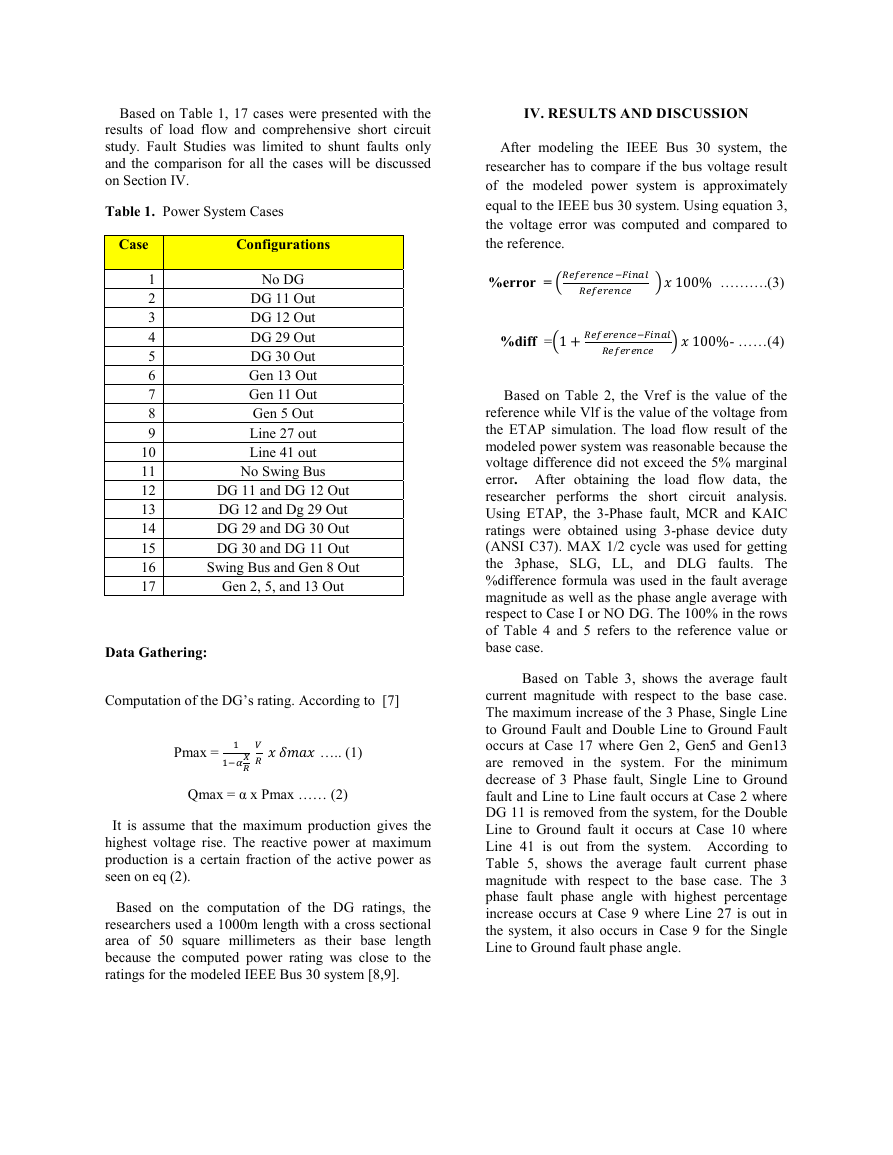
Based on Table 2, the Vref is the value of the
reference while Vlf is the value of the voltage from
the ETAP simulation. The load flow result of the
modeled power system was reasonable because the
voltage difference did not exceed the 5% marginal
error. After obtaining the load flow data, the
researcher performs the short circuit analysis.
Using ETAP, the 3-Phase fault, MCR and KAIC
ratings were obtained using 3-phase device duty
(ANSI C37). MAX 1/2 cycle was used for getting
the 3phase, SLG, LL, and DLG faults. The
%difference formula was used in the fault average
magnitude as well as the phase angle average with
respect to Case I or NO DG. The 100% in the rows
of Table 4 and 5 refers to the reference value or
base case.
Based on Table 3, shows the average fault
current magnitude with respect to the base case.
The maximum increase of the 3 Phase, Single Line
to Ground Fault and Double Line to Ground Fault
occurs at Case 17 where Gen 2, Gen5 and Gen13
are removed in the system. For the minimum
decrease of 3 Phase fault, Single Line to Ground
fault and Line to Line fault occurs at Case 2 where
DG 11 is removed from the system, for the Double
Line to Ground fault it occurs at Case 10 where
Line 41 is out from the system. According to
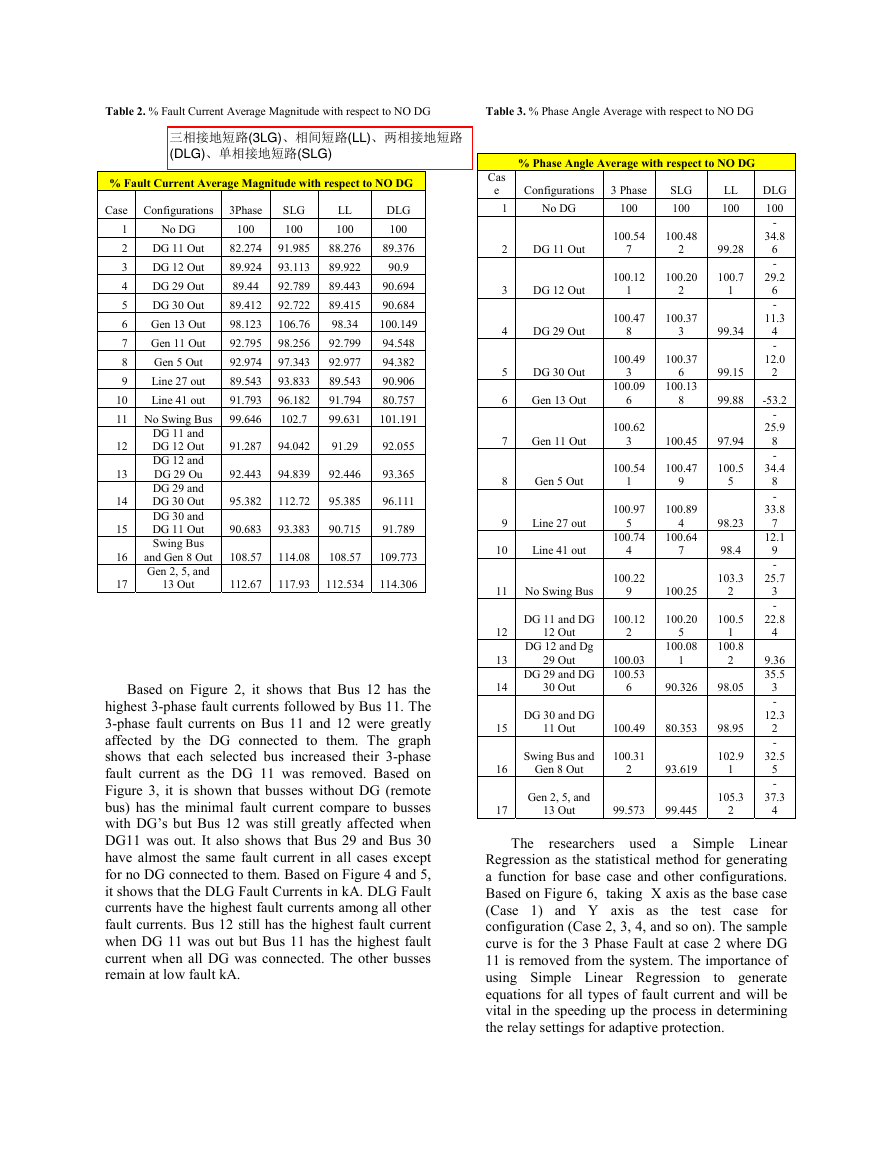
Table 5, shows the average fault current phase
magnitude with respect to the base case. The 3
phase fault phase angle with highest percentage
increase occurs at Case 9 where Line 27 is out in
the system, it also occurs in Case 9 for the Single
Line to Ground fault phase angle.
�
Table 2. % Fault Current Average Magnitude with respect to NO DG
Table 3. % Phase Angle Average with respect to NO DG
% Phase Angle Average with respect to NO DG
Configurations
3 Phase
Cas
e
1
2
3
4
5
6
7
8
9
12
13
14
15
16
17
% Fault Current Average Magnitude with respect to NO DG
No DG
Configurations
Case
1
DG 11 Out
2
DG 12 Out
3
DG 29 Out
4
DG 30 Out
5
Gen 13 Out
6
Gen 11 Out
7
Gen 5 Out
8
Line 27 out
9
10
Line 41 out
11 No Swing Bus
3Phase
100
82.274
89.924
89.44
89.412
98.123
92.795
92.974
89.543
91.793
99.646
SLG
100
91.985
93.113
92.789
92.722
106.76
98.256
97.343
93.833
96.182
102.7
LL
100
88.276
89.922
89.443
89.415
98.34
92.799
92.977
89.543
91.794
99.631
DLG
100
89.376
90.9
90.694
90.684
100.149
94.548
94.382
90.906
80.757
101.191
DG 11 and
DG 12 Out
DG 12 and
DG 29 Ou
DG 29 and
DG 30 Out
DG 30 and
DG 11 Out
Swing Bus
and Gen 8 Out
Gen 2, 5, and
13 Out
12
13
14
15
16
17
91.287
94.042
91.29
92.055
92.443
94.839
92.446
93.365
95.382
112.72
95.385
96.111
90.683
93.383
90.715
91.789
108.57
114.08
108.57
109.773
112.67
117.93
112.534
114.306
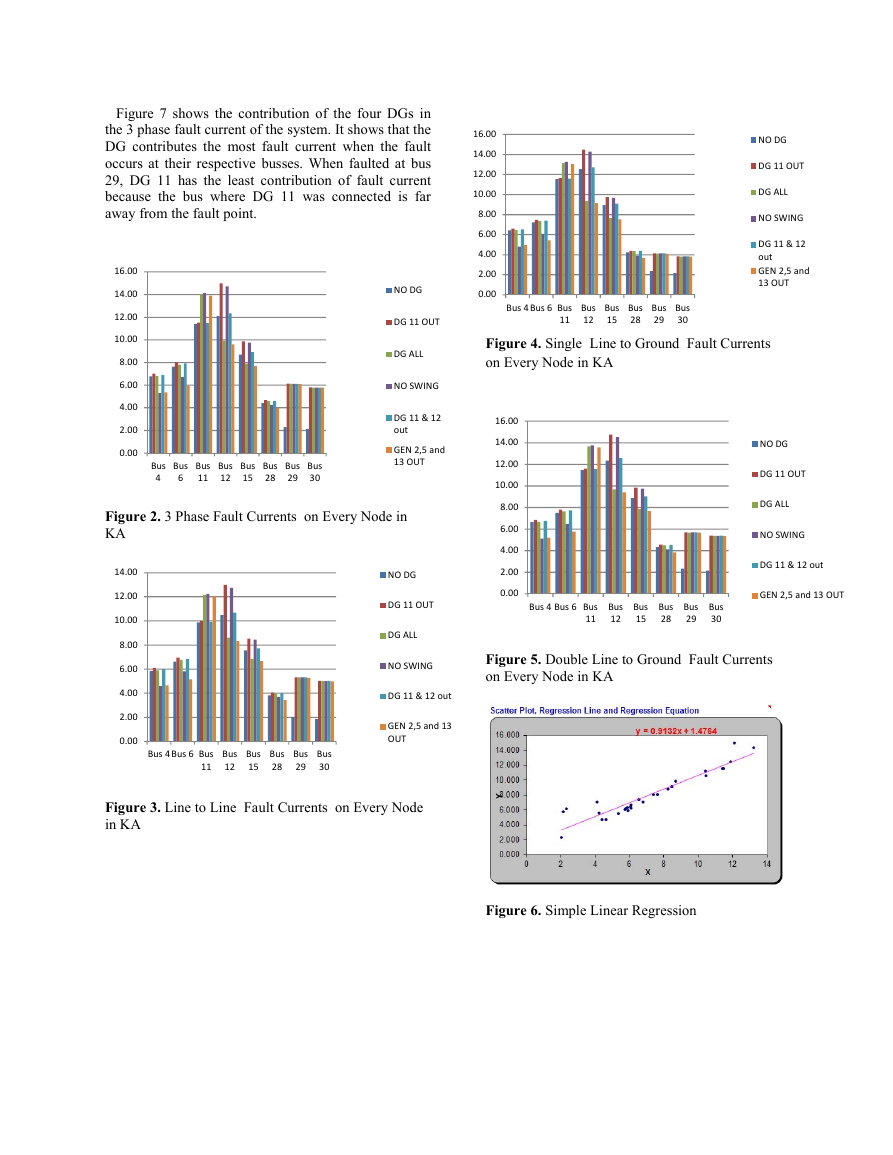
Based on Figure 2, it shows that Bus 12 has the
highest 3-phase fault currents followed by Bus 11. The
3-phase fault currents on Bus 11 and 12 were greatly
affected by the DG connected to them. The graph
shows that each selected bus increased their 3-phase
fault current as the DG 11 was removed. Based on
Figure 3, it is shown that busses without DG (remote
bus) has the minimal fault current compare to busses
with DG’s but Bus 12 was still greatly affected when
DG11 was out. It also shows that Bus 29 and Bus 30
have almost the same fault current in all cases except
for no DG connected to them. Based on Figure 4 and 5,
it shows that the DLG Fault Currents in kA. DLG Fault
currents have the highest fault currents among all other
fault currents. Bus 12 still has the highest fault current
when DG 11 was out but Bus 11 has the highest fault
current when all DG was connected. The other busses
remain at low fault kA.
No DG
DG 11 Out
DG 12 Out
DG 29 Out
DG 30 Out
Gen 13 Out
Gen 11 Out
Gen 5 Out
Line 27 out
SLG
100
100.48
2
100.20
2
100.37
3
100
100.54
7
100.12
1
100.47
8
100.49
100.37
100.09
100.13
3
6
5
4
6
8
4
7
100.62
3
100.54
1
100.45
97.94
100.47
9
100.5
5
100.97
100.89
100.74
100.64
100.22
9
100.12
2
100.03
100.53
6
100.25
100.20
100.08
5
1
10
Line 41 out
11 No Swing Bus
DG 11 and DG
DG 12 and Dg
12 Out
29 Out
30 Out
DG 29 and DG
90.326
98.05
DG 30 and DG
11 Out
100.49
80.353
98.95
Swing Bus and
Gen 8 Out
100.31
2
93.619
102.9
1
LL
100
99.28
100.7
1
99.34
99.15
99.88
98.23
98.4
103.3
2
100.5
1
100.8
2
DLG
100
-
34.8
6
-
29.2
6
-
11.3
4
-
12.0
2
-53.2
-
25.9
8
-
34.4
8
-
33.8
7
12.1
9
-
25.7
3
-
22.8
4
9.36
35.5
3
-
12.3
2
-
32.5
5
-
37.3
4
Gen 2, 5, and
13 Out
99.573
99.445
105.3
2
researchers used a Simple Linear
The
Regression as the statistical method for generating
a function for base case and other configurations.
Based on Figure 6, taking X axis as the base case
(Case 1) and Y axis as
test case for
configuration (Case 2, 3, 4, and so on). The sample
curve is for the 3 Phase Fault at case 2 where DG
11 is removed from the system. The importance of
using Simple Linear Regression
to generate
equations for all types of fault current and will be
vital in the speeding up the process in determining
the relay settings for adaptive protection.
the
�
16.00
14.00
12.00
10.00
8.00
6.00
4.00
2.00
0.00
NO DG
DG 11 OUT
DG ALL
NO SWING
DG 11 & 12
out
GEN 2,5 and
13 OUT
Bus 4 Bus 6 Bus
11
Bus
12
Bus
15
Bus
28
Bus
29
Bus
30
Figure 4. Single Line to Ground Fault Currents
on Every Node in KA
16.00
14.00
12.00
10.00
8.00
6.00
4.00
2.00
0.00
NO DG
DG 11 OUT
DG ALL
NO SWING
DG 11 & 12 out
GEN 2,5 and 13 OUT
Bus 4 Bus 6 Bus
11
Bus
12
Bus
15
Bus
28
Bus
29
Bus
30
Figure 5. Double Line to Ground Fault Currents
on Every Node in KA
Figure 7 shows the contribution of the four DGs in
the 3 phase fault current of the system. It shows that the
DG contributes the most fault current when the fault
occurs at their respective busses. When faulted at bus
29, DG 11 has the least contribution of fault current
because the bus where DG 11 was connected is far
away from the fault point.
16.00
14.00
12.00
10.00
8.00
6.00
4.00
2.00
0.00
Bus
4
Bus
6
Bus
11
Bus
12
Bus
15
Bus
28
Bus
29
Bus
30
NO DG
DG 11 OUT
DG ALL
NO SWING
DG 11 & 12
out
GEN 2,5 and
13 OUT
Figure 2. 3 Phase Fault Currents on Every Node in
KA
14.00
12.00
10.00
8.00
6.00
4.00
2.00
0.00
NO DG
DG 11 OUT
DG ALL
NO SWING
DG 11 & 12 out
GEN 2,5 and 13
OUT
Bus 4 Bus 6 Bus
11
Bus
12
Bus
15
Bus
28
Bus
29
Bus
30
Figure 3. Line to Line Fault Currents on Every Node
in KA
Figure 6. Simple Linear Regression
�
VI. REFERENCES
[1] Yuping Lu, L. H. (2007). A Study on Effect of
Dispersed Generator Capacity on Power System
Protection. IEEE
[2] Angel Fernandez Sarabia, “Impact of distributed
generation on distributied system”, Aalborg University -
Department of Energy Technology Pontoppidanstraede
101 9220 Aalborg East, Denmark Printed in Denmark by
Aalborg University
[3] Mario Vignolo, R. Z. (2002). Transmission Networks
or Distributed Generation?. Montevideo, Uruguay
[4] Philip P. Barker, R. W. (2000). Determining the
Impact of Distributed Generation on Power Systems:
Part 1 - Radial Distribution Systems. 12. IEEE.
Retrieved 02 16, 2011, from IEEE.
[5] Edward Coster, Stedin, Johanna Myrzik and Wil
Kling Eindhoven University of Technology The
Netherlands “Effect of DG on distribution grid
protection”
[6] Stanley Horowitz and Arun Phadke “Power System
Relaying” 3rd Edition, John Wiley and Sons Ltd. 2008
[7] Math H. Bollen,Fainan Hassan.(2011), Integration of
Distributed Generation in the Power System
[8] William Rosehart , Ed Nowicki (24-28 June 2002).
Optical Placement of Distributed Generation, University
of Calgary
[9] R.M. Kamel1 and B. Kermanshahi, Optimal Size and
Location of Distributed Generations for Minimizing
Power Losses in a Primary Distribution Network,
December 2009, Sharif University of Technology
30
29
28
15
12
11
6
4
DG 30
DG 29
DG 12
DG 11
0
0.5
1
1.5
2
2.5
3
Figure 7. DG Contribution For Different Fault
Locations [3 phase DG ALL]
V. CONCLUSIONS
In this study, the system was modeled by the
computer design software called ETAP. After modeling
the IEEE Bus 30 system, the researcher compares the
bus voltage results of the modeled power system to the
IEEE bus 30 system. Based on the results, the load
flow result of
the modeled power system was
reasonable because the voltage difference did not
exceed the 5% marginal error. There were 17 different
cases that were developed in this study and based on
the simulation results, the penetration of DG’s in a
system affects the fault current nevertheless where the
fault occurs. But the fault current contribution depends
on the location of the fault point to the penetrated DG
in the system. Based on the graph of DG contribution
for different fault locations, the DG contributes the
most fault current when the fault occurs connected at
their respective busses. When the fault occurs at bus
29, DG’s 11 has the least contribution since it is far
away from the fault point. The graphs and curves of
different cases show
the
performance of the system given that case 1 as base. In
the summary of fault percentages, the researchers
conclude that the worst case of fault current occurs at
Case 17 where Gen 2, Gen5 and Gen13 are removed in
the system and the best case for the 3 phase fault,
single line to ground fault, line to line fault it occurs at
Case 2 where DG 11 is removed from the system, for
the double line to ground fault it occurs at Case 10
where Line 41 is out from the system.
the drastic change of
�


 2023年江西萍乡中考道德与法治真题及答案.doc
 2012年重庆南川中考生物真题及答案.doc
 2013年江西师范大学地理学综合及文艺理论基础考研真题.doc
 2020年四川甘孜小升初语文真题及答案I卷.doc
 2020年注册岩土工程师专业基础考试真题及答案.doc
 2023-2024学年福建省厦门市九年级上学期数学月考试题及答案.doc
 2021-2022学年辽宁省沈阳市大东区九年级上学期语文期末试题及答案.doc
 2022-2023学年北京东城区初三第一学期物理期末试卷及答案.doc
 2018上半年江西教师资格初中地理学科知识与教学能力真题及答案.doc
 2012年河北国家公务员申论考试真题及答案-省级.doc
 2020-2021学年江苏省扬州市江都区邵樊片九年级上学期数学第一次质量检测试题及答案.doc
 2022下半年黑龙江教师资格证中学综合素质真题及答案.doc