1
The “Grating Diffraction Calculator” (GD-Calc®) is a MATLAB-based,
Optical Simulation of Grating Diffraction in MATLAB®
by Ken Johnson
electromagnetic simulation program that computes diffraction efficiencies of optical
grating structures, including biperiodic gratings. The program’s capabilities include a
general and flexible grating modeling facility, structure parameterization (with any
number of parameters), and unrestricted control over diffraction order selection.
Additionally, its implementation within the generic programming and application
development framework of MATLAB provides a degree of flexibility and software
interoperability that is not available with stand-alone diffraction analysis programs.
Part 1 of this article provides a conceptual overview of GD-Calc, describing in
general terms how grating structure is specified and how electromagnetic computations
are carried out. The presentation is primarily concept-oriented, but a few simple code
examples are provided to give the reader a sense of how the GD-Calc software interface
works. Part 2 provides a more in-depth introduction to the software interface, using as an
example a tungsten photonic crystal structure1 to illustrate how grating structure is
specified. (The code listings from Part 2 are summarized in gdc_intro.m.)
examples for electromagnetic computations are provided in an accompanying document,
GD-Calc_Demo.pdf. (All of the code examples in this article and in GD-Calc_Demo.pdf
can be run with the free demo/tutorial code from the GD-Calc website. The photonic
crystal example is based on the demo script gdc_demo11.m.) The electromagnetic theory
and algorithms underlying GD-Calc are detailed in GD-Calc.pdf.
Part 1: Conceptual Overview
The primary focus of this article is grating structure specification. Application
An advantage of working in the MATLAB environment is that functional links
MATLAB development environment
into and out of GD-Calc can be created without having to rely on cumbersome data
conversion and import/export procedures. For example, in a semiconductor lithography
application, a photoresist grating’s thickness and refractive index might both be affected
by exposure-related resist densification, so it would be natural to specify thickness and
refractive index both as user-defined functions of exposure. This is especially useful with
1 The photonic crystal structure is described in S. Y. Lin, J. G. Fleming, and I. El-Kady, “Highly efficient
light emission at by a three-dimensional tungsten photonic crystal,” Optics Letters 28(18), 1683-1685
(2003).
GD-Calc_Intro.pdf, version 09/22/2006
Copyright 2006, Kenneth C. Johnson
software.kjinnovation.com
�
2
Typically, a grating’s optical characteristics are not themselves of primary
structure parameterization, e.g., exposure could be defined as a vectorized quantity, in
which case all exposure-dependent quantities, including the resist thickness, refractive
index, and calculated diffraction efficiencies, will be similarly vectorized.
interest; what is of interest is the optical response of a complete system that includes the
grating as one component. MATLAB’s generic programming capability makes it easy to
functionally link GD-Calc into user-defined optical system models, which can themselves
be incorporated into generic optimization routines to optimize design performance.
GD-Calc is simply a MATLAB function (gdc.m), which can be incorporated into other
MATLAB functions or scripts, and which takes arguments that can be instantiated to
user-defined functions.
MATLAB development environment, they can have the advantage of simplicity and
ease-of-use. However, GD-Calc can be used in conjunction with MATLAB to create
customized user interfaces that are optimally adapted for specific applications. Many of
the functions and scripts associated with GD-Calc such as its plotting facility
(gdc_plot.m), its output data conversion function (gdc_eff.m), and a number of demo
scripts are distributed as public-domain software so that users can freely modify and
adapt the code to best suit their own or their customers’ needs.
Although stand-alone programs lack the generality and flexibility of the
The primary limitation of GD-Calc’s grating modeling capability is that gratings
Structure specification
must be “block-structured” (or must be defined approximately in terms of a block-
structured representation), meaning that the grating comprises optically homogeneous
regions whose bounding surfaces are planes parallel to a set of primary coordinate planes.
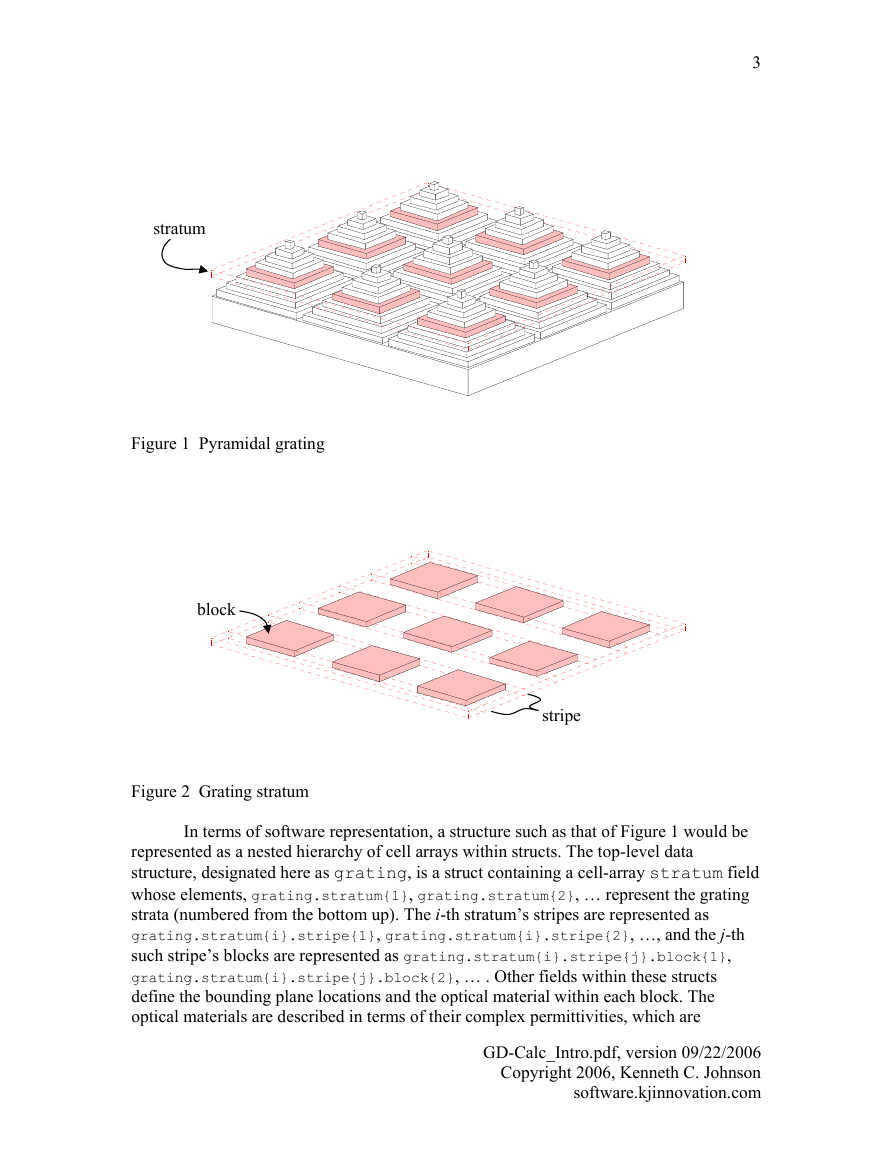
For example, a grating comprising a periodic array of pyramids would be represented
using a “staircase approximation”, as illustrated in Figure 1.
bounded by upper and lower planes parallel to the grating substrate. The grating has a
height-independent lateral cross-section within each stratum. Figure 2 illustrates a
particular stratum extracted from the pyramidal grating of Figure 1. Each stratum is
partitioned into parallel “stripes”, which are further partitioned into rectangular “blocks”
representing optically homogeneous regions.
The grating is subdivided into a number of “strata”, wherein each stratum is
GD-Calc_Intro.pdf, version 09/22/2006
Copyright 2006, Kenneth C. Johnson
software.kjinnovation.com
�
3
stratum
Figure 1 Pyramidal grating
block
stripe
Figure 2 Grating stratum
In terms of software representation, a structure such as that of Figure 1 would be
represented as a nested hierarchy of cell arrays within structs. The top-level data
structure, designated here as grating, is a struct containing a cell-array stratum field
whose elements, grating.stratum{1}, grating.stratum{2}, … represent the grating
strata (numbered from the bottom up). The i-th stratum’s stripes are represented as
grating.stratum{i}.stripe{1}, grating.stratum{i}.stripe{2}, …, and the j-th
such stripe’s blocks are represented as grating.stratum{i}.stripe{j}.block{1},
grating.stratum{i}.stripe{j}.block{2}, … . Other fields within these structs
define the bounding plane locations and the optical material within each block. The
optical materials are described in terms of their complex permittivities, which are
GD-Calc_Intro.pdf, version 09/22/2006
Copyright 2006, Kenneth C. Johnson
software.kjinnovation.com
�
4
enumerated in a top-level cell array grating.pmt, each element of which represents a
particular material. A particular grating region’s optical material is specified as an integer
index into this list (e.g. grating.stratum{i}.stripe{j}.block{k}.pmt_index); thus
multiple regions can be constrained to represent the same material by giving them the
same material index.
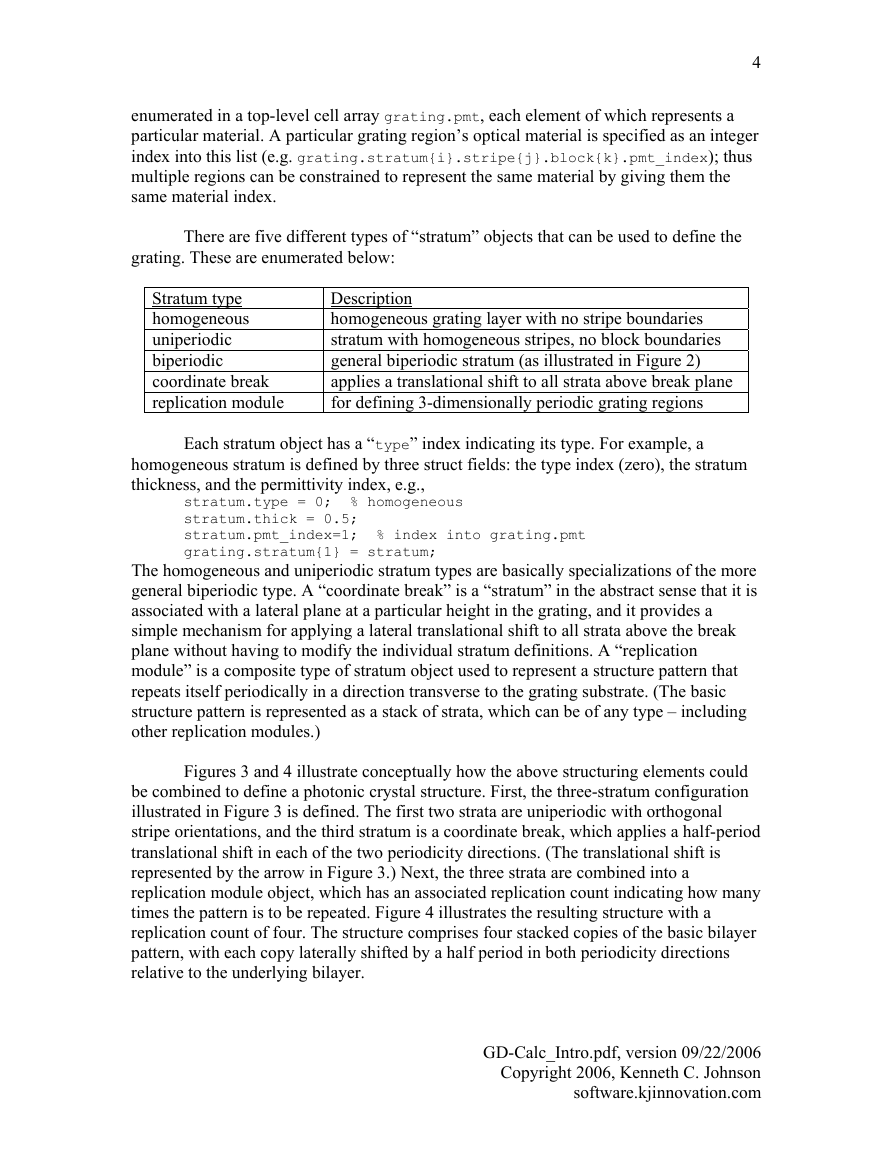
grating. These are enumerated below:
There are five different types of “stratum” objects that can be used to define the
Stratum type
homogeneous
uniperiodic
biperiodic
coordinate break
replication module
Description
homogeneous grating layer with no stripe boundaries
stratum with homogeneous stripes, no block boundaries
general biperiodic stratum (as illustrated in Figure 2)
applies a translational shift to all strata above break plane
for defining 3-dimensionally periodic grating regions
Each stratum object has a “type” index indicating its type. For example, a
stratum.type = 0; % homogeneous
stratum.thick = 0.5;
stratum.pmt_index=1; % index into grating.pmt
grating.stratum{1} = stratum;
homogeneous stratum is defined by three struct fields: the type index (zero), the stratum
thickness, and the permittivity index, e.g.,
The homogeneous and uniperiodic stratum types are basically specializations of the more
general biperiodic type. A “coordinate break” is a “stratum” in the abstract sense that it is
associated with a lateral plane at a particular height in the grating, and it provides a
simple mechanism for applying a lateral translational shift to all strata above the break
plane without having to modify the individual stratum definitions. A “replication
module” is a composite type of stratum object used to represent a structure pattern that
repeats itself periodically in a direction transverse to the grating substrate. (The basic
structure pattern is represented as a stack of strata, which can be of any type – including
other replication modules.)
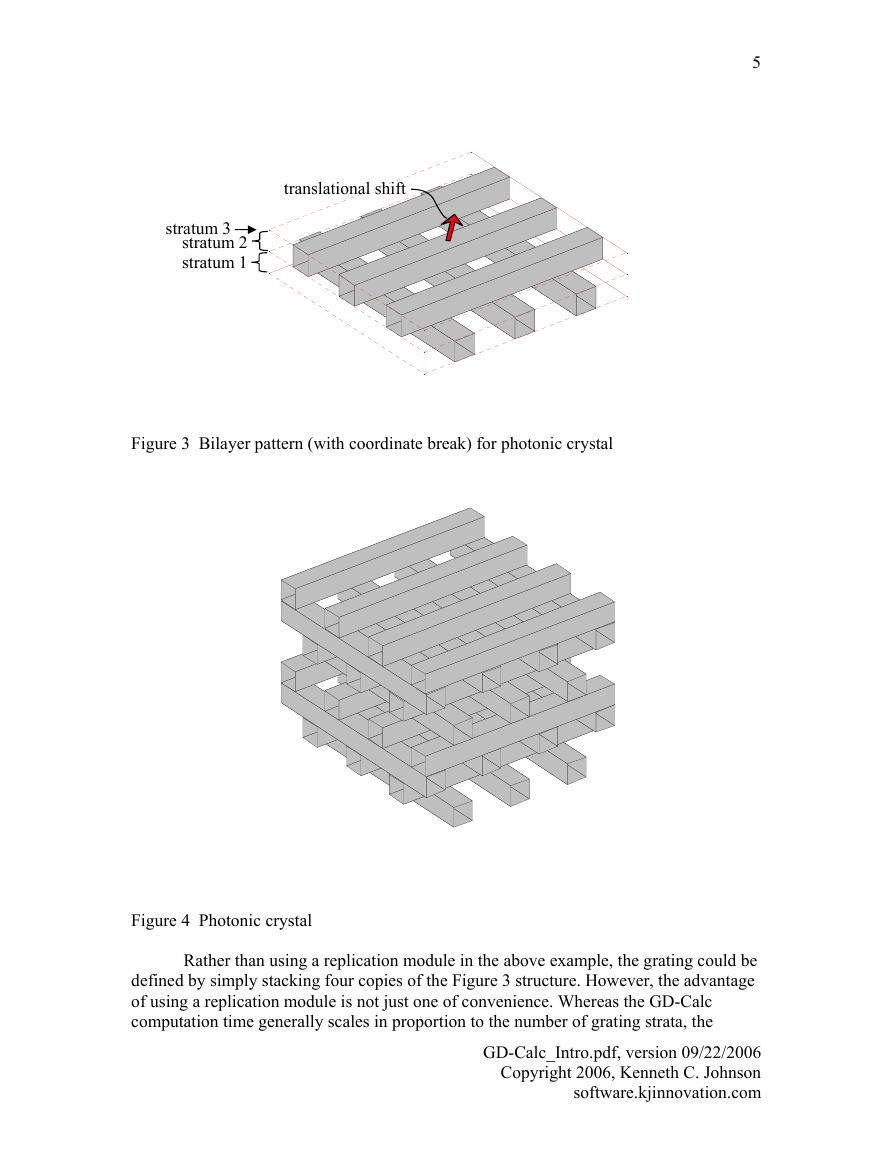
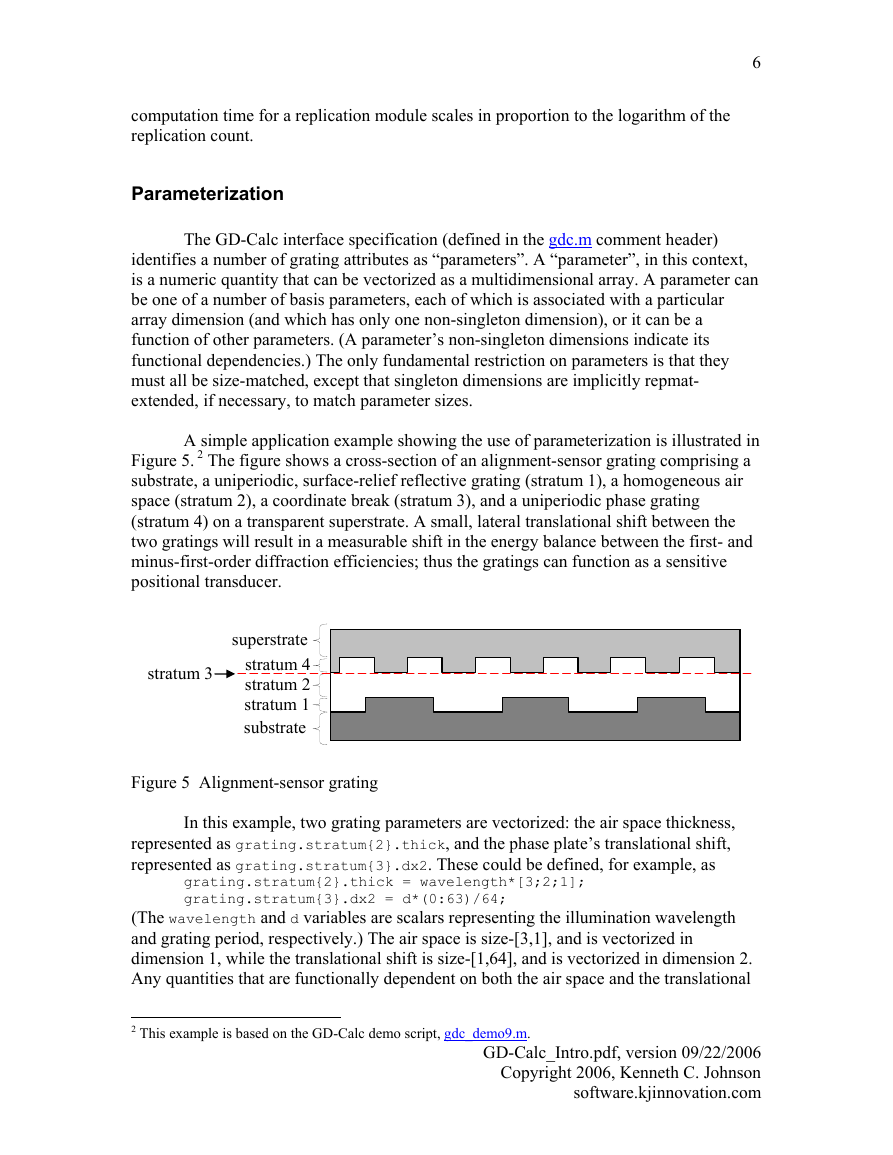
Figures 3 and 4 illustrate conceptually how the above structuring elements could
be combined to define a photonic crystal structure. First, the three-stratum configuration
illustrated in Figure 3 is defined. The first two strata are uniperiodic with orthogonal
stripe orientations, and the third stratum is a coordinate break, which applies a half-period
translational shift in each of the two periodicity directions. (The translational shift is
represented by the arrow in Figure 3.) Next, the three strata are combined into a
replication module object, which has an associated replication count indicating how many
times the pattern is to be repeated. Figure 4 illustrates the resulting structure with a
replication count of four. The structure comprises four stacked copies of the basic bilayer
pattern, with each copy laterally shifted by a half period in both periodicity directions
relative to the underlying bilayer.
GD-Calc_Intro.pdf, version 09/22/2006
Copyright 2006, Kenneth C. Johnson
software.kjinnovation.com
�
translational shift
stratum 3
stratum 2
stratum 1
Figure 3 Bilayer pattern (with coordinate break) for photonic crystal
5
Figure 4 Photonic crystal
Rather than using a replication module in the above example, the grating could be
defined by simply stacking four copies of the Figure 3 structure. However, the advantage
of using a replication module is not just one of convenience. Whereas the GD-Calc
computation time generally scales in proportion to the number of grating strata, the
GD-Calc_Intro.pdf, version 09/22/2006
Copyright 2006, Kenneth C. Johnson
software.kjinnovation.com
�
computation time for a replication module scales in proportion to the logarithm of the
replication count.
6
The GD-Calc interface specification (defined in the gdc.m comment header)
Parameterization
identifies a number of grating attributes as “parameters”. A “parameter”, in this context,
is a numeric quantity that can be vectorized as a multidimensional array. A parameter can
be one of a number of basis parameters, each of which is associated with a particular
array dimension (and which has only one non-singleton dimension), or it can be a
function of other parameters. (A parameter’s non-singleton dimensions indicate its
functional dependencies.) The only fundamental restriction on parameters is that they
must all be size-matched, except that singleton dimensions are implicitly repmat-
extended, if necessary, to match parameter sizes.
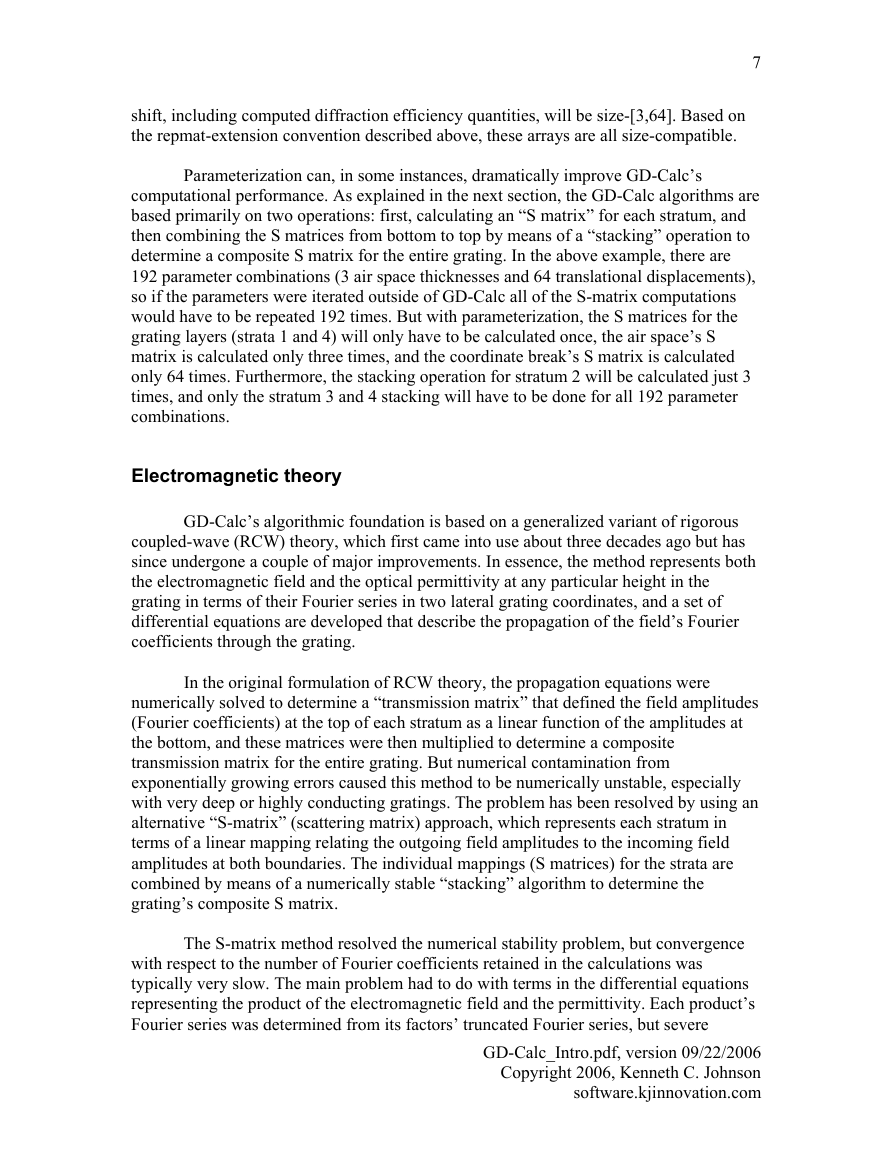
A simple application example showing the use of parameterization is illustrated in
Figure 5. 2 The figure shows a cross-section of an alignment-sensor grating comprising a
substrate, a uniperiodic, surface-relief reflective grating (stratum 1), a homogeneous air
space (stratum 2), a coordinate break (stratum 3), and a uniperiodic phase grating
(stratum 4) on a transparent superstrate. A small, lateral translational shift between the
two gratings will result in a measurable shift in the energy balance between the first- and
minus-first-order diffraction efficiencies; thus the gratings can function as a sensitive
positional transducer.
Figure 5 Alignment-sensor grating
In this example, two grating parameters are vectorized: the air space thickness,
represented as grating.stratum{2}.thick, and the phase plate’s translational shift,
represented as grating.stratum{3}.dx2. These could be defined, for example, as
(The wavelength and d variables are scalars representing the illumination wavelength
and grating period, respectively.) The air space is size-[3,1], and is vectorized in
dimension 1, while the translational shift is size-[1,64], and is vectorized in dimension 2.
Any quantities that are functionally dependent on both the air space and the translational
grating.stratum{2}.thick = wavelength*[3;2;1];
grating.stratum{3}.dx2 = d*(0:63)/64;
stratum 3
superstrate
stratum 4
stratum 2
stratum 1
substrate
2 This example is based on the GD-Calc demo script, gdc_demo9.m.
GD-Calc_Intro.pdf, version 09/22/2006
Copyright 2006, Kenneth C. Johnson
software.kjinnovation.com
�
7
Parameterization can, in some instances, dramatically improve GD-Calc’s
shift, including computed diffraction efficiency quantities, will be size-[3,64]. Based on
the repmat-extension convention described above, these arrays are all size-compatible.
computational performance. As explained in the next section, the GD-Calc algorithms are
based primarily on two operations: first, calculating an “S matrix” for each stratum, and
then combining the S matrices from bottom to top by means of a “stacking” operation to
determine a composite S matrix for the entire grating. In the above example, there are
192 parameter combinations (3 air space thicknesses and 64 translational displacements),
so if the parameters were iterated outside of GD-Calc all of the S-matrix computations
would have to be repeated 192 times. But with parameterization, the S matrices for the
grating layers (strata 1 and 4) will only have to be calculated once, the air space’s S
matrix is calculated only three times, and the coordinate break’s S matrix is calculated
only 64 times. Furthermore, the stacking operation for stratum 2 will be calculated just 3
times, and only the stratum 3 and 4 stacking will have to be done for all 192 parameter
combinations.
In the original formulation of RCW theory, the propagation equations were
Electromagnetic theory
GD-Calc’s algorithmic foundation is based on a generalized variant of rigorous
coupled-wave (RCW) theory, which first came into use about three decades ago but has
since undergone a couple of major improvements. In essence, the method represents both
the electromagnetic field and the optical permittivity at any particular height in the
grating in terms of their Fourier series in two lateral grating coordinates, and a set of
differential equations are developed that describe the propagation of the field’s Fourier
coefficients through the grating.
numerically solved to determine a “transmission matrix” that defined the field amplitudes
(Fourier coefficients) at the top of each stratum as a linear function of the amplitudes at
the bottom, and these matrices were then multiplied to determine a composite
transmission matrix for the entire grating. But numerical contamination from
exponentially growing errors caused this method to be numerically unstable, especially
with very deep or highly conducting gratings. The problem has been resolved by using an
alternative “S-matrix” (scattering matrix) approach, which represents each stratum in
terms of a linear mapping relating the outgoing field amplitudes to the incoming field
amplitudes at both boundaries. The individual mappings (S matrices) for the strata are
combined by means of a numerically stable “stacking” algorithm to determine the
grating’s composite S matrix.
with respect to the number of Fourier coefficients retained in the calculations was
typically very slow. The main problem had to do with terms in the differential equations
representing the product of the electromagnetic field and the permittivity. Each product’s
Fourier series was determined from its factors’ truncated Fourier series, but severe
The S-matrix method resolved the numerical stability problem, but convergence
GD-Calc_Intro.pdf, version 09/22/2006
Copyright 2006, Kenneth C. Johnson
software.kjinnovation.com
�
8
numerical convergence problems arose when the factors had concurrent discontinuities
associated with optical boundaries. This problem has been resolved by using a “Fast
Fourier Factorization” method that, in essence, rearranges the equations to avoid product
factors with concurrent discontinuities (i.e., in each equation where a concurrent
discontinuity occurs, the permittivity factor is brought to the other side of the equation
before applying the Fourier decomposition).
GD-Calc uses both the S-matrix method and Fast Fourier Factorization to
optimize computational performance. (The numerical algorithms are detailed in
GD-Calc.pdf.) One problem that remains with RCW methods, however, is the “staircase
approximation” that must be used to describe sloped or curved surfaces in terms of the
“block-structured” representation. Simply partitioning the grating into very small blocks
does not ensure good accuracy, because the electromagnetic field can exhibit large spikes
near the block corners, and the number of retained diffracted orders must be increased in
proportion to the block partitioning density in order to adequately resolve the spikes.
Thus, users of GD-Calc should be aware of convergence difficulties that can arise,
particularly with highly-conducting gratings that are not inherently block-structured. (The
GD-Calc demo scripts and GD-Calc_Demo.pdf provide examples of the program’s
convergence behavior for a variety of test cases, including comparisons with published
data.)
GD-Calc gives the user complete freedom in selecting which diffracted orders
Diffraction order selection
(i.e., Fourier coefficients) to retain in calculations. Generally, computational data storage
requirements scale in approximate proportion to the square, and runtime scales in
proportion to the cube, of the number of retained orders, so optimizing the order selection
can very significantly impact computational performance.
The checkerboard grating illustrated in Figure 6 (in plan view) is one example
where order selection is particularly useful. The grating is described in relation to two
fundamental period vectors; for example vectors Ar and Br would be a natural choice.
However, the grating has a periodic symmetry stronger than that described by vectors Ar
and Br because, for example, the fundamental period vectors Ar and Cr define a unit cell
whose area is half that of Ar and Br . Thus, if the grating’s optical permittivity is Fourier
analyzed with respect to orthogonal coordinates represented by vectors Ar and Br , half of
its Fourier orders will be identically zero, and similarly half of the electromagnetic field’s
diffracted orders will be zero.
diffraction order, has two associated Fourier order indices
specify what set of
In the Figure 6 example, using basis periods
; and the user must
index pairs to retain in the electromagnetic field expansion.
Each grating Fourier coefficient, and correspondingly each electromagnetic
Ar and Br , all orders with
(
1 mm
,
2
odd
)
1m
and
2m
1 mm −
2
GD-Calc_Intro.pdf, version 09/22/2006
Copyright 2006, Kenneth C. Johnson
software.kjinnovation.com
�


 2023年江西萍乡中考道德与法治真题及答案.doc
 2012年重庆南川中考生物真题及答案.doc
 2013年江西师范大学地理学综合及文艺理论基础考研真题.doc
 2020年四川甘孜小升初语文真题及答案I卷.doc
 2020年注册岩土工程师专业基础考试真题及答案.doc
 2023-2024学年福建省厦门市九年级上学期数学月考试题及答案.doc
 2021-2022学年辽宁省沈阳市大东区九年级上学期语文期末试题及答案.doc
 2022-2023学年北京东城区初三第一学期物理期末试卷及答案.doc
 2018上半年江西教师资格初中地理学科知识与教学能力真题及答案.doc
 2012年河北国家公务员申论考试真题及答案-省级.doc
 2020-2021学年江苏省扬州市江都区邵樊片九年级上学期数学第一次质量检测试题及答案.doc
 2022下半年黑龙江教师资格证中学综合素质真题及答案.doc