CANOCO 5 TUTORIAL
This tutorial guide is distributed with the Canoco 5 trial version, available from the Canoco 5
distributors (see http://www.canoco.com). You can use it to evaluate Canoco 5 for its fit
with your research needs. We hope it will score well with you!
INSTALLATION
The Canoco 5 trial version was provided to you either as a single executable file or on
an installation CD. Before using the software on your computer, you must install it with the
supplied installation program (Canoco Setup). To remove cleanly the software from your
system, you must un-install it using operating system facilities or the Uninstall Canoco 5
command in the Start menu (Microsoft Windows 7 and earlier).
To install Canoco on your computer, use the following steps:
On Microsoft Windows XP, log on to your computer using an account with
administrative rights. In newer versions of Microsoft Windows, you can start the
installation from your normal account and the operating system will ask you for
additional credentials as needed.
If you have a CD with Canoco 5 trial, insert it into your CD/DVD drive. The Canoco
Setup program may start automatically – depending on your local settings. If it does
not or you have the installation file only, you must display the folder where the
installation program is stored (for a CD, this is the setup application in the root
folder) and start it from there (e.g. by double-clicking the file icon).
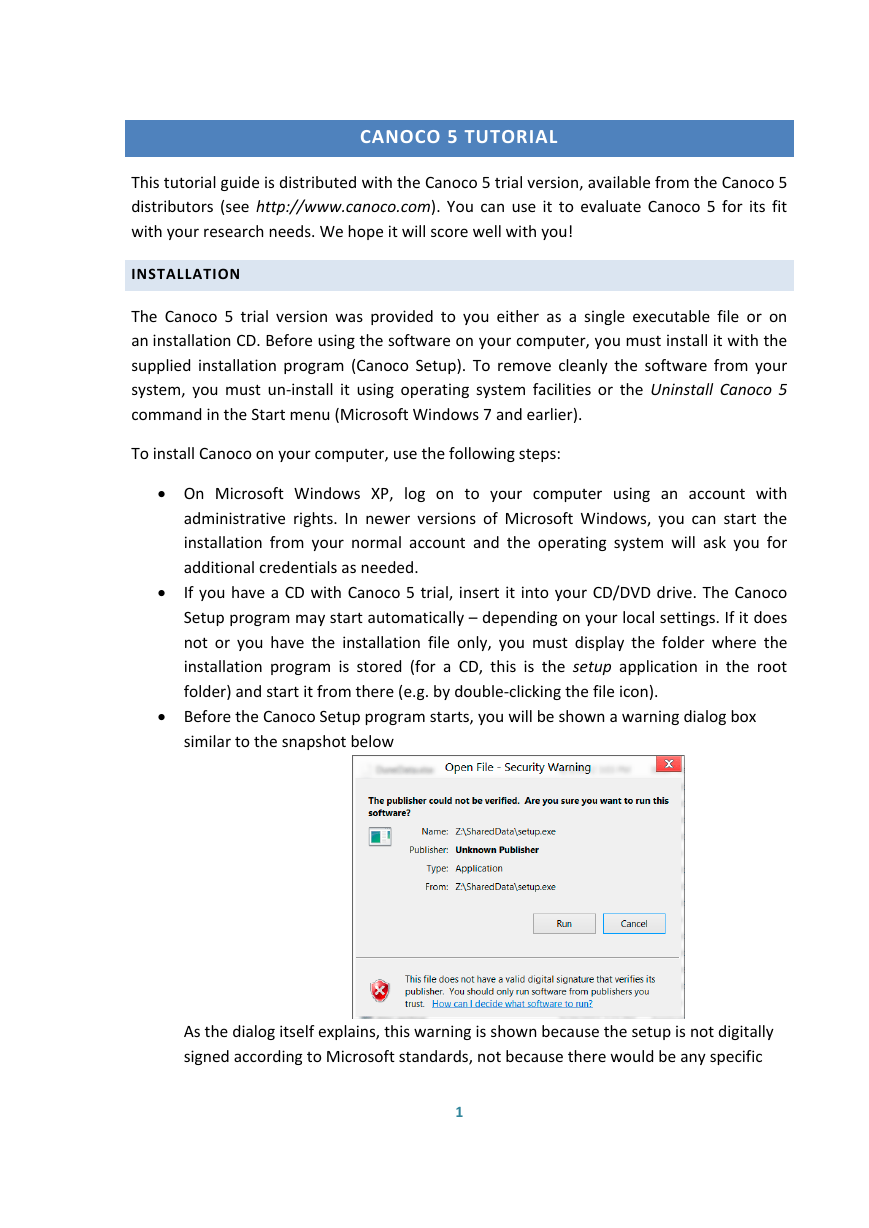
Before the Canoco Setup program starts, you will be shown a warning dialog box
similar to the snapshot below
As the dialog itself explains, this warning is shown because the setup is not digitally
signed according to Microsoft standards, not because there would be any specific
1
�
security issue with its contents. Click the Run button to continue. Depending on your
local security policy, there could be additional warning shown before the Welcome
screen of the Canoco Setup program shows.
After you click the Next button, you will be shown Canoco 5 User license agreement
and you must confirm that you agree with its contents before the Next button is
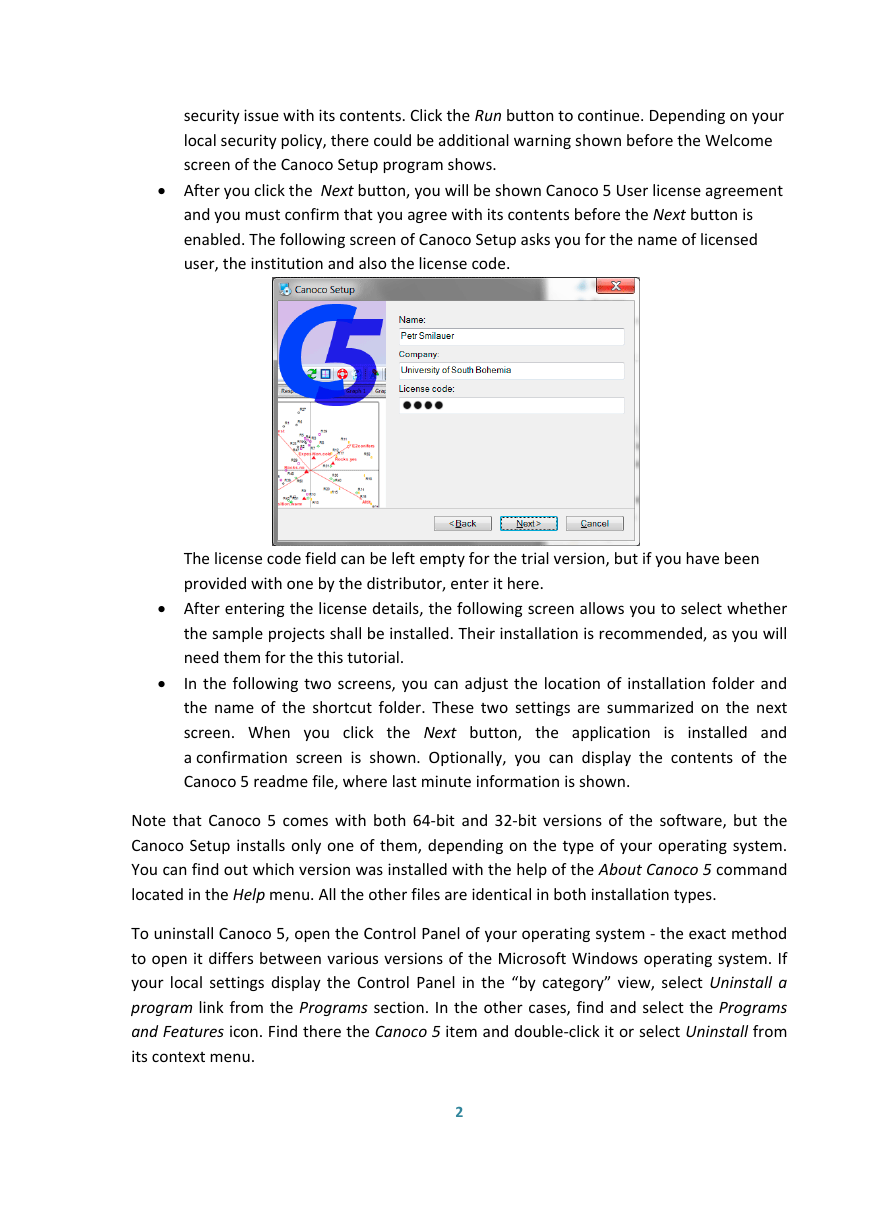
enabled. The following screen of Canoco Setup asks you for the name of licensed
user, the institution and also the license code.
The license code field can be left empty for the trial version, but if you have been
provided with one by the distributor, enter it here.
After entering the license details, the following screen allows you to select whether
the sample projects shall be installed. Their installation is recommended, as you will
need them for the this tutorial.
In the following two screens, you can adjust the location of installation folder and
the name of the shortcut folder. These two settings are summarized on the next
screen. When you click the Next button, the application
installed and
a confirmation screen is shown. Optionally, you can display the contents of the
Canoco 5 readme file, where last minute information is shown.
is
Note that Canoco 5 comes with both 64-bit and 32-bit versions of the software, but the
Canoco Setup installs only one of them, depending on the type of your operating system.
You can find out which version was installed with the help of the About Canoco 5 command
located in the Help menu. All the other files are identical in both installation types.
To uninstall Canoco 5, open the Control Panel of your operating system - the exact method
to open it differs between various versions of the Microsoft Windows operating system. If
your local settings display the Control Panel in the “by category” view, select Uninstall a
program link from the Programs section. In the other cases, find and select the Programs
and Features icon. Find there the Canoco 5 item and double-click it or select Uninstall from
its context menu.
2
�
THE FIRST RUN
Our first tutorial session with Canoco 5 will be brief, outlining the main steps of working
with your data and preparing some ground to explain Canoco’s view of the world.
To start the program, double-click the Canoco 5 icon on your computer desktop (in
Windows 7 and earlier versions) or select its icon among Windows 8 tiles. When you run
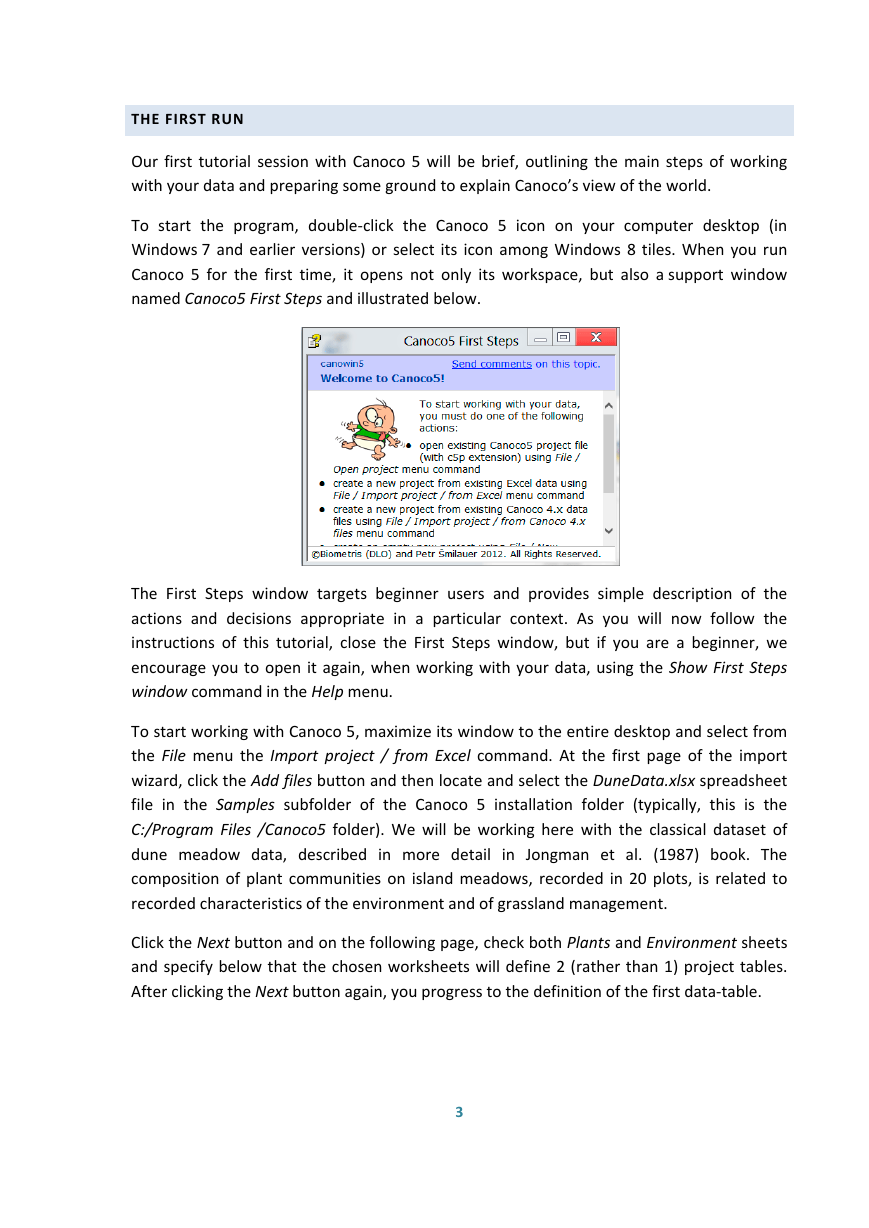
Canoco 5 for the first time, it opens not only its workspace, but also a support window
named Canoco5 First Steps and illustrated below.
The First Steps window targets beginner users and provides simple description of the
actions and decisions appropriate in a particular context. As you will now follow the
instructions of this tutorial, close the First Steps window, but if you are a beginner, we
encourage you to open it again, when working with your data, using the Show First Steps
window command in the Help menu.
To start working with Canoco 5, maximize its window to the entire desktop and select from
the File menu the Import project / from Excel command. At the first page of the import
wizard, click the Add files button and then locate and select the DuneData.xlsx spreadsheet
file in the Samples subfolder of the Canoco 5 installation folder (typically, this is the
C:/Program Files /Canoco5 folder). We will be working here with the classical dataset of
dune meadow data, described in more detail in Jongman et al. (1987) book. The
composition of plant communities on island meadows, recorded in 20 plots, is related to
recorded characteristics of the environment and of grassland management.
Click the Next button and on the following page, check both Plants and Environment sheets
and specify below that the chosen worksheets will define 2 (rather than 1) project tables.
After clicking the Next button again, you progress to the definition of the first data-table.
3
�
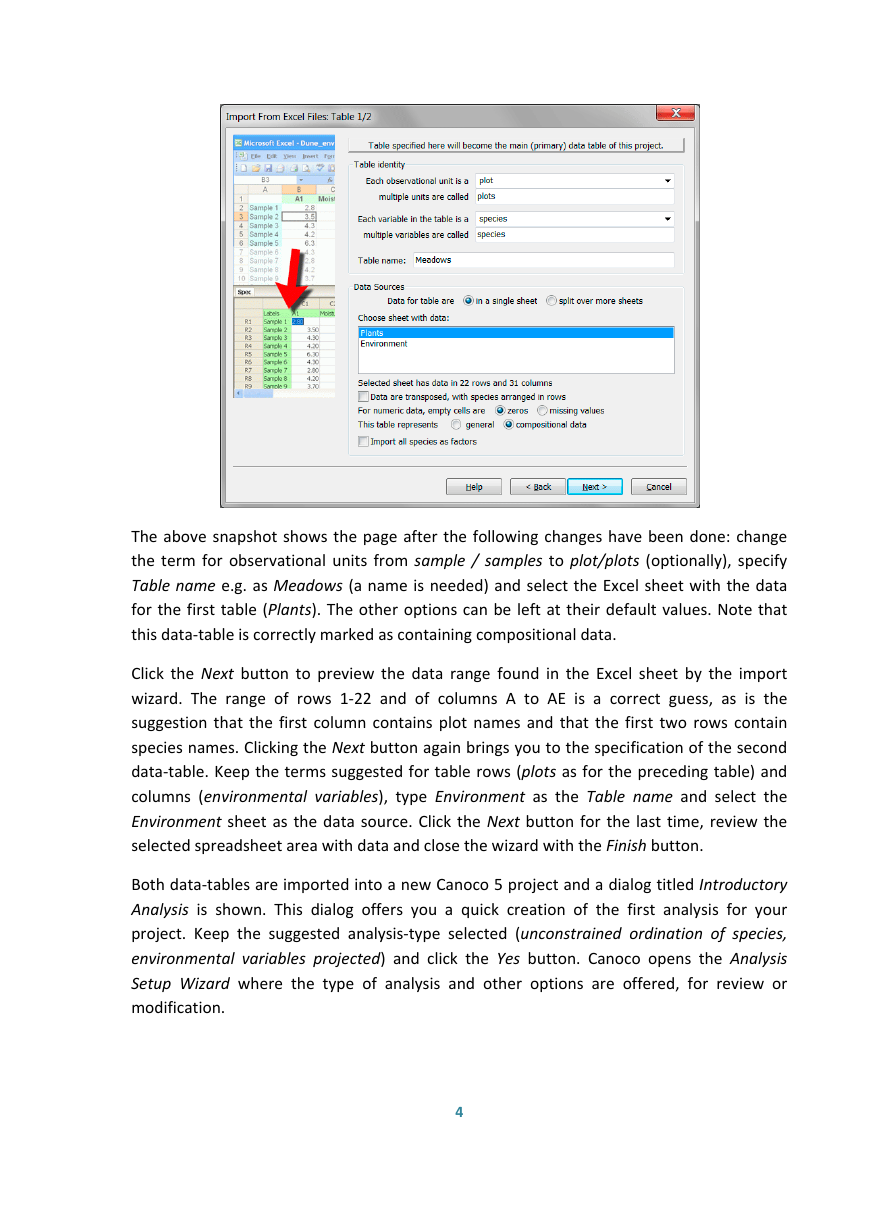
The above snapshot shows the page after the following changes have been done: change
the term for observational units from sample / samples to plot/plots (optionally), specify
Table name e.g. as Meadows (a name is needed) and select the Excel sheet with the data
for the first table (Plants). The other options can be left at their default values. Note that
this data-table is correctly marked as containing compositional data.
Click the Next button to preview the data range found in the Excel sheet by the import
wizard. The range of rows 1-22 and of columns A to AE is a correct guess, as is the
suggestion that the first column contains plot names and that the first two rows contain
species names. Clicking the Next button again brings you to the specification of the second
data-table. Keep the terms suggested for table rows (plots as for the preceding table) and
columns (environmental variables), type Environment as the Table name and select the
Environment sheet as the data source. Click the Next button for the last time, review the
selected spreadsheet area with data and close the wizard with the Finish button.
Both data-tables are imported into a new Canoco 5 project and a dialog titled Introductory
Analysis is shown. This dialog offers you a quick creation of the first analysis for your
project. Keep the suggested analysis-type selected (unconstrained ordination of species,
environmental variables projected) and click the Yes button. Canoco opens the Analysis
Setup Wizard where the type of analysis and other options are offered, for review or
modification.
4
�
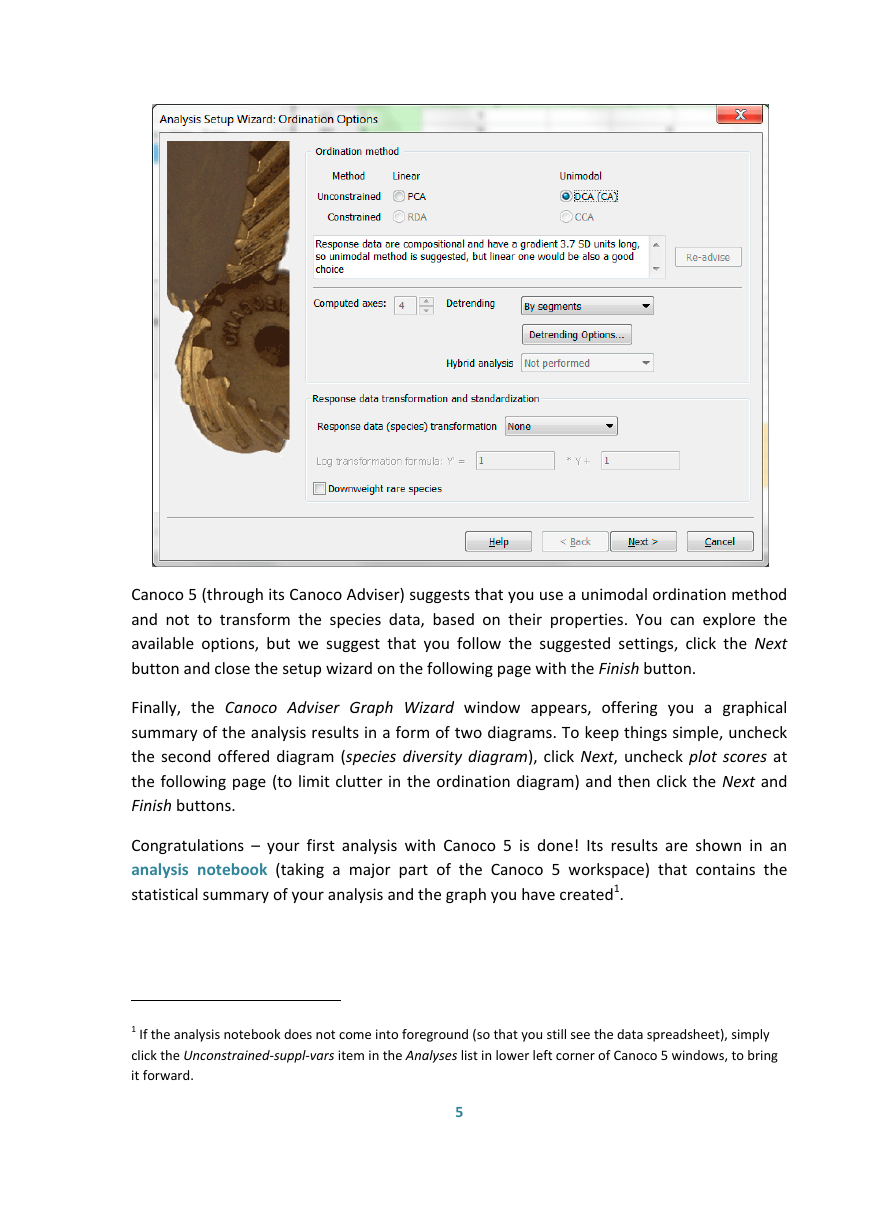
Canoco 5 (through its Canoco Adviser) suggests that you use a unimodal ordination method
and not to transform the species data, based on their properties. You can explore the
available options, but we suggest that you follow the suggested settings, click the Next
button and close the setup wizard on the following page with the Finish button.
Finally, the Canoco Adviser Graph Wizard window appears, offering you a graphical
summary of the analysis results in a form of two diagrams. To keep things simple, uncheck
the second offered diagram (species diversity diagram), click Next, uncheck plot scores at
the following page (to limit clutter in the ordination diagram) and then click the Next and
Finish buttons.
Congratulations – your first analysis with Canoco 5 is done! Its results are shown in an
analysis notebook (taking a major part of the Canoco 5 workspace) that contains the
statistical summary of your analysis and the graph you have created1.
1 If the analysis notebook does not come into foreground (so that you still see the data spreadsheet), simply
click the Unconstrained-suppl-vars item in the Analyses list in lower left corner of Canoco 5 windows, to bring
it forward.
5
�
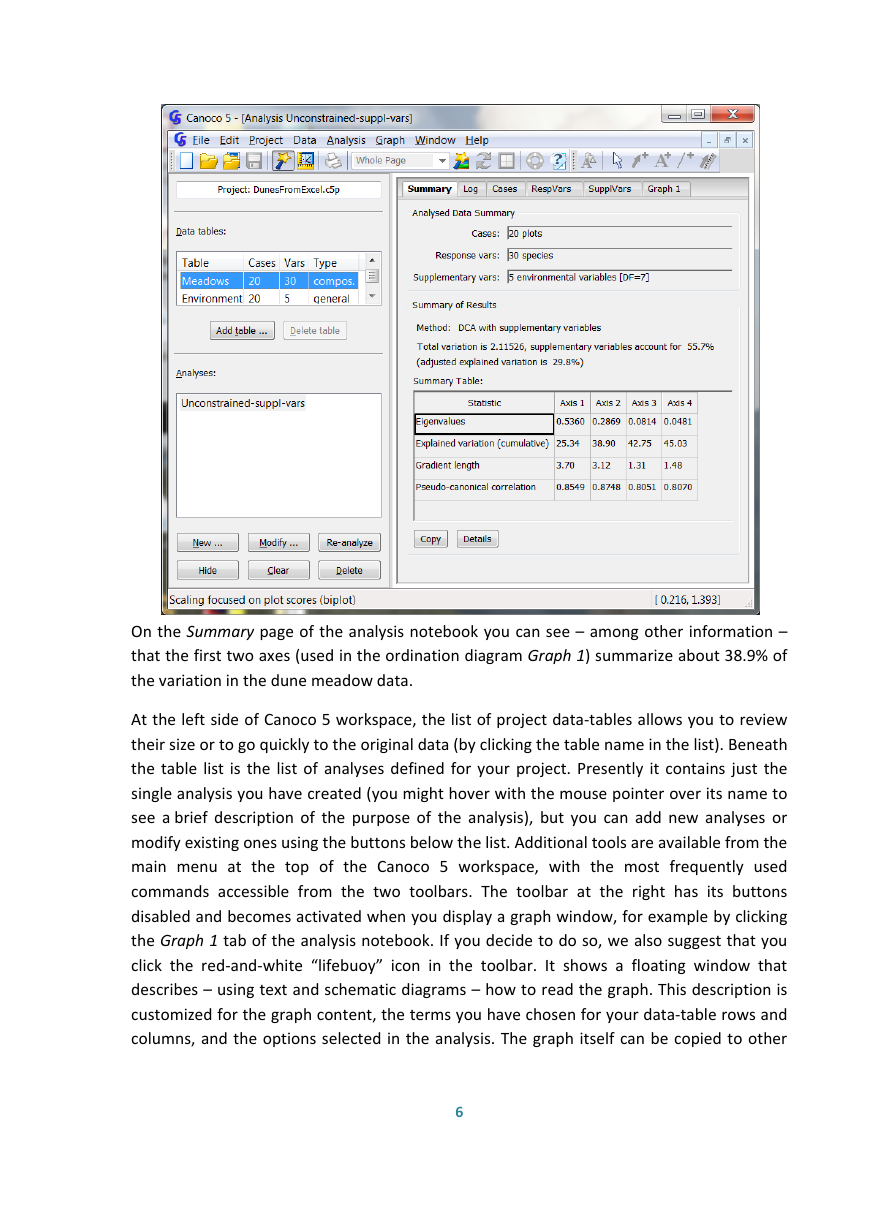
On the Summary page of the analysis notebook you can see – among other information –
that the first two axes (used in the ordination diagram Graph 1) summarize about 38.9% of
the variation in the dune meadow data.
At the left side of Canoco 5 workspace, the list of project data-tables allows you to review
their size or to go quickly to the original data (by clicking the table name in the list). Beneath
the table list is the list of analyses defined for your project. Presently it contains just the
single analysis you have created (you might hover with the mouse pointer over its name to
see a brief description of the purpose of the analysis), but you can add new analyses or
modify existing ones using the buttons below the list. Additional tools are available from the
main menu at the top of the Canoco 5 workspace, with the most frequently used
commands accessible from the two toolbars. The toolbar at the right has its buttons
disabled and becomes activated when you display a graph window, for example by clicking
the Graph 1 tab of the analysis notebook. If you decide to do so, we also suggest that you
click the red-and-white “lifebuoy” icon in the toolbar. It shows a floating window that
describes – using text and schematic diagrams – how to read the graph. This description is
customized for the graph content, the terms you have chosen for your data-table rows and
columns, and the options selected in the analysis. The graph itself can be copied to other
6
�
applications or exported in widely-supported formats (using the File / Export graph menu
command).
You can end your first tour of Canoco 5 now by closing the project (File / Close project).
When you do it, the program asks whether you want to save your new project and we
recommend you answer Yes – to keep it as a reminder of your first session with Canoco 5, if
for nothing else . We will not work with this project any further, however.
The Canoco 5 project resulting from performing all the above tutorial steps can be found in
the DunesFromExcel project file, located in the Samples / Chapter2 subfolder of the Canoco
installation folder2.
PROJECTS, ANALYSES AND STEPS
As you have seen in the preceding tutorial, Canoco 5 provides an integrated environment
for data management, statistical analysis and graphical exploration of the results and
original data. Work with your data is organized with the help of a project, representing a set
of inter-related data-tables originating from a research project. To put these data to use,
you create one or multiple analyses. Each analysis addresses a single question you might
have about your data. Analysis settings are partly pre-defined by the question itself,
specified at the time the analysis was created (if the analysis is created with the help of the
Canoco Advisor), while others can be set and later modified with the Analysis Setup wizard.
The results of each analysis are summarized in its notebook, with the most important
notebook pages being the Summary page and the pages for created graphs (labelled Graph
N). But some of the questions you might ask about your data can be quite complex and the
corresponding analysis will be then divided into multiple steps, producing partial results
that can be reviewed in the Summary page. Often such results are further combined in
a specialized page in the front of the analysis notebook (e.g. for variation partitioning or
principal response curves analyses). Simple analyses (such as the DCA in our first tutorial) do
not have multiple steps and you might safely ignore the steps if you are only applying
standard unconstrained and constrained ordination methods to your data.
Canoco 5 distinguishes two kinds of data. Compositional data-tables are best exemplified
by data describing the composition of a biotic community: each column represents one
taxon (most often species) and the values are measured in identical units across all
2 Please note that when you are opening a Canoco 5 project using the File | Open project menu command,
Canoco inserts a special short-cut in the upper left area of the dialog (Canoco 5 Application / Samples), with
the exception of the Windows XP platform.
7
�
columns, whether they are 0s and 1s for presence-absence data or some semi-quantitative
or quantitative estimates of species frequency, cover or biomass. Important features of
such data are that they are never negative and it makes sense to sum them up within the
rows, with the result representing species richness (for presence-absence data) or total
biomass, total cover, etc. If a data-table is not compositional, it is called general in Canoco
5. These kinds of data are typically used for describing environmental properties, sampling
or experimental design, etc. When you create your project, the first defined table is set with
compositional type by default, while the other tables are set as the general type, but please
verify whether this is appropriate for your data. This classification is very important for the
Canoco Adviser to provide appropriate suggestions for your analyses. For example, if the
Meadows data-table in our preceding tutorial was not marked as compositional, the DCA
would not have been offered as a suitable method of analysis. Data table type can be
changed later, using the Change table kind command in the Data submenu.
WORKING WITH PROJECT DATA
In this second tutorial, we start again with data stored in a file produced by Microsoft Excel,
but this time with the older format used by Microsoft Office up to version 2003. The name
of the file is birds.xls and it is located in the Samples subfolder of the Canoco 5 installation
folder. Although you can import this file without having Microsoft Office installed, you are
advised to inspect the file beforehand in Microsoft Excel, if present on your computer. You
will see that it contains two sheets with data, representing results of a two-year study of
bird assemblages in the West Carpathian mountain range (Velka Fatra Mts., Slovakia). The
two tables we will use in this project are both located in the first sheet, separated by
a single column (MN). For the bird species, we have both their full and shortened names in
the first and second row, respectively, while the landscape characteristics (starting from
column AN) have only their full labels. Individual rows represent 250x250 m plots laid in
a grid over the study area. Recorded species abundances are the estimates of the number
of nesting pairs, averaged over four censuses.
We have demonstrated the import of a Canoco 5 project from Excel data in the first tutorial
(The first run), so here it is described more briefly, focusing on the differences with our
previous example. Start with the File / Import project / from Excel command, selecting the
birds.xls file. Note that to see this file in the file open dialog, you must change the file type if
Excel 2007-2010 Files is presently selected. At the next wizard page, check the birds sheet
only, but the number of project tables will be 2 anyway. For the first table, we suggest you
set the unit terms to plot / plots (unless already suggested), variable terms to bird species
(both – this must be typed in) and set the table name to Birds.
Because two tables with different setups are present in the selected sheet, the import
wizard misses some details that need to be corrected on the following page. The first table
8
�


 2023年江西萍乡中考道德与法治真题及答案.doc
 2012年重庆南川中考生物真题及答案.doc
 2013年江西师范大学地理学综合及文艺理论基础考研真题.doc
 2020年四川甘孜小升初语文真题及答案I卷.doc
 2020年注册岩土工程师专业基础考试真题及答案.doc
 2023-2024学年福建省厦门市九年级上学期数学月考试题及答案.doc
 2021-2022学年辽宁省沈阳市大东区九年级上学期语文期末试题及答案.doc
 2022-2023学年北京东城区初三第一学期物理期末试卷及答案.doc
 2018上半年江西教师资格初中地理学科知识与教学能力真题及答案.doc
 2012年河北国家公务员申论考试真题及答案-省级.doc
 2020-2021学年江苏省扬州市江都区邵樊片九年级上学期数学第一次质量检测试题及答案.doc
 2022下半年黑龙江教师资格证中学综合素质真题及答案.doc