Data Analytics for Beginners
Basic Guide to Master Data Analytics
Download from finelybook www.finelybook.com�
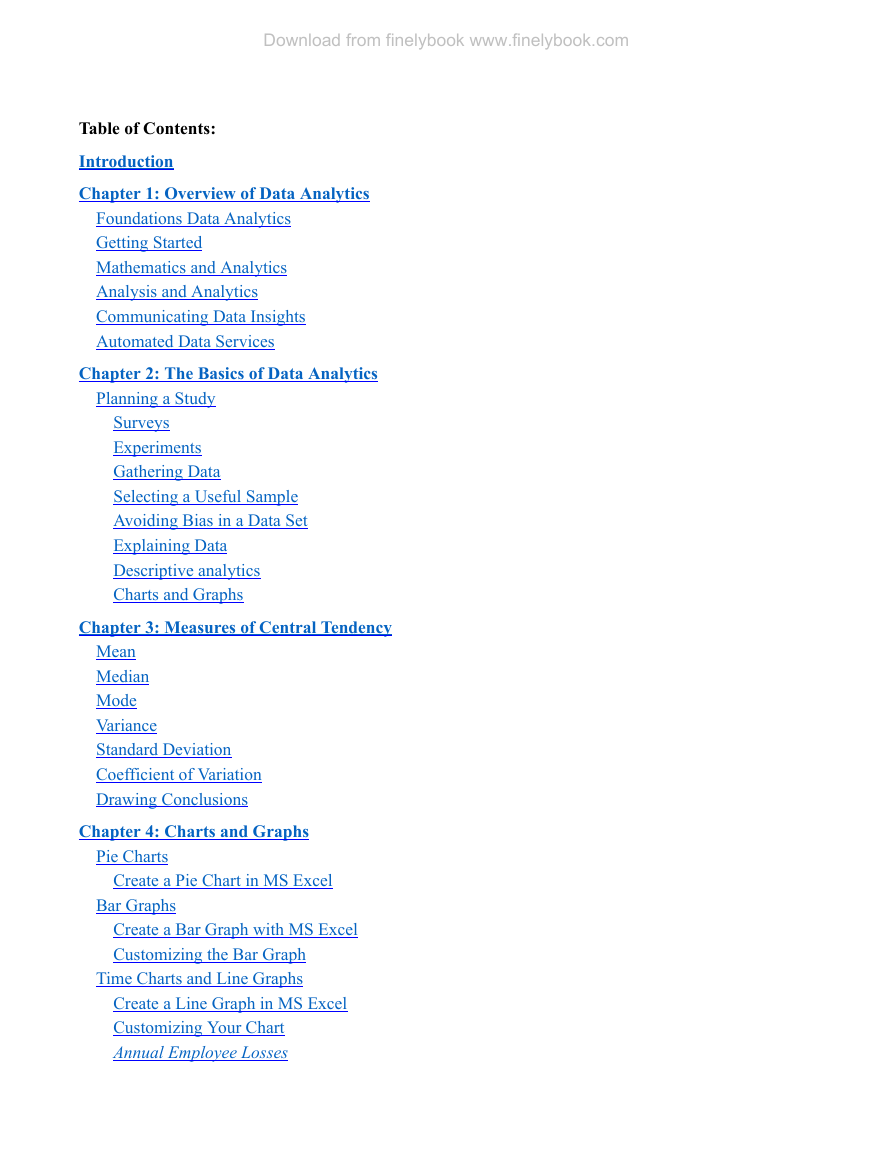
Table of Contents:
Introduction
Chapter 1: Overview of Data Analytics
Foundations Data Analytics
Getting Started
Mathematics and Analytics
Analysis and Analytics
Communicating Data Insights
Automated Data Services
Chapter 2: The Basics of Data Analytics
Planning a Study
Surveys
Experiments
Gathering Data
Selecting a Useful Sample
Avoiding Bias in a Data Set
Explaining Data
Descriptive analytics
Charts and Graphs
Chapter 3: Measures of Central Tendency
Mean
Median
Mode
Variance
Standard Deviation
Coefficient of Variation
Drawing Conclusions
Chapter 4: Charts and Graphs
Pie Charts
Create a Pie Chart in MS Excel
Bar Graphs
Create a Bar Graph with MS Excel
Customizing the Bar Graph
Time Charts and Line Graphs
Create a Line Graph in MS Excel
Customizing Your Chart
Annual Employee Losses
Download from finelybook www.finelybook.com�
Adding another Set of Data
Histograms
Create a Histogram with MS Excel
Creating a Histogram
Scatter Plots
Create a Scatter Chart with MS Excel
Spatial Plots and Maps
Chapter 5: Applying Data Analytics to Business and Industry
Business Intelligence (BI)
Data Analytics in Business and Industry
BI and Data Analytics
Chapter 6: Final Thoughts on Data
Conclusion
Download from finelybook www.finelybook.com�
Introduction
We live in thrilling and innovative times. As business moves to the digital environment, virtually every
action we take produces data. Information is collected from every online interaction. All sorts of devices
gather and store data about who we are, where we are, and what we are doing. Increasingly-massive
warehouses of data are now freely available to the public. Skilled analyses of all this data can help
businesses, governments, and organizations to make better-informed decisions, respond quickly to
changing needs, and to gain deeper insights into our rapidly-changing environment. It is a challenge to
even attempt to make good use of all of the available data. In order to answer specific questions, a
person must decide what data to collect, which methods to use, and how to interpret the results.
Data analytics is a way to make valuable use all types of information. Analytics is used to help
categorize data, identify patterns, and predict results. Data use has become so ubiquitous that it has
become necessary for individuals in every profession to learn how to work with data. Those who
become the most proficient at working with data in useful and creative ways will be the most successful
in the new world of business.
Until recently, data analytics was limited to an exclusive culture of data analysts, who characteristically
presented this topic in complicated and often unintelligible terminology. Fortunately, data analytics is
not as complicated as many believe. It simply consists of using analytical methods and processes to
develop and explain specific and useful information from data. The point of data analytics is to enhance
practices and to support better-informed decisions. This can result in: safer practices within an industry,
greater revenues for a business, higher customer satisfaction, or any other object of focus. This eBook
introduces a wide range of ideas and concepts used for deriving useful information from a set of data,
including data analytics techniques and what can be achieved by using them.
Download from finelybook www.finelybook.com�
Chapter 1: Overview of Data Analytics
With a little statistical understanding and procedural training, you will be able to use analytical methods
to make data-based insights. Data analytics offers new ways to understand the world. Businesses and
organizations were in the habit of making decisions based on assumptions and hoping for favorable
outcomes. Data analytics gives people the insights that they need to plan for improvements and specific
results. Analytics are generally used for the following purposes:
• To enhance business organizations and increase returns on investment (ROIs).
• To improve the success of sales and marketing campaigns.
• To identify trends and emerging developments.
• To make society more safe.
Foundations Data Analytics
Data analytics requires the use mathematical and statistical procedures. It also requires the skills to work
with certain software applications and a knowledge of the subject area you are working with. Without
knowledge of the subject-matter, analytics is reduced to simple analytics. Due to the increasing demand
for data insights, every field of business has begun to implement data analytics. This has resulted in a
variety of analytic specialties, such as: market analytics, financial analytics, clinical analytics,
geographical analytics, retail analytics, educational analytics, and many other areas of interest.
Getting Started
This chapter explains the major components comprising data analytics, gathering, exploring, and
interpreting data. As a data analyst, you will be collecting and sorting large volumes of raw,
unstructured, and partially-structured data. The amounts of data that you are likely to be working with
can be too large for a normal database system to effective process. A data set that is too large, changes
too quickly, or it does not conform to the structure of standard database designs requires a special
skillset to manage. Data analytics consists of analyzing, predicting, and visualizing data. When data
analysts gather, query, and interpret data, they conduct a process that is quite similar to data engineering.
Although useful insights can be produced from an individual source of data, the blending of several
sources gives context to the data that is necessary to make more informed decisions. As a data analyst,
you can combine multiple datasets that are maintained in a single database. You can also work with
several different databases maintained within a large data warehouse. Data can also be maintained and
managed within a cloud-based platform specially designed for that purpose. However the data is pooled
and wherever it is stored, the analyst must still issue queries on the data and make commands to retrieve
specific information. This is typically done using a specialized database language called Structured
Query Language (SQL).
Download from finelybook www.finelybook.com�
When using a database software application or conducting an analysis using other programming
languages, like R or Python, you can utilize a variety of digital file formats, such as:
• Comma-separated values (CSV) files: Virtually all data-based software applications (including
•
cloud-based programs) and scripting languages are compatible with the CSV file type.
Programming Scripts: Professional data analysts generally know how to write programming
scripts in order to work with data and visualizations in languages like Python and R.
• Common File Extensions: MS Excel files have the .xls or .xlsx extension. Geospatial
applications are saved with their own file formats (e.g., .mxdextension for ArcGIS and the .qgs
extension for QGIS).
• Web Programming Files: Web-based data visualizations often use the Data Driven Documents
JavaScript library (D3.js.). D3.js, files are saved as .html files.
Mathematics and Analytics
Data analytics requires the ability to perform mathematical and statistical operations. These skills are
necessary to understand both to make sense of the data and to evaluate its relative significance. This is
also important in data analytics, because they can be used to conduct data forecasting, decision analytics,
and testing of hypotheses. Before getting into more advanced explorations of mathematical and
statistical procedures, we will take some time to explain some distinctions between mathematics and
analytics.
Mathematics relies on specific numerical procedures and deductive reasoning to develop a mathematical
explanation of some phenomenon. Like mathematics, analytics provides a mathematical description of a
phenomenon. Analytics is actually a type of analytics that is based on mathematics. However analytics
uses inductive reasoning and probability to form a conclusions and explanations.
Data analysts use mathematical procedures to make decision models, to produce estimations, and to
make forecasts. In order to follow this book, you need little more than common math skills. This book
will teach you how to statistical techniques to develop insights from data. In the field of data analytics,
statistical procedures are used to determine the meaning and significance of data. This can then utilized
to test hypotheses, build data simulations, and make predictions about future outcomes.
Analysis and Analytics
The major difference between data analysis and data analytics is the need for subject knowledge. Typical
statisticians specialize in data procedures and have little-to-no knowledge of other fields of study. They
must consult with others who have subject-specific expertise to know which data to look for and to help
find meaning in that data. Data analysts, on the other hand, must understand their subject matter. They
seek to gain important insights that they can use with their subject-matter expertise to make meaning of
those insights. Below is a list of ways that subject matter experts use analytics to enhance performance
in their areas:
• Engineering analysts use data analytics with building designs.
• Clinical data analysts use predictive methods to foresee future health issues.
• Marketing data analysts use regression data to predict and moderate customer turnover.
• Data journalists search databases for patterns that may be worth investigating.
• Crime data analysts develop spatial models to identify patterns and predict future crimes.
• Disaster relief data analysts work to organize and explain important data about the effects of
disasters, which is then used to determine the types of assistance needed.
Download from finelybook www.finelybook.com�
Communicating Data Insights
Data analysts often have to explain data in ways that non-technical people can comprehend. They must
be able to create understandable data visualizations and reports. Generally, people have to visually
process data in the form of charts, graphs, and pictures for to be able to understand data. Analysts have
to be both creative and practical in the ways that they communicate their findings.
Organizational leaders often have difficulties trying to figure out what to do with all of data that their
organization collects. What they do know, however, is that effectively using analytical tools can help
them to both strengthen and gain a valuable competitive edge for their business or organization.
Currently, very few of these leaders know the available options for engaging in the process. The
following section discusses the major data analytics solutions and the benefits that can be gained by
organizations.
When implementing data analytics within an organization, there are three key methodologies. One can
create an internal data analytics department. One could contract out the assignments to independent data
analysts, or one could pay for a cloud-based software-as-a-service (SAS) solution that enables novices to
utilize powerful of data analytics tools.
There are a few major ways to create an internal data analytics team:
• Train current personnel. This can be an inexpensive way to provide an organization with
ongoing data analytics. This training can be used to transform certain employees into highly-
skilled subject-matter experts who are proficient in data analysis.
• Train current personnel and also hire professional analysts. This strategy follows the same
process as the first method, but also includes hiring a few data professionals to oversee the
process and personally handle the most challenging problems and tasks.
• Hire data professionals. An organization get their needs met by hiring or contracting with
professional data analysts. This is the most expensive option, because professional data analysts
are in low supply and generally have high salary requirements.
Securing highly-skilled data analysts to meet the needs of an organization can be extremely difficult.
Many businesses and organizations outsource their data analytics jobs to external experts. This happens
in two different ways: They contract with someone to develop a wide-ranging data analytics plan to
serve the entire organization. Another way is to contract with experts to provide individual data analytics
solutions for specific situations and problems that that their organization may encounter.
Automated Data Services
Although you must understand some certain statistical and mathematical procedures, it is not essential to
learn how to code like professional analysts. Computer program applications have been developed that
can help to provide powerful capabilities without having to code or script. Cloud-based platform
solutions can provide organizations with most or all of their data analytics needs, although training is
still required for personnel to operate the cloud platform programs.
This book will teach you how to use the power of data analytics to achieve a individual and
organizational goals. Regardless of a field of work, learning data analytics can help you to become a
Download from finelybook www.finelybook.com�
more in proficient and sought after professional. Below is a brief list of benefits that data analytics
provide for various areas:
• Benefits for corporations: Cost minimization, higher return on investment (ROI), increased staff-
productivity, reduction of customer loss, higher customer satisfaction, sales forecasting, pricing-
model enhancement, loss detection, and more efficient processes.
• Benefits for governments: Increased staff-productivity, improved decision-making models, more
reliable budget forecasting, more efficient resource allocations, and discovery of organizational
patterns.
• Benefits for academia: More efficient resource allocations, improved instructional focus and
student performance, increased student retention, refinement of processes, reliable budget
forecasting, and increased ROI for student recruitment practices.
This chapter provided an introduction to the concept of data analytics. Analytics is a growing field of
science that brings together traditional statistical procedures and computer science in order to ascertain
meaningful insights from huge sets of raw data for the benefit of businesses, organizations,
governments, and society. Data analytics is sometimes confused with Business Intelligence (BI) because
of the common tools they both share, particularly data visualizations, such as traditional charts and
graphs. BI, however, is a discipline designed for business leaders without the advanced training
necessary to engage in data analytics. The following chapter discusses the basic principle of data
analytics.
Download from finelybook www.finelybook.com�



 2023年江西萍乡中考道德与法治真题及答案.doc
 2012年重庆南川中考生物真题及答案.doc
 2013年江西师范大学地理学综合及文艺理论基础考研真题.doc
 2020年四川甘孜小升初语文真题及答案I卷.doc
 2020年注册岩土工程师专业基础考试真题及答案.doc
 2023-2024学年福建省厦门市九年级上学期数学月考试题及答案.doc
 2021-2022学年辽宁省沈阳市大东区九年级上学期语文期末试题及答案.doc
 2022-2023学年北京东城区初三第一学期物理期末试卷及答案.doc
 2018上半年江西教师资格初中地理学科知识与教学能力真题及答案.doc
 2012年河北国家公务员申论考试真题及答案-省级.doc
 2020-2021学年江苏省扬州市江都区邵樊片九年级上学期数学第一次质量检测试题及答案.doc
 2022下半年黑龙江教师资格证中学综合素质真题及答案.doc