Introduction
• Presentation Target
– COO, CFO, VP Supply Chain
• Purpose:
– Provide an overview of Oracle Integrated Business Planning
Solution
• Industry Targets:
– Industrial Manufacturing
– High Tech
– Consumer Goods
– Life Sciences
• Instructions:
– Review Integrated Business Planning Cheatsheet
– Choose appropriate customer story for the industry
1
Copyright © 2011, Oracle and/or its affiliates. All rights reserved.
�
Integrated Business Planning
2
Copyright © 2011, Oracle and/or its affiliates. All rights reserved.
�
Agenda
• Situation and Challenges
• Oracle Integrated Business Planning
• Customer Stories
• Summary
3
Copyright © 2011, Oracle and/or its affiliates. All rights reserved.
�
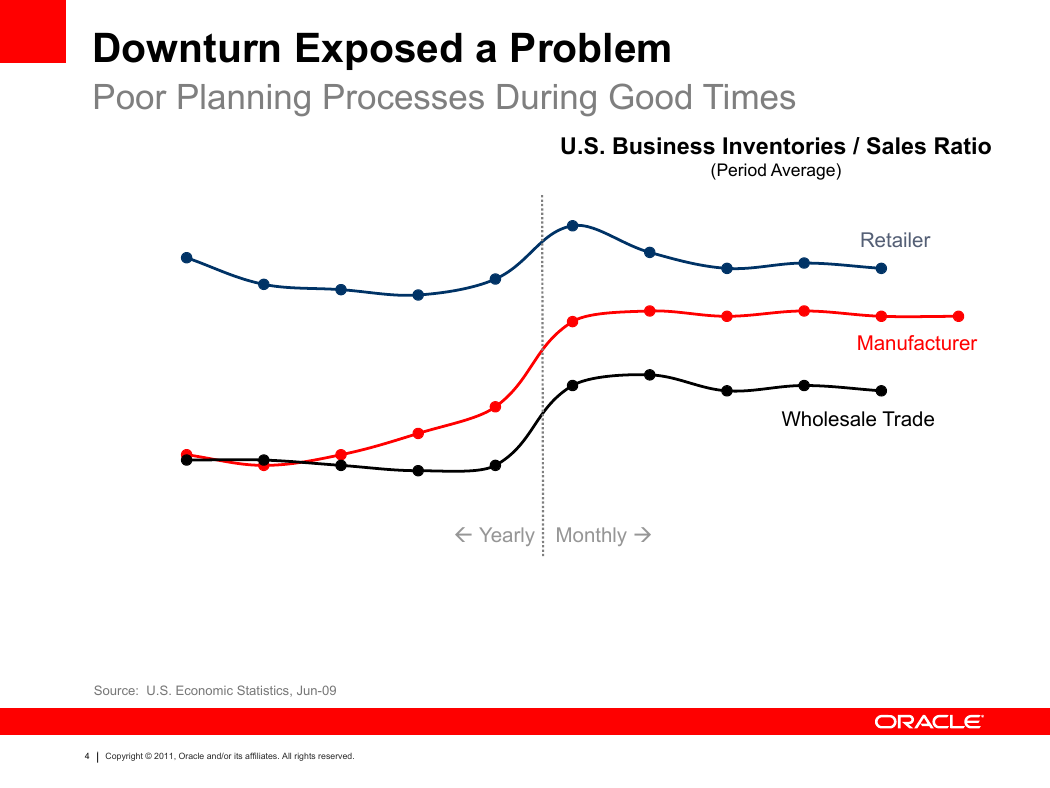
Downturn Exposed a Problem
Poor Planning Processes During Good Times
U.S. Business Inventories / Sales Ratio
(Period Average)
Retailer
Manufacturer
Wholesale Trade
Yearly
Monthly
Source: U.S. Economic Statistics, Jun-09
4
Copyright © 2011, Oracle and/or its affiliates. All rights reserved.
�
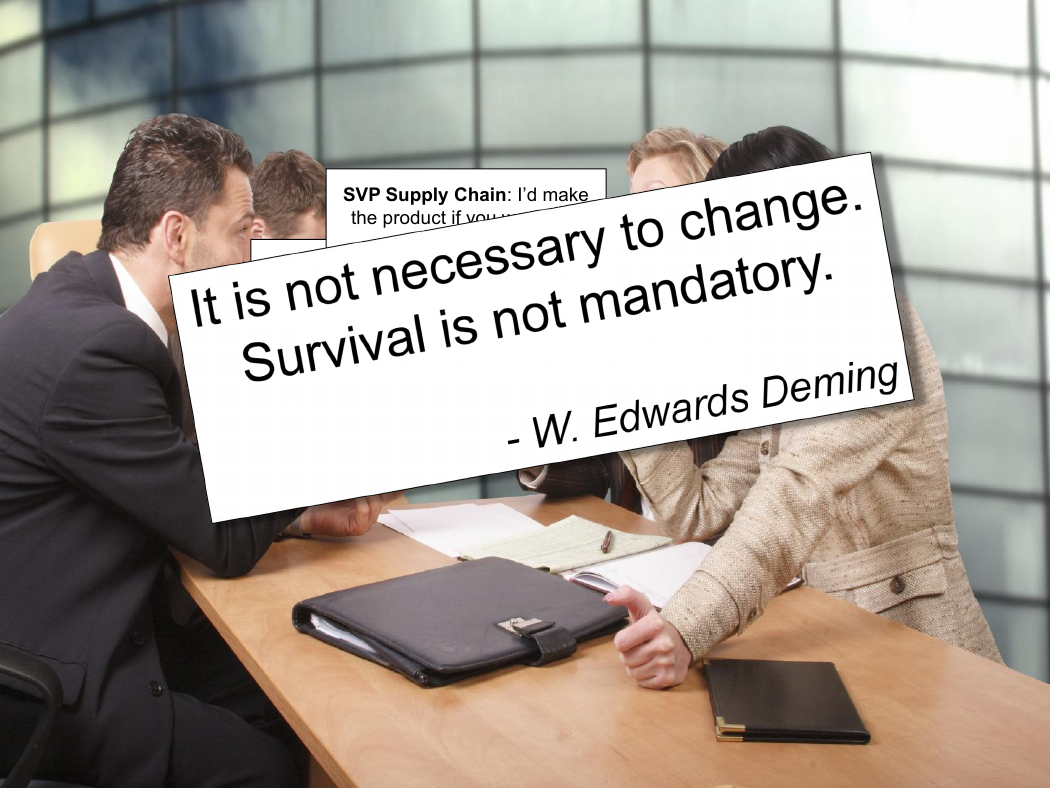
Collaboration?
SVP Supply Chain: I’d make
the product if you would tell
Finance Director: Can I
participate here?? Does
me your number
in excess of 60 days cover?
VP Sales: I’d be making my
number if you could provide
a budget?
anyone here KNOW we have
the product!
Regional President: Why do we continue to short
products when you tell me our inventory levels are
�
Integrated Business Planning
Get to Best Practice S&OP
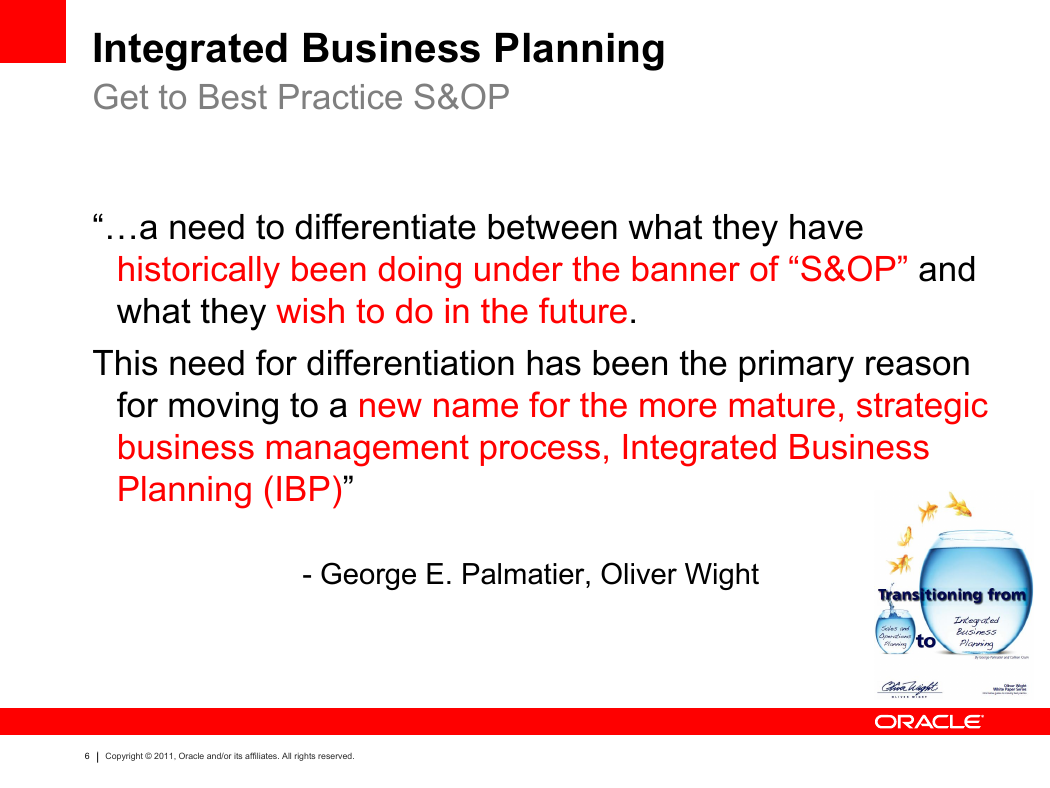
“…a need to differentiate between what they have
historically been doing under the banner of “S&OP” and
what they wish to do in the future.
This need for differentiation has been the primary reason
for moving to a new name for the more mature, strategic
business management process, Integrated Business
Planning (IBP)”
- George E. Palmatier, Oliver Wight
6
Copyright © 2011, Oracle and/or its affiliates. All rights reserved.
�
Integrated Business Planning
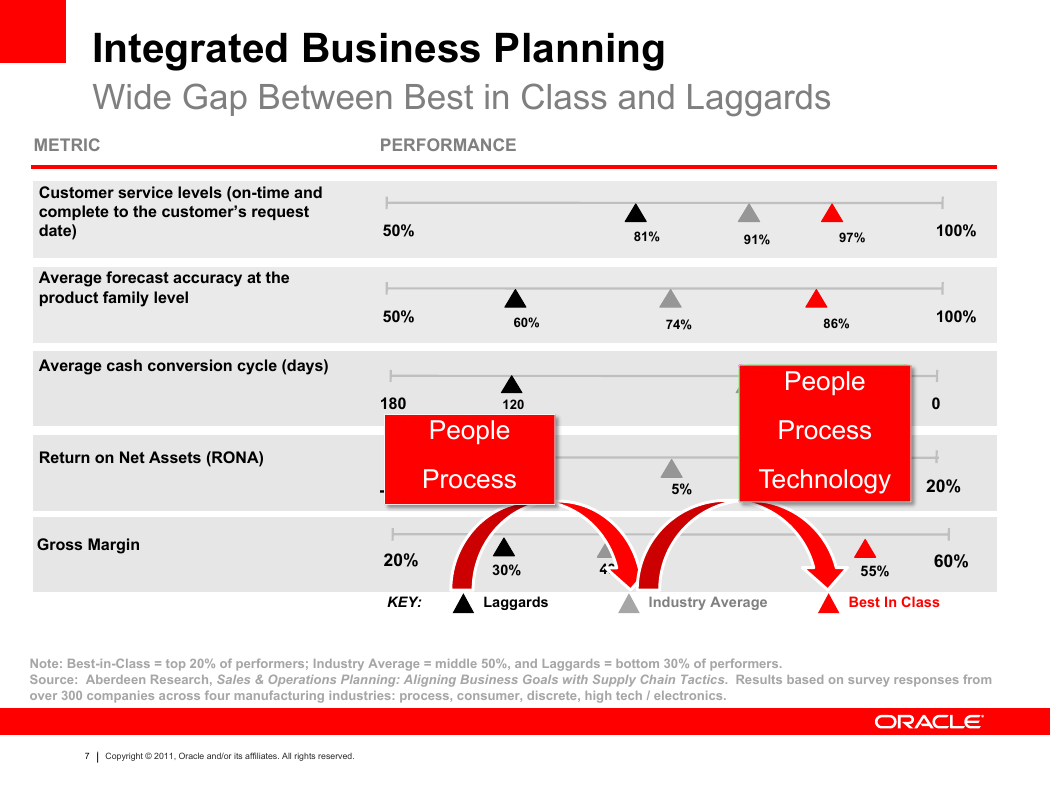
Wide Gap Between Best in Class and Laggards
METRIC
PERFORMANCE
Customer service levels (on-time and
complete to the customer’s request
date)
Average forecast accuracy at the
product family level
Average cash conversion cycle (days)
Return on Net Assets (RONA)
Gross Margin
50%
50%
180
-10%
20%
KEY:
81%
91%
97%
60%
74%
86%
100%
100%
120
People
Process
-5%
60
People
Process
15
0
5%
Technology
15%
20%
30%
Laggards
40%
55%
60%
Industry Average
Best In Class
Note: Best-in-Class = top 20% of performers; Industry Average = middle 50%, and Laggards = bottom 30% of performers.
Source: Aberdeen Research, Sales & Operations Planning: Aligning Business Goals with Supply Chain Tactics. Results based on survey responses from
over 300 companies across four manufacturing industries: process, consumer, discrete, high tech / electronics.
7
Copyright © 2011, Oracle and/or its affiliates. All rights reserved.
�
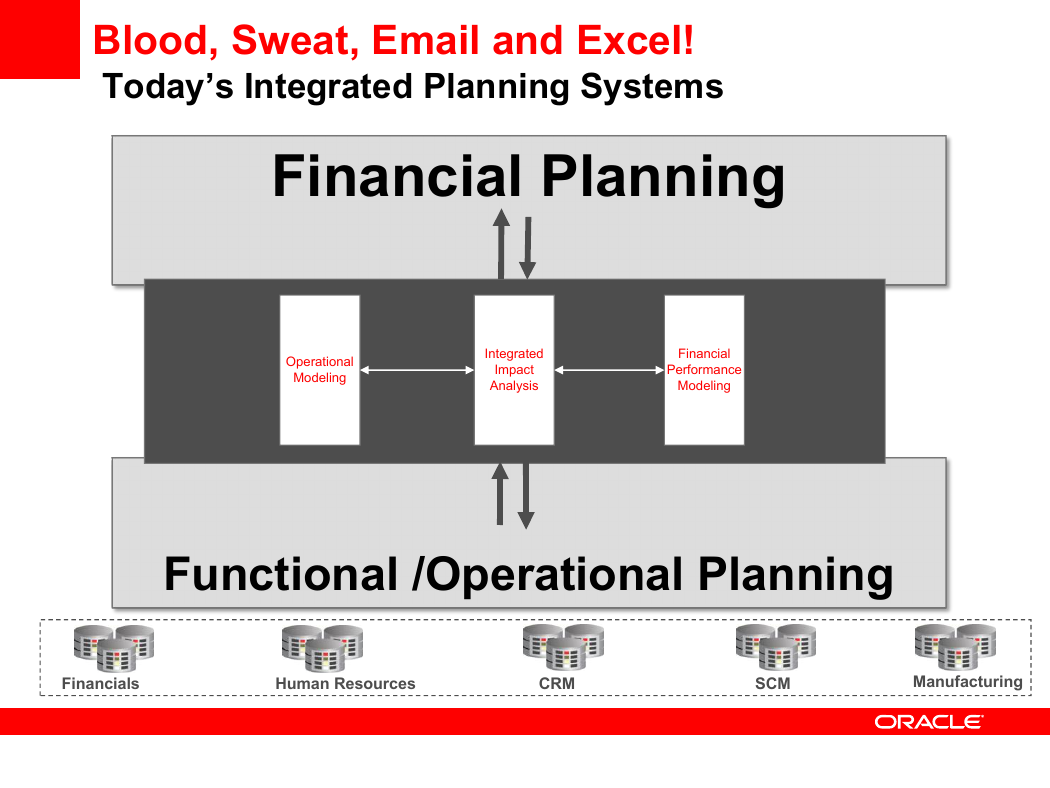
Blood, Sweat, Email and Excel!
Today’s Integrated Planning Systems
Financial Planning
Operational
Modeling
Integrated
Impact
Analysis
Financial
Performance
Modeling
Functional /Operational Planning
Financials
Human Resources
CRM
SCM
Manufacturing
�


 2023年江西萍乡中考道德与法治真题及答案.doc
 2012年重庆南川中考生物真题及答案.doc
 2013年江西师范大学地理学综合及文艺理论基础考研真题.doc
 2020年四川甘孜小升初语文真题及答案I卷.doc
 2020年注册岩土工程师专业基础考试真题及答案.doc
 2023-2024学年福建省厦门市九年级上学期数学月考试题及答案.doc
 2021-2022学年辽宁省沈阳市大东区九年级上学期语文期末试题及答案.doc
 2022-2023学年北京东城区初三第一学期物理期末试卷及答案.doc
 2018上半年江西教师资格初中地理学科知识与教学能力真题及答案.doc
 2012年河北国家公务员申论考试真题及答案-省级.doc
 2020-2021学年江苏省扬州市江都区邵樊片九年级上学期数学第一次质量检测试题及答案.doc
 2022下半年黑龙江教师资格证中学综合素质真题及答案.doc