University of Utah TRMM precipitation and cloud feature database
Description Version 1.0
Chuntao Liu
Department of Meteorology, University of Utah
135 S 1460 E, Room 809, Salt Lake City, UT 84112-0110
(o) 801-581-3336
(fax) 801-585-3681
liu.c.t@utah.edu
http://www.met.utah.edu/zipser/pub/projects/trmm/
2007. 7
�
Table of content
Introduction
1.
2. Level-1
2.1 collocation between 1B11 and 2A25
2.2 Parallax correction
2.3 Colocation between 1B01 and 2A25
2.4 LIS data manipulation
2.5 Output parameters
3. Level-2
3.1 old definition
3.2 parameters in the old definition
3.3 New definitions
3.4 Additional parameters in the new definitions
3.5 Parameters from NCEP reanalysis
4. Level-3
4.1 precipitation data
4.2 Cloud and precipitation feature processing
4.3 Combined level-3 product
5. References
6. Appendix
A. Other by-products
B. Websites
C. Reading software
�
1.
Introduction
The Tropical Rainfall Measuring Mission (TRMM, Kummerow et al., 1998) is a joint
mission between NASA and the National Space Development Agency (NASDA) of
Japan designed to monitor and study tropical rainfall. Onboard instruments including
Precipitation Radar (PR), TRMM Microwave Imager (TMI), Visible Infrared
Radiometers (VIRs), Cloud and Earth Radiant Energy Sensor (CERES) and Lightning
Imaging Sensor (LIS) provide invaluable measurements of atmosphere.
One direction of our research is to generalize the precipitation and cloud features from
TRMM measurements and study the radar, passive microwave and lightning
characteristics of precipitating systems in the Tropics. A database of PR and TMI rain
estimates, VIRS IR brightness temperature and LIS lightning data inside and outside
the PR swath in these precipitation and cloud features is constructed.
Using this database, many valuable researches have been accomplished, including
rainfall estimates validation (Nesbitts et al., 2004), diurnal cycle of precipitation
systems (Nesbitt and Zipser, 2003), global distribution of storms with LIS-detected
lightning (Cecil et al., 2005), deep convection reaching the tropical tropopause layer
(Liu and Zipser, 2005), rainfall production and convective organization (Nesbitt et al.
2006), and the categorization of extreme thunderstorms by their intensity proxies
(Zipser et al., 2006).
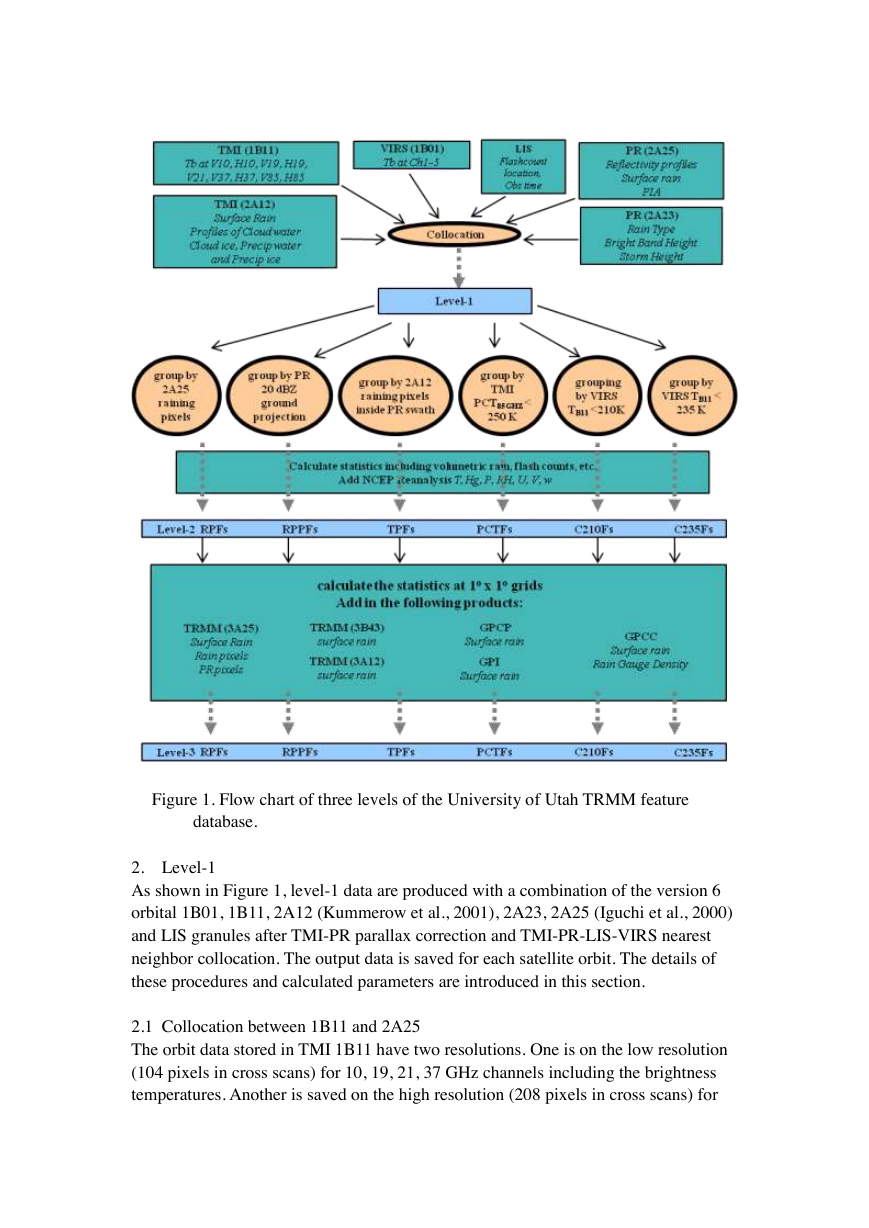
This document describes the TRMM cloud and precipitation database construction
procedures and output parameters in three levels of processing as shown in Figure 1.
�
Figure 1. Flow chart of three levels of the University of Utah TRMM feature
database.
2. Level-1
As shown in Figure 1, level-1 data are produced with a combination of the version 6
orbital 1B01, 1B11, 2A12 (Kummerow et al., 2001), 2A23, 2A25 (Iguchi et al., 2000)
and LIS granules after TMI-PR parallax correction and TMI-PR-LIS-VIRS nearest
neighbor collocation. The output data is saved for each satellite orbit. The details of
these procedures and calculated parameters are introduced in this section.
2.1 Collocation between 1B11 and 2A25
The orbit data stored in TMI 1B11 have two resolutions. One is on the low resolution
(104 pixels in cross scans) for 10, 19, 21, 37 GHz channels including the brightness
temperatures. Another is saved on the high resolution (208 pixels in cross scans) for
�
85GHz channels. The collocation between PR 2A25 and TMI 1B11 are performed
only on the high TMI resolution inside PR swath. The idea is not interpolating the
pixels to PR coordinates. Rather, we assign a TMI pixel to each PR pixel. The method
of ― the nearest neighbor‖ is applied to assign these TMI pixels. As the result, each PR
pixel has a corresponding TMI pixel. Then we save the indices of these TMI pixels for
future use. The collocation for low resolution can be easily obtained by degrading the
indices from high resolution grids.
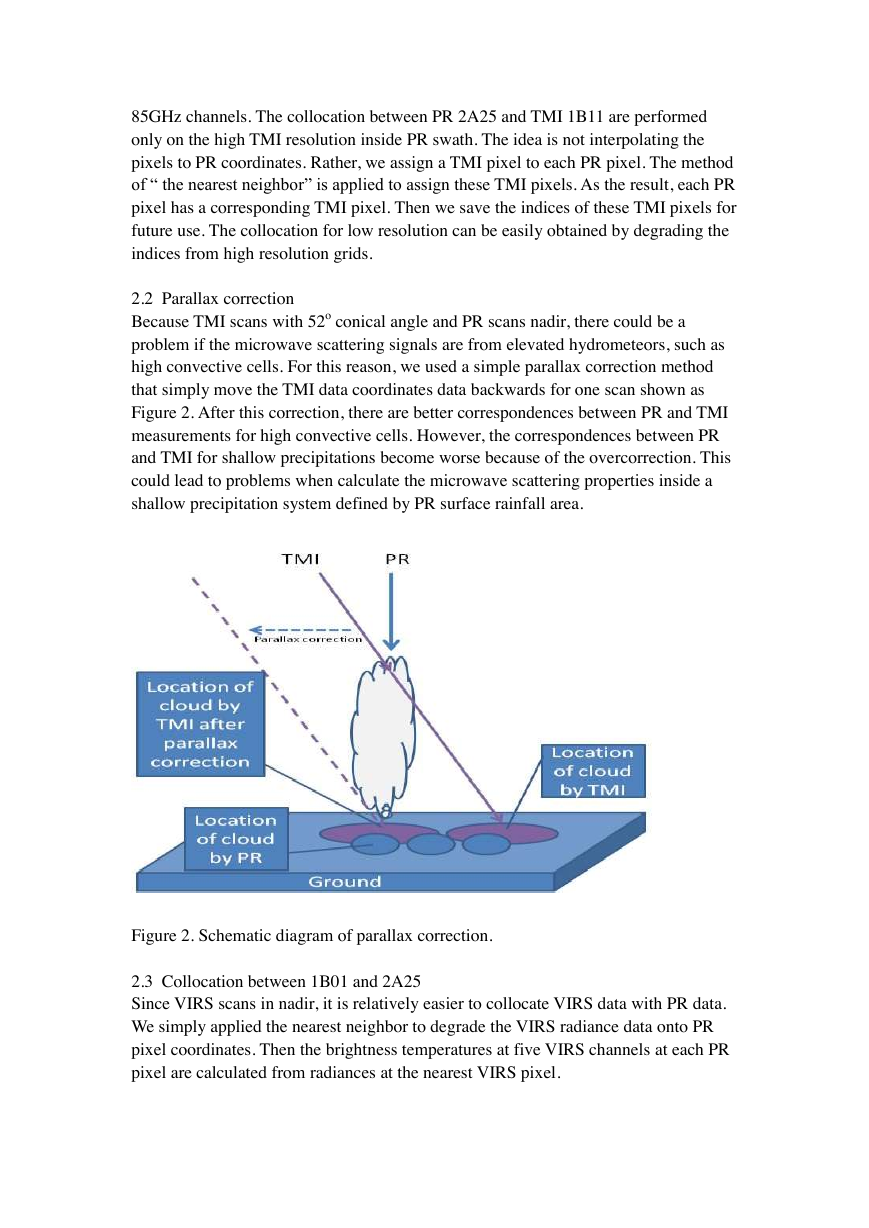
2.2 Parallax correction
Because TMI scans with 52o conical angle and PR scans nadir, there could be a
problem if the microwave scattering signals are from elevated hydrometeors, such as
high convective cells. For this reason, we used a simple parallax correction method
that simply move the TMI data coordinates data backwards for one scan shown as
Figure 2. After this correction, there are better correspondences between PR and TMI
measurements for high convective cells. However, the correspondences between PR
and TMI for shallow precipitations become worse because of the overcorrection. This
could lead to problems when calculate the microwave scattering properties inside a
shallow precipitation system defined by PR surface rainfall area.
Figure 2. Schematic diagram of parallax correction.
2.3 Collocation between 1B01 and 2A25
Since VIRS scans in nadir, it is relatively easier to collocate VIRS data with PR data.
We simply applied the nearest neighbor to degrade the VIRS radiance data onto PR
pixel coordinates. Then the brightness temperatures at five VIRS channels at each PR
pixel are calculated from radiances at the nearest VIRS pixel.
�
2.4 LIS data manipulation
LIS data collocation method was developed by Chris West and Dan Cecil in 1999.
First, the observation view time is interpolated into 0.1 degree resolution, then use
nearest neighbor method to assign each one of the flash event to TMI pixel
coordinates. Following the collocation between PR and TMI, each flash can be
assigned to a PR pixel for further analysis.
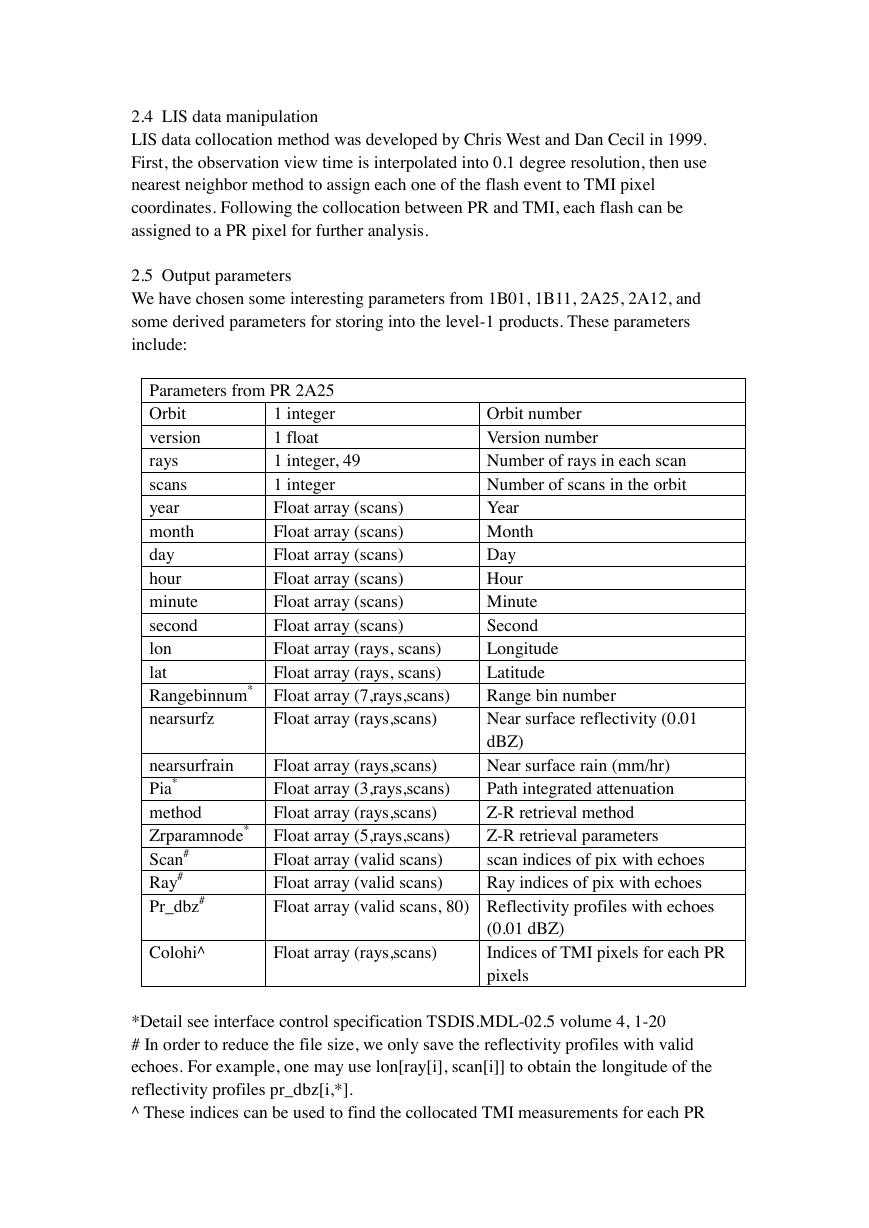
2.5 Output parameters
We have chosen some interesting parameters from 1B01, 1B11, 2A25, 2A12, and
some derived parameters for storing into the level-1 products. These parameters
include:
Parameters from PR 2A25
Orbit
1 integer
version
1 float
rays
1 integer, 49
scans
1 integer
year
Float array (scans)
month
Float array (scans)
day
Float array (scans)
hour
Float array (scans)
minute
Float array (scans)
second
Float array (scans)
lon
Float array (rays, scans)
lat
Float array (rays, scans)
Rangebinnum* Float array (7,rays,scans)
nearsurfz
Float array (rays,scans)
Orbit number
Version number
Number of rays in each scan
Number of scans in the orbit
Year
Month
Day
Hour
Minute
Second
Longitude
Latitude
Range bin number
Near surface reflectivity (0.01
dBZ)
Near surface rain (mm/hr)
Path integrated attenuation
Z-R retrieval method
Z-R retrieval parameters
scan indices of pix with echoes
Ray indices of pix with echoes
nearsurfrain
Pia*
method
Zrparamnode*
Scan#
Ray#
Pr_dbz#
Float array (rays,scans)
Float array (3,rays,scans)
Float array (rays,scans)
Float array (5,rays,scans)
Float array (valid scans)
Float array (valid scans)
Float array (valid scans, 80) Reflectivity profiles with echoes
Colohi^
Float array (rays,scans)
(0.01 dBZ)
Indices of TMI pixels for each PR
pixels
*Detail see interface control specification TSDIS.MDL-02.5 volume 4, 1-20
# In order to reduce the file size, we only save the reflectivity profiles with valid
echoes. For example, one may use lon[ray[i], scan[i]] to obtain the longitude of the
reflectivity profiles pr_dbz[i,*].
^ These indices can be used to find the collocated TMI measurements for each PR
�
pixels. For example, one may use tmi.rain[colohi[I,j]] to find the 2A12 rainfall
estimates for PR pixel (i,j) at longitude lon[I,j] and latitude lat[I,j].
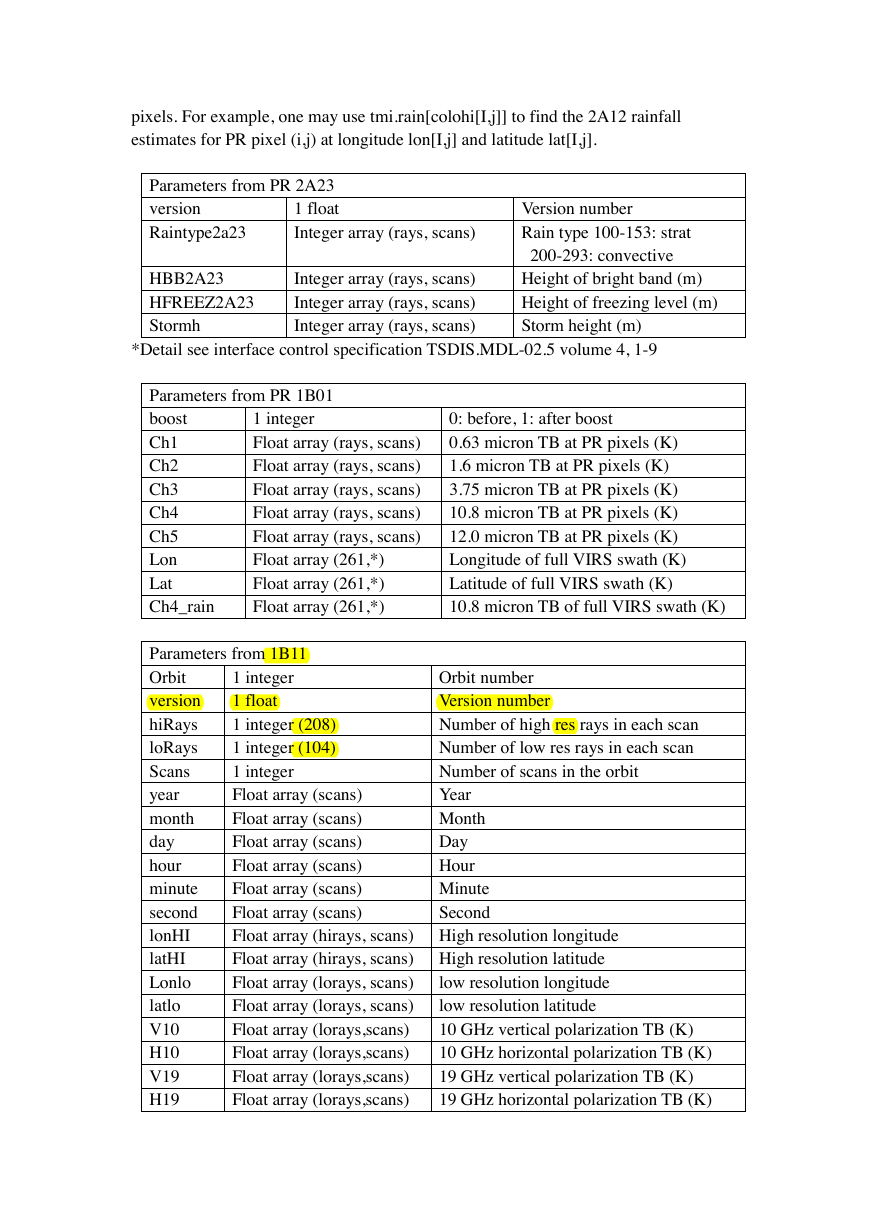
Parameters from PR 2A23
1 float
version
Raintype2a23
Integer array (rays, scans)
HBB2A23
HFREEZ2A23
Stormh
Integer array (rays, scans)
Integer array (rays, scans)
Integer array (rays, scans)
Version number
Rain type 100-153: strat
200-293: convective
Height of bright band (m)
Height of freezing level (m)
Storm height (m)
*Detail see interface control specification TSDIS.MDL-02.5 volume 4, 1-9
Parameters from PR 1B01
boost
Ch1
Ch2
Ch3
Ch4
Ch5
Lon
Lat
Ch4_rain
1 integer
Float array (rays, scans)
Float array (rays, scans)
Float array (rays, scans)
Float array (rays, scans)
Float array (rays, scans)
Float array (261,*)
Float array (261,*)
Float array (261,*)
0: before, 1: after boost
0.63 micron TB at PR pixels (K)
1.6 micron TB at PR pixels (K)
3.75 micron TB at PR pixels (K)
10.8 micron TB at PR pixels (K)
12.0 micron TB at PR pixels (K)
Longitude of full VIRS swath (K)
Latitude of full VIRS swath (K)
10.8 micron TB of full VIRS swath (K)
Orbit number
Version number
Number of high res rays in each scan
Number of low res rays in each scan
Number of scans in the orbit
Year
Month
Day
Hour
Minute
Second
Parameters from 1B11
1 integer
Orbit
version
1 float
1 integer (208)
hiRays
1 integer (104)
loRays
Scans
1 integer
Float array (scans)
year
Float array (scans)
month
day
Float array (scans)
Float array (scans)
hour
Float array (scans)
minute
second
Float array (scans)
Float array (hirays, scans) High resolution longitude
lonHI
Float array (hirays, scans) High resolution latitude
latHI
Lonlo
Float array (lorays, scans)
low resolution longitude
low resolution latitude
Float array (lorays, scans)
latlo
10 GHz vertical polarization TB (K)
Float array (lorays,scans)
V10
H10
Float array (lorays,scans)
10 GHz horizontal polarization TB (K)
19 GHz vertical polarization TB (K)
Float array (lorays,scans)
V19
H19
Float array (lorays,scans)
19 GHz horizontal polarization TB (K)
�
V21
V37
H37
V85
H85
Float array (lorays,scans)
Float array (lorays,scans)
Float array (lorays,scans)
Float array (hirays,scans)
Float array (hirays,scans)
21 GHz vertical polarization TB (K)
37 GHz vertical polarization TB (K)
37 GHz horizontal polarization TB (K)
85 GHz vertical polarization TB (K)
85 GHz horizontal polarization TB (K)
TMI surface rainfall (mm/hr)
Surface flag
37 GHz polarization corrected TB (K)
85 GHz polarization corrected TB (K)
Float array (hirays,scans)
Float array (hirays,scans) Confidence of retrieval
Float array (hirays,scans)
Float array (hirays,scans)
Float array (hirays,scans)
Float array (valid pix, 14) Cloud water profile (mg/m3)
Float array (valid pix, 14) Cloud ice profile(mg/m3)
Parameters from PR 2A12
Rain
Confidence*
Surfaceflag*
PCT37
PCT85
Cld_water*
Cld_ice*
Precip_water* Float array (valid pix, 14) Precipitation water profile (mg/m3)
Float array (valid pix, 14) Precipitation ice profile (mg/m3)
Precip_ice*
Profile_ray#
Indices of rays with surface rain
Float array (valid pix)
Profile_scan# Float array (valid pix)
Indices of scans with surface rain
*Detail see interface control specification TSDIS.MDL-02.5 volume 4, 1-1
# In order to reduce the file size, we only save the hrdrometeor profiles over rainfall
area. For example, one may use lonhi[profile_ray[i],profile_ scan[i]] to obtain the
longitude of the cloud water profiles cld_water[i,*].
Above parameters are saved into ―HDF‖ format with naming rules as
―1Z99.yymmdd.orbit.version.HDF‖, and there is an IDL program
―read_pf_level1_hdf.pro‖ for access these level-1 files.
3. Level-2
The first step to create the level-2 data is to define the features. There are two groups
of feature definitions with development of the database. The old-definition
(1999-2005, Nesbitt et al., 2000) is a ―hybrid definition‖ using information from both
PR and TMI. The new definition was developed recently (Sep 2006, Liu et al., 2007)
by using ―pure‖ information from individual measurements. Currently all TRMM data
are processed with both groups of definitions. This section will introduce these
definitions separately.
3.1 Old definition
The first TRMM Precipitation Feature (PF) was developed by Dan Cecil, Steve
Nesbitt and Ed Zipser around 1998-1999 (Nesbitt et al., 2000). The concept was to
use the information from both TMI and PR, and defined the PFs with area of PR
pixels with 20 dBZ at near surface or TMI 85GHz Polarization Corrected Temperature
(PCT, Spence et al., 1989) colder than 250 K. Then summarize the precipitation,
convective properties inside the PF area. By using this definition, many valuable
�





 2023年江西萍乡中考道德与法治真题及答案.doc
 2012年重庆南川中考生物真题及答案.doc
 2013年江西师范大学地理学综合及文艺理论基础考研真题.doc
 2020年四川甘孜小升初语文真题及答案I卷.doc
 2020年注册岩土工程师专业基础考试真题及答案.doc
 2023-2024学年福建省厦门市九年级上学期数学月考试题及答案.doc
 2021-2022学年辽宁省沈阳市大东区九年级上学期语文期末试题及答案.doc
 2022-2023学年北京东城区初三第一学期物理期末试卷及答案.doc
 2018上半年江西教师资格初中地理学科知识与教学能力真题及答案.doc
 2012年河北国家公务员申论考试真题及答案-省级.doc
 2020-2021学年江苏省扬州市江都区邵樊片九年级上学期数学第一次质量检测试题及答案.doc
 2022下半年黑龙江教师资格证中学综合素质真题及答案.doc