LabVIEW Sound and Vibration Toolkit User Manual
Support
Worldwide Technical Support and Product Information
National Instruments Corporate Headquarters
Worldwide Offices
Important Information
Warranty
Copyright
Trademarks
Patents
WARNING REGARDING USE OF NATIONAL INSTRUMENTS PRODUCTS
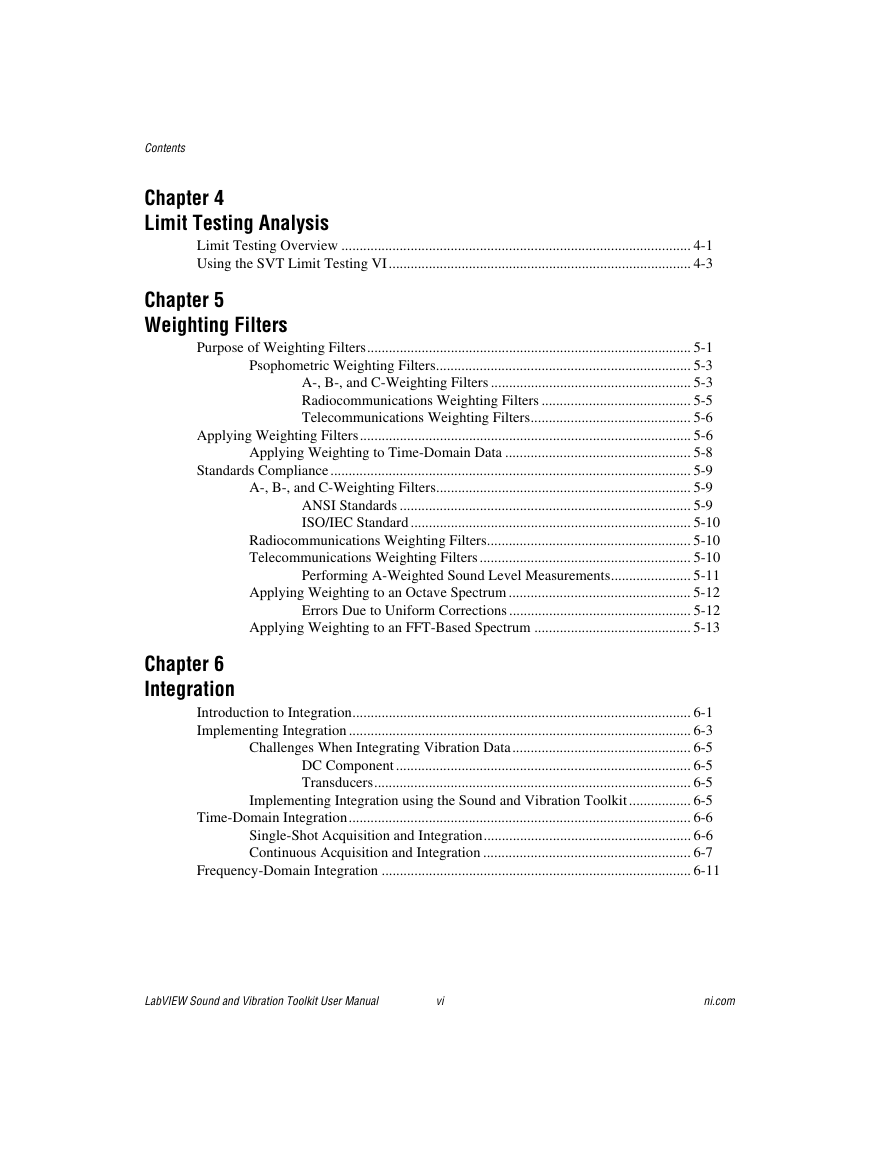
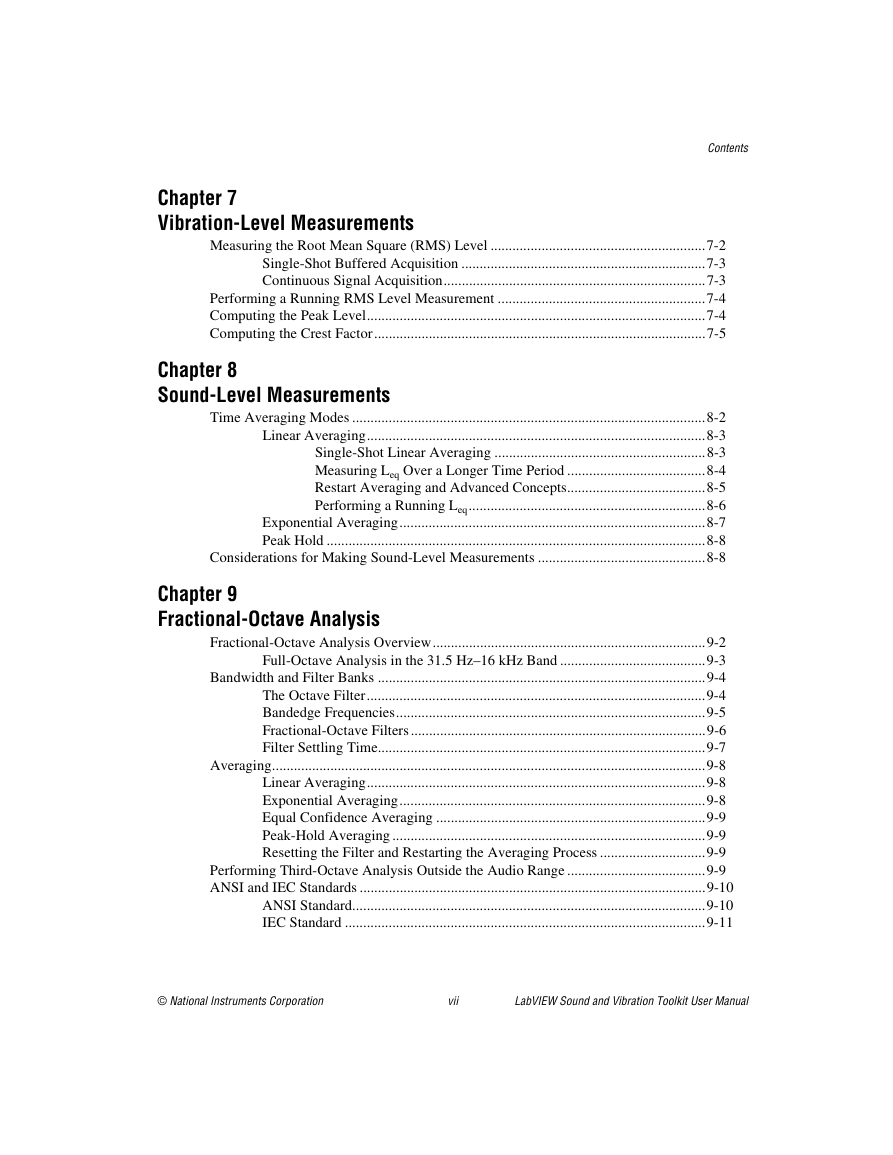
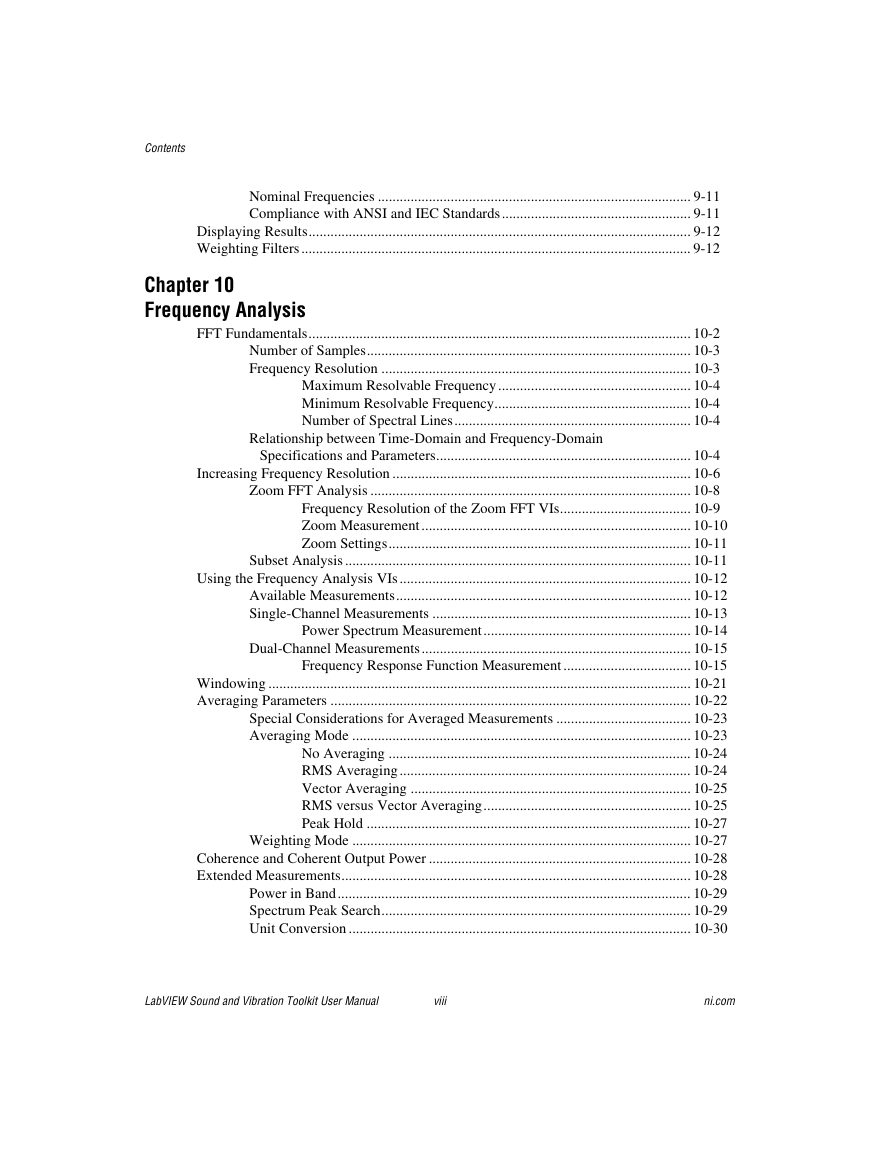
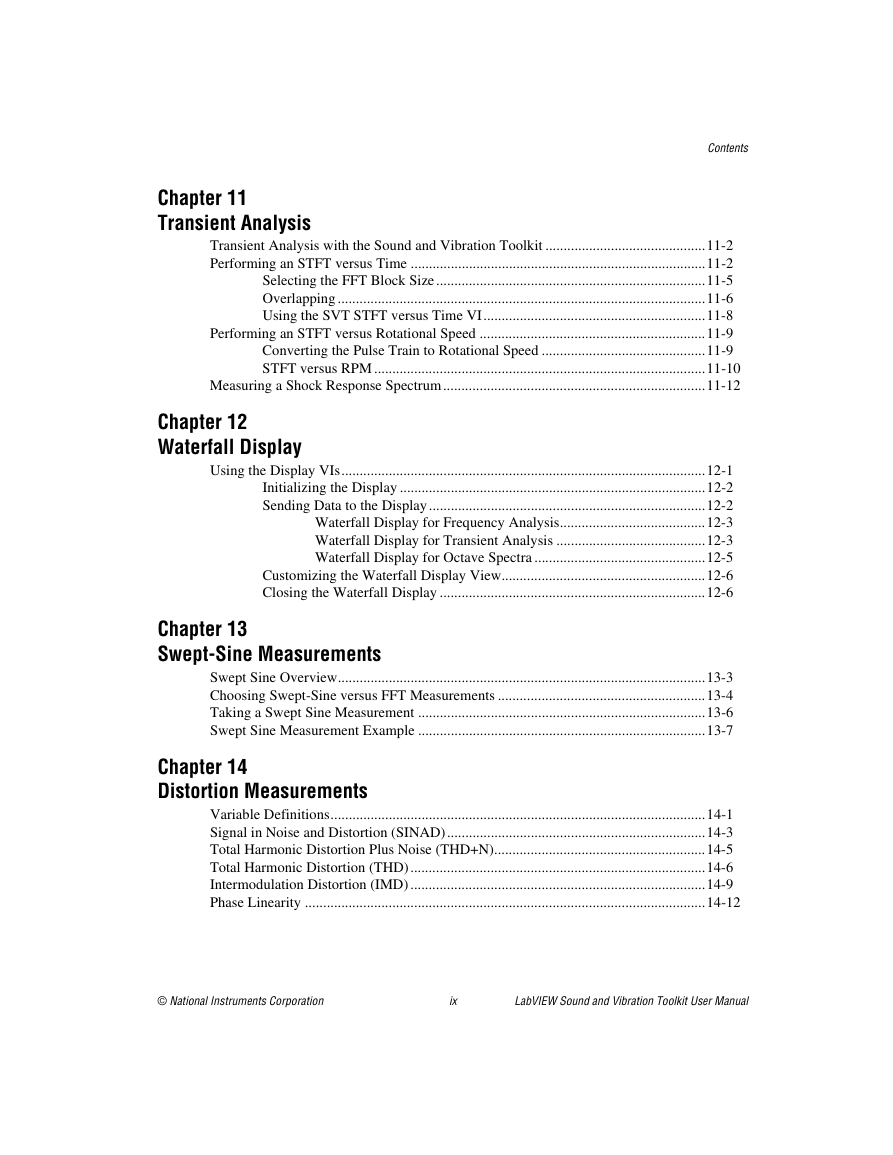
Contents
About This Manual
Conventions
Related Documentation
Chapter 1 Introduction
Sound and Vibration Toolkit
Figure 1-1. Sound and Vibration Toolkit Overview
Toolkit Palettes
Scaling
Calibration
Limit Testing
Weighting
Integration
Generation
Vibration Level
Sound Level
Octave Analysis
Frequency Analysis
Transient Analysis
Waterfall Display
Swept Sine
Distortion
Single-Tone
Front Panel Displays
Examples
Chapter 2 Dynamic Signals
Acquiring and Simulating Dynamic Signals
Figure 2-1. Relationship of the Data Source to the Sound and Vibration Measurement Process
Aliasing
Figure 2-2. Simulated Data Aliasing
Time Continuity
Chapter 3 Scaling and Calibration
Scaling to EU
Figure 3-1. Relationship of Scaling to the Sound and Vibration Measurement Process
Performing System Calibration
Propagation Delay Calibration
Figure 3-2. Measuring the Device Propagation Delay
Figure 3-3. Propagation Delay Measurement of an NI PCI-6052E
Figure 3-4. NI PXI-4461 Propagation Delay with a 204.8 kHz Sample Rate
Figure 3-5. NI PXI-4461 Propagation Delay versus Sample Rate
Figure 3-6. Measuring the DUT Propagation Delay
Chapter 4 Limit Testing Analysis
Limit Testing Overview
Figure 4-1. Relationship of Limit Testing to the Sound and Vibration Measurement Process
Table 4-1. Compatible Data Types for SVT Limit Testing VI
Using the SVT Limit Testing VI
Table 4-2. Criteria for Upper and Lower Limits
Figure 4-2. Range Detection Performed in Engineering Units
Figure 4-3. Range Detection Test on a Time-Domain Signal
Figure 4-4. Test Scalar Measurement
Figure 4-5. Limit Testing on THD Measurements
Figure 4-6. Perform Continuous Mask Test on Power Spectrum
Figure 4-7. Continuous Mask Test on a Power Spectrum
Figure 4-8. Discontinuous Mask Test on Swept-Sine Frequency Response
Figure 4-9. Discontinuous Mask Test on a Swept-Sine Frequency Response
Chapter 5 Weighting Filters
Purpose of Weighting Filters
Figure 5-1. Frequency Response of a Typical Instrumentation-Grade Microphone
Figure 5-2. Equal Loudness Curves
Psophometric Weighting Filters
A-, B-, and C-Weighting Filters
Figure 5-3. Relative Attenuation of A-, B-, and C-Weighting Filters
Radiocommunications Weighting Filters
Figure 5-4. Relative Attenuation of Radiocommunications Weighting Filters
Telecommunications Weighting Filters
Figure 5-5. Relative Attenuation of Telecommunications Weighting Filters
Applying Weighting Filters
Figure 5-6. Relationship of Weighting to the Sound and Vibration Measurement Process
Applying Weighting to Time-Domain Data
Table 5-1. Supported Psophometric Filter Rates
Standards Compliance
A-, B-, and C-Weighting Filters
ANSI Standards
ISO/IEC Standard
Radiocommunications Weighting Filters
Telecommunications Weighting Filters
Performing A-Weighted Sound Level Measurements
Figure 5-7. A-Weighting of a Simulated Time-Domain Signal Block Diagram
Figure 5-8. A-Weighting Response in the Time Domain
Applying Weighting to an Octave Spectrum
Figure 5-9. Applying Weighting to a Third-Octave Spectrum
Errors Due to Uniform Corrections
Figure 5-10. Potential Measurement Error for A-Weighting at Low Frequency
Applying Weighting to an FFT-Based Spectrum
Figure 5-11. Applying Frequency Weighting to a Power Spectrum
Figure 5-12. Applying Weighting before Computing the Power Spectrum
Chapter 6 Integration
Introduction to Integration
Figure 6-1. Integration of a 0.5 Hz Sine Wave
Implementing Integration
Figure 6-2. Relationship of Integration to the Sound and Vibration Measurement Process
Challenges When Integrating Vibration Data
DC Component
Transducers
Implementing Integration using the Sound and Vibration Toolkit
Time-Domain Integration
Single-Shot Acquisition and Integration
Figure 6-3. Block Diagram for Single-Shot Acquisition and Integration
Figure 6-4. Transient Response in Single-Shot Acquisition and Integration
Continuous Acquisition and Integration
Figure 6-5. Continuous Acquisition and Integration
Figure 6-6. Settled Response of Continuous Acquisition and Integration
Figure 6-7. Frequency Response for Single Integration
Figure 6-8. Frequency Response for Double Integration
Frequency-Domain Integration
Figure 6-9. Integration in the Time Domain and in the Frequency Domain
Figure 6-10. Power Spectra of the Integrated Signal
Chapter 7 Vibration-Level Measurements
Figure 7-1. Relationship of Vibration-Level Measurements to the Sound and Vibration Measurement Process
Measuring the Root Mean Square (RMS) Level
Single-Shot Buffered Acquisition
Figure 7-2. Single-Shot Buffered Acquisition and RMS Level VI
Continuous Signal Acquisition
Figure 7-3. Continuous Data Acquisition and RMS Level VI
Performing a Running RMS Level Measurement
Figure 7-4. Running RMS VI
Computing the Peak Level
Computing the Crest Factor
Figure 7-5. Crest Factor VI
Chapter 8 Sound-Level Measurements
Figure 8-1. Relationship of Sound-level Measurements to the Sound and Vibration Measurement Process
Time Averaging Modes
Linear Averaging
Single-Shot Linear Averaging
Figure 8-2. Single-Shot Leq VI
Figure 8-3. Leq and Instantaneous Sound Pressure Level versus Time
Measuring Leq Over a Longer Time Period
Figure 8-4. One Hour Leq VI
Restart Averaging and Advanced Concepts
Figure 8-5. Block Diagram for Reverberation VI
Figure 8-6. 10-Second Reverberation Time Measurement
Performing a Running Leq
Exponential Averaging
Figure 8-7. Exponential Averaging with Slow Time Constant VI
Peak Hold
Considerations for Making Sound-Level Measurements
Chapter 9 Fractional-Octave Analysis
Figure 9-1. Relationship of Fractional-Octave Analysis to the Sound and Vibration Process
Fractional-Octave Analysis Overview
Full-Octave Analysis in the 31.5 Hz-16 kHz Band
Figure 9-2. Full-Octave Center Frequencies
Figure 9-3. Full-Octave Spectrum
Bandwidth and Filter Banks
The Octave Filter
Figure 9-4. Octave Filter
Bandedge Frequencies
Fractional-Octave Filters
Figure 9-5. Response of 1/3 Octave Filters
Filter Settling Time
Averaging
Linear Averaging
Exponential Averaging
Figure 9-6. 1/3 Octave Analysis with Fast Exponential Averaging VI
Equal Confidence Averaging
Peak-Hold Averaging
Resetting the Filter and Restarting the Averaging Process
Performing Third-Octave Analysis Outside the Audio Range
Figure 9-7. Performing 1/3 Octave Analysis Outside Standard Bands
ANSI and IEC Standards
ANSI Standard
IEC Standard
Nominal Frequencies
Compliance with ANSI and IEC Standards
Displaying Results
Weighting Filters
Chapter 10 Frequency Analysis
Figure 10-1. Relationship of Frequency Analysis to the Sound and Vibration Measurement Process
FFT Fundamentals
Number of Samples
Frequency Resolution
Maximum Resolvable Frequency
Minimum Resolvable Frequency
Number of Spectral Lines
Relationship between Time-Domain and Frequency-Domain Specifications and Parameters
Table 10-1. Time-Domain Specifications to Frequency-Domain Parameters
Table 10-2. Frequency-Domain Specifications to Time-Domain Parameters
Increasing Frequency Resolution
Figure 10-2. Power Spectrum Obtained with an Acquisition Time of 10 ms
Figure 10-3. Power Spectrum Obtained with an Acquisition Time of 1 s
Zoom FFT Analysis
Frequency Resolution of the Zoom FFT VIs
Zoom Measurement
Figure 10-4. Performing a Zoom Power Spectrum Measurement
Figure 10-5. Zoom Power Spectrum Measurement Results
Zoom Settings
Figure 10-6. Zoom Settings Control
Subset Analysis
Using the Frequency Analysis VIs
Available Measurements
Single-Channel Measurements
Power Spectrum Measurement
Figure 10-7. Single-Shot Acquisition
Figure 10-8. Continuous Acquisition
Dual-Channel Measurements
Frequency Response Function Measurement
Figure 10-9. Connection Scheme for FRF Measurement with an NI 4461 Device
Figure 10-10. FRF Block Diagram
Figure 10-11. Time-Domain Stimulus and Response Signals
Figure 10-12. Frequency Response without Averaging
Figure 10-13. Frequency Response with Averaging
Figure 10-14. Frequency Response with 4,096 Samples
Windowing
Figure 10-15. Effect of Windowing on Periodicity
Table 10-3. Supported Time-Domain Windows
Averaging Parameters
Figure 10-16. Averaging Parameters Control
Special Considerations for Averaged Measurements
Averaging Mode
No Averaging
RMS Averaging
Vector Averaging
RMS versus Vector Averaging
Figure 10-17. Effect of Averaging Mode on Averaged Spectrum
Peak Hold
Weighting Mode
Coherence and Coherent Output Power
Extended Measurements
Power in Band
Table 10-4. Power in Band Equations Based on Input Type
Spectrum Peak Search
Unit Conversion
Table 10-5. Desired Scaling Parameters
Chapter 11 Transient Analysis
Figure 11-1. Relationship of Transient Analysis to the Sound and Vibration Measurement Process
Transient Analysis with the Sound and Vibration Toolkit
Performing an STFT versus Time
Figure 11-2. Chirp Signal
Figure 11-3. Baseband FFT on a Chirp Signal
Figure 11-4. Time Segment Control
Selecting the FFT Block Size
Figure 11-5. STFT Using a 1,024 Sample Block Size
Figure 11-6. STFT Using a 4,096 Sample Block Size
Overlapping
Figure 11-7. 50% Overlap
Figure 11-8. Subdivisions of the Time-Domain Waveform
Using the SVT STFT versus Time VI
Figure 11-9. Use of the SVT STFT versus Time VI
Figure 11-10. STFT versus Time Graph
Performing an STFT versus Rotational Speed
Converting the Pulse Train to Rotational Speed
Figure 11-11. Tach Info Control
Figure 11-12. Tachometer Signal
Figure 11-13. Result from SVT Convert to RPM (analog) VI
STFT versus RPM
Figure 11-14. Microphone Signal Obtained during Engine Run-Up
Figure 11-15. Rotational Speed as a Function of Time during Engine Run-Up
Figure 11-16. Intensity Graph of Sound Pressure Level for an Engine Run-Up
Measuring a Shock Response Spectrum
Figure 11-17. SDOF System Response to a Half-Sine Shock
Figure 11-18. Half-Sine Pulse SRS (Maximax)
Figure 11-19. Using the SVT Shock Response Spectrum VI
Figure 11-20. Acquired SRS (Maximax)
Chapter 12 Waterfall Display
Using the Display VIs
Figure 12-1. Waterfall Display for Frequency Analysis
Initializing the Display
Sending Data to the Display
Waterfall Display for Frequency Analysis
Figure 12-2. Waterfall Display for Frequency Analysis VI Block Diagram
Waterfall Display for Transient Analysis
Figure 12-3. STFT VI Block Diagram
Figure 12-4. STFT Waterfall Display
Waterfall Display for Octave Spectra
Figure 12-5. Block Diagram for VI Displaying Octave Spectra
Figure 12-6. Waterfall Display for Octave Spectra Analysis
Customizing the Waterfall Display View
Figure 12-7. Waterfall Graph Controls
Closing the Waterfall Display
Chapter 13 Swept-Sine Measurements
Figure 13-1. Swept-Sine Measurement Flowchart
Swept Sine Overview
Figure 13-2. Sweeping Swept Sine Example
Figure 13-3. Stepping Swept Sine Example
Choosing Swept-Sine versus FFT Measurements
Table 13-1. Swept Sine and FFT Differences
Figure 13-4. Swept-Sine and FFT Measurements
Taking a Swept Sine Measurement
Figure 13-5. Customizing a Swept Sine Measurement
Swept Sine Measurement Example
Figure 13-6. Swept-Sine Measurement Connection Diagram
Figure 13-7. Block Diagram of SVXMPL_Swept Sine FRF DAQmx VI
Table 13-2. Swept Sine Measurement Steps
Figure 13-8. Time Domain Results
Figure 13-9. Magnitude and Phase Response of a 1 kHz Notch Filter
Figure 13-10. THD versus Frequency
Figure 13-11. THD versus Frequency Results
Chapter 14 Distortion Measurements
Variable Definitions
Figure 14-1. Relationship of Distortion Analysis to the Sound and Vibration Measurement Process
Signal in Noise and Distortion (SINAD)
Figure 14-2. Removing DC Voltage from Low-Frequency SINAD Measurement
Figure 14-3. Front Panel of SINAD Measurement VI
Total Harmonic Distortion Plus Noise (THD+N)
Total Harmonic Distortion (THD)
Figure 14-4. Distortion Test VI
Figure 14-5. Distortion Test Measured Magnitude Spectrum
Table 14-1. Distortion Test Measurement Results
Intermodulation Distortion (IMD)
Figure 14-6. IMD Test Signal with High-Frequency Carrier Tone Sidebands
Figure 14-7. IMD Components as Multiples of the Difference Frequency
Table 14-2. IMD Standards and Typical Applications
Phase Linearity
Figure 14-8. Phase Linearity Graph
Figure 14-9. Deviation of the Measured Phase
Chapter 15 Single-Tone Measurements
Single-Tone Measurement Overview
Figure 15-1. Dual-Channel Measurement
Figure 15-2. Single-Channel Measurement
Figure 15-3. Relationship of Single-Tone Measurements to the Sound and Vibration Measurement Process
Gain and Phase
Crosstalk
Figure 15-4. Difference between Gain and Phase Measurement and Crosstalk Measurement
Gain
Figure 15-5. Connecting the Amplitude of the Excitation Tone to the Amplitude Input
Idle-Channel Noise
Dynamic Range
Figure 15-6. Measured Spectrum from Dynamic Range Test
Spurious Free Dynamic Range (SFDR)
Figure 15-7. SFDR Test Spectrum
Appendix A References
Appendix B Technical Support and Professional Services
Glossary
Numbers/Symbols
A-B
C-D
E-F
G-H
I-L
M-N
O-P
R-S
T
V-W
Index
A-C
D-E
F
G-I
K-N
O-S
T
V
W-Z


 2023年江西萍乡中考道德与法治真题及答案.doc
 2012年重庆南川中考生物真题及答案.doc
 2013年江西师范大学地理学综合及文艺理论基础考研真题.doc
 2020年四川甘孜小升初语文真题及答案I卷.doc
 2020年注册岩土工程师专业基础考试真题及答案.doc
 2023-2024学年福建省厦门市九年级上学期数学月考试题及答案.doc
 2021-2022学年辽宁省沈阳市大东区九年级上学期语文期末试题及答案.doc
 2022-2023学年北京东城区初三第一学期物理期末试卷及答案.doc
 2018上半年江西教师资格初中地理学科知识与教学能力真题及答案.doc
 2012年河北国家公务员申论考试真题及答案-省级.doc
 2020-2021学年江苏省扬州市江都区邵樊片九年级上学期数学第一次质量检测试题及答案.doc
 2022下半年黑龙江教师资格证中学综合素质真题及答案.doc