Demystifying Segnet
Written by : Sirawat Pitaksarit
Inner workings of Segnet is not very well documented. In this guide, I researched into Segnet by
observations and script digging. Along with this, we can understand about neural network on
implementation side like how people actually implement them.
Demystifying Segnet
First of all if you follow the previous guide
Let’s look at SegNet’s output
What does SegNet Tutorial’s training data looks like?
What’s wrong with the CamVid training data
Answering the questions
Questions not answered
Finally, how to train our own data?
Conclusion
1
2
2
4
8
11
13
14
14
�1
�
First of all if you follow the previous guide
The demo’s Scripts/webcam_demo.py execution command is :
python Scripts/webcam_demo.py --model Example_Models/
segnet_model_driving_webdemo.prototxt --weights Example_Models/
segnet_weights_driving_webdemo.caffemodel --colours Scripts/
camvid12.png
The trained data is segnet_weights_driving_webdemo.caffemodel. This outputs colored
images. Keep in mind that this image never contains the color black as we will come back to this
later.
Let’s look at SegNet’s output
In Segnet-Tutorial repository, if you looked in Scripts/webcam_demo.py
segmentation_ind = np.squeeze(net.blobs['argmax'].data)
Is where we get the result from final layer of the network.This result’s shape is (1,1,360,480) which
is then np.squeeze-d into (360,480)
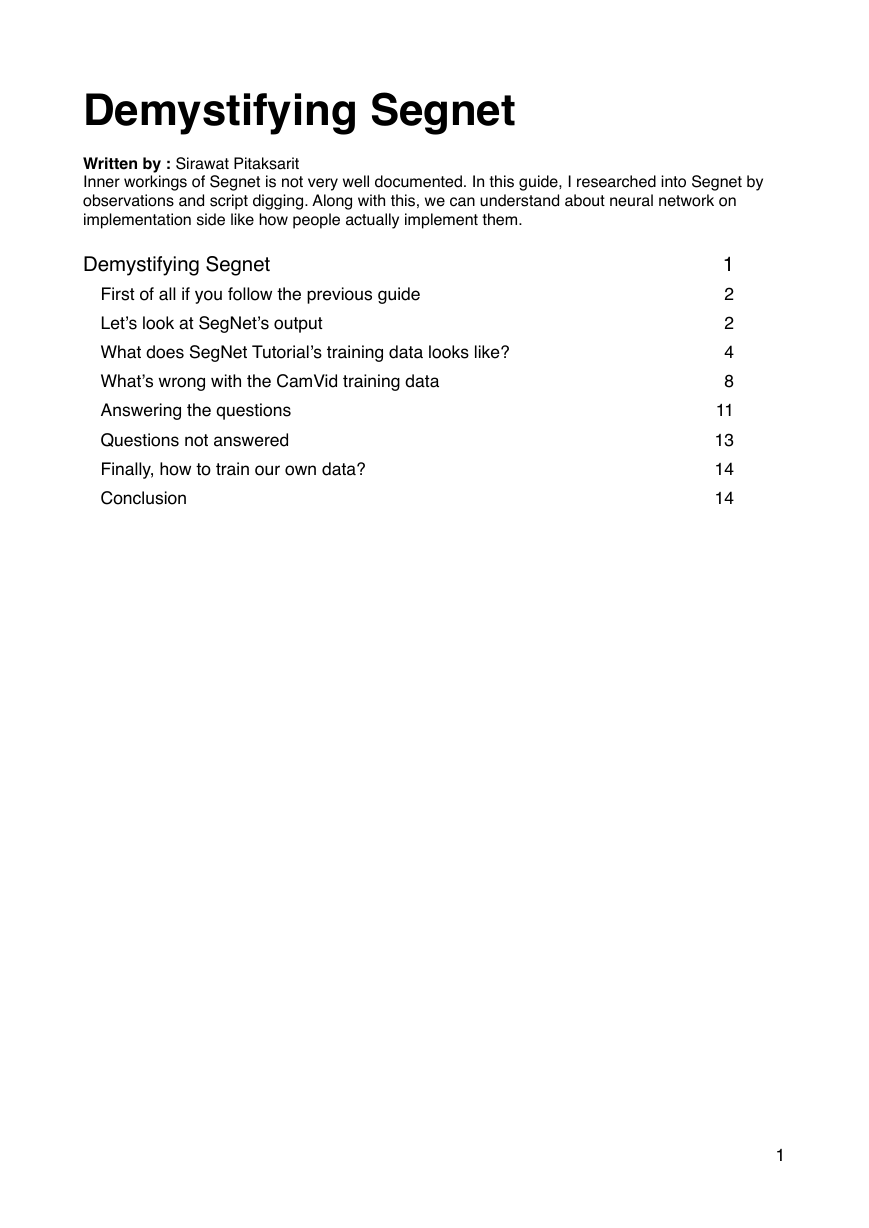
I test the network that is supposed to segment road scene with the close up webcam picture of my
face.
Trying to print it and inspect the .shape, the output looks like this :
[[ 1. 1. 1. ..., 0. 0. 0.]
[ 1. 1. 1. ..., 0. 0. 0.]
[ 1. 1. 1. ..., 0. 0. 0.]
...,
[ 1. 1. 1. ..., 5. 5. 5.]
[ 1. 1. 1. ..., 5. 5. 5.]
[ 1. 1. 1. ..., 5. 5. 5.]]
(360, 480)
�2
�
�
Each value corresponds to one pixel. The number of each values is the label. To see an example
of how many instances of each label that exist in this output, we will try numpy.unique(A, False,
False, True) to count each instant of them.
(array([ 0., 1., 2., 4., 5., 6., 7., 9., 10., 11.],
dtype=float32), array([51467, 19657, 297, 7994, 2120, 14383, 157,
70013, 6698, 14]))
In this image there are many classes ranges from label 0 to 11. (3 and 8 is absent in this image)
And the frequency of class label 0 is highest. The squeezed array then will be made into 3
channels and then used with lookup table function (np.LUT) to add colors. Now look at what
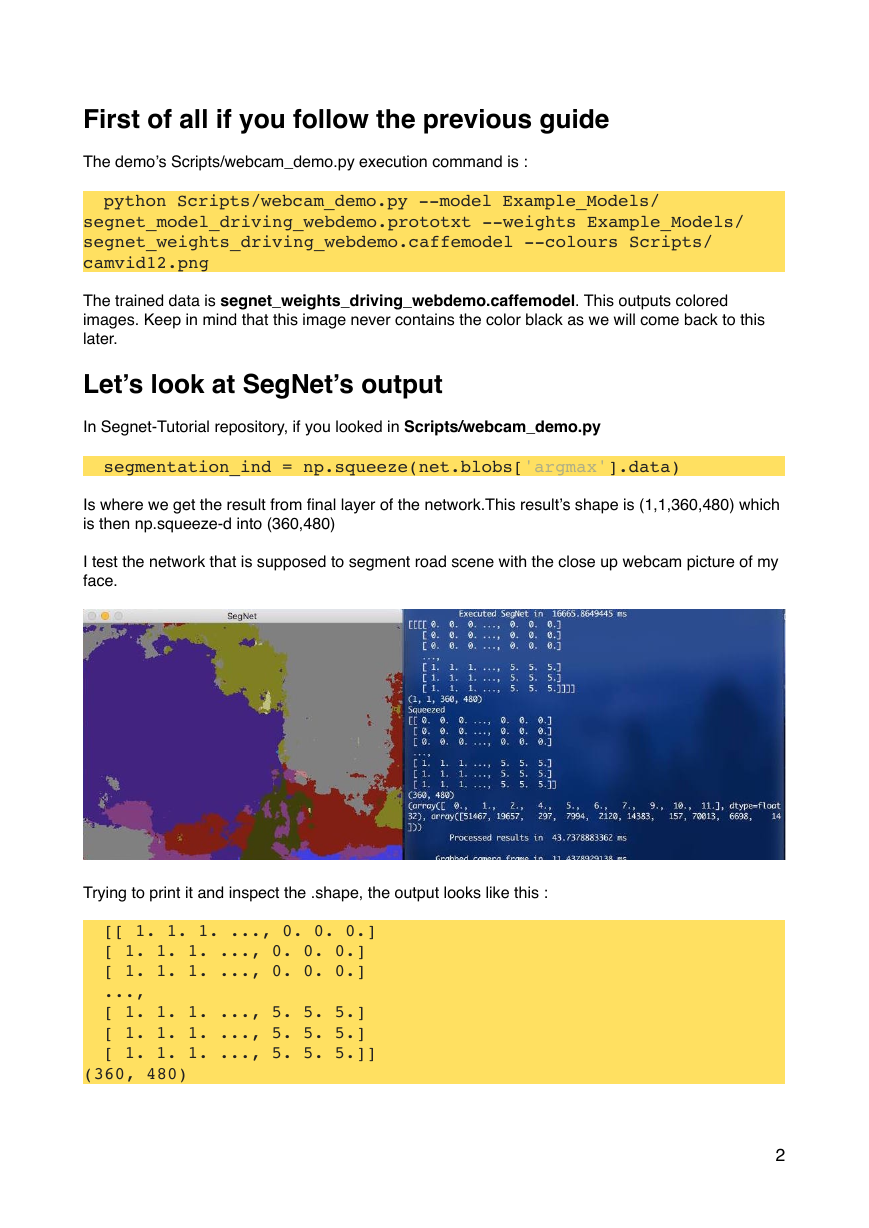
SegNet can segment.
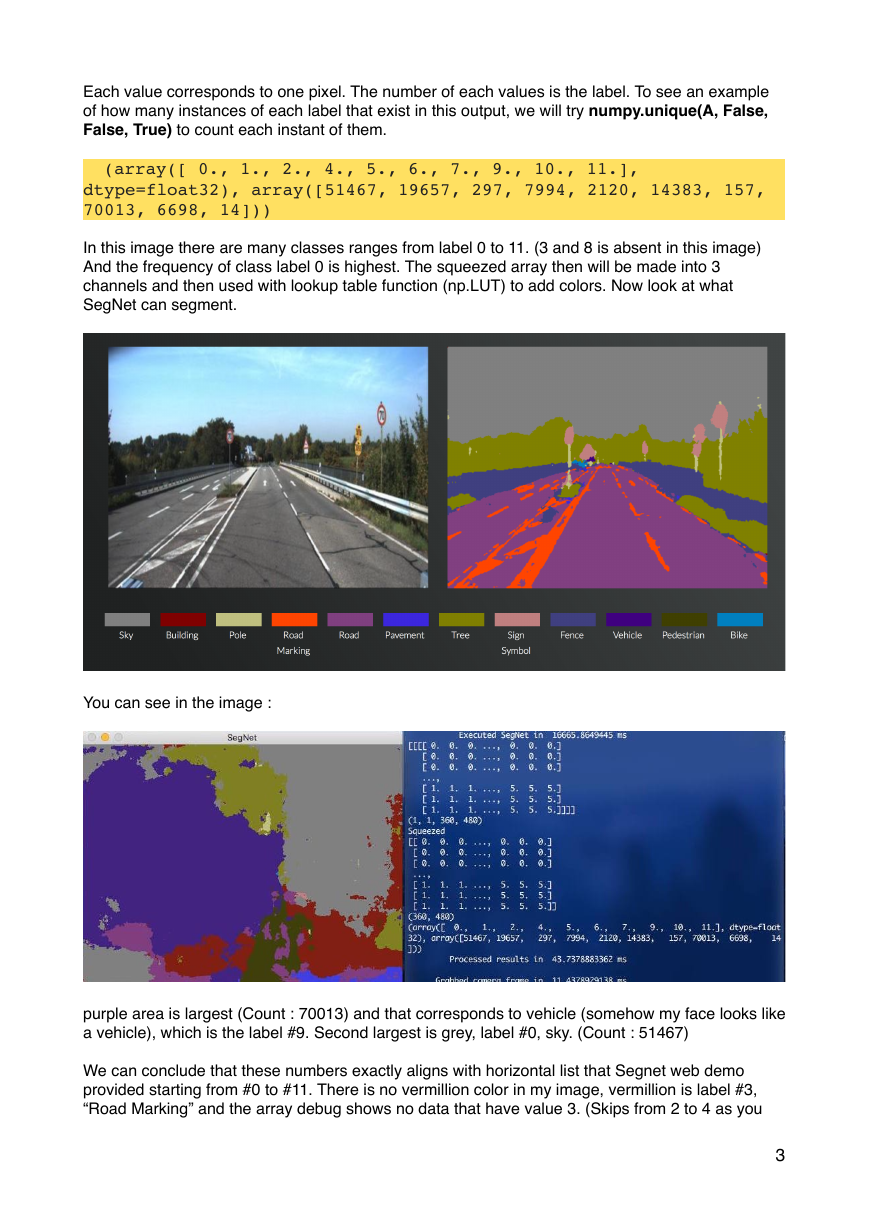
You can see in the image :
purple area is largest (Count : 70013) and that corresponds to vehicle (somehow my face looks like
a vehicle), which is the label #9. Second largest is grey, label #0, sky. (Count : 51467)
We can conclude that these numbers exactly aligns with horizontal list that Segnet web demo
provided starting from #0 to #11. There is no vermillion color in my image, vermillion is label #3,
“Road Marking” and the array debug shows no data that have value 3. (Skips from 2 to 4 as you
�3
�
�
�
can see.) This proves that segnet_weights_driving_webdemo.caffemodel is indeed the same
model as their web demo.
One interesting point to think is the output from this never contains “Unknown”. This means
segnet_weights_driving_webdemo.caffemodel has been trained with only known labels. To
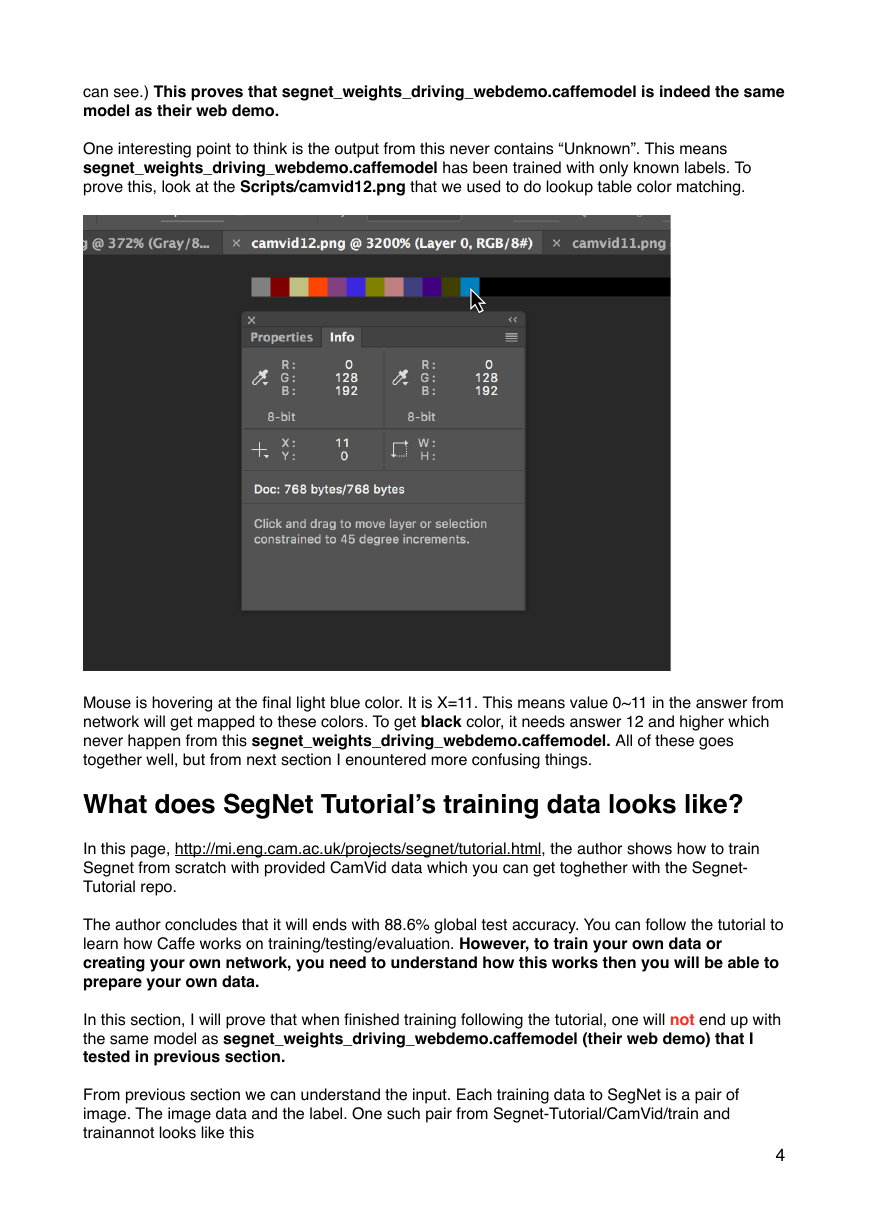
prove this, look at the Scripts/camvid12.png that we used to do lookup table color matching.
Mouse is hovering at the final light blue color. It is X=11. This means value 0~11 in the answer from
network will get mapped to these colors. To get black color, it needs answer 12 and higher which
never happen from this segnet_weights_driving_webdemo.caffemodel. All of these goes
together well, but from next section I enountered more confusing things.
What does SegNet Tutorial’s training data looks like?
In this page, http://mi.eng.cam.ac.uk/projects/segnet/tutorial.html, the author shows how to train
Segnet from scratch with provided CamVid data which you can get toghether with the Segnet-
Tutorial repo.
The author concludes that it will ends with 88.6% global test accuracy. You can follow the tutorial to
learn how Caffe works on training/testing/evaluation. However, to train your own data or
creating your own network, you need to understand how this works then you will be able to
prepare your own data.
In this section, I will prove that when finished training following the tutorial, one will not end up with
the same model as segnet_weights_driving_webdemo.caffemodel (their web demo) that I
tested in previous section.
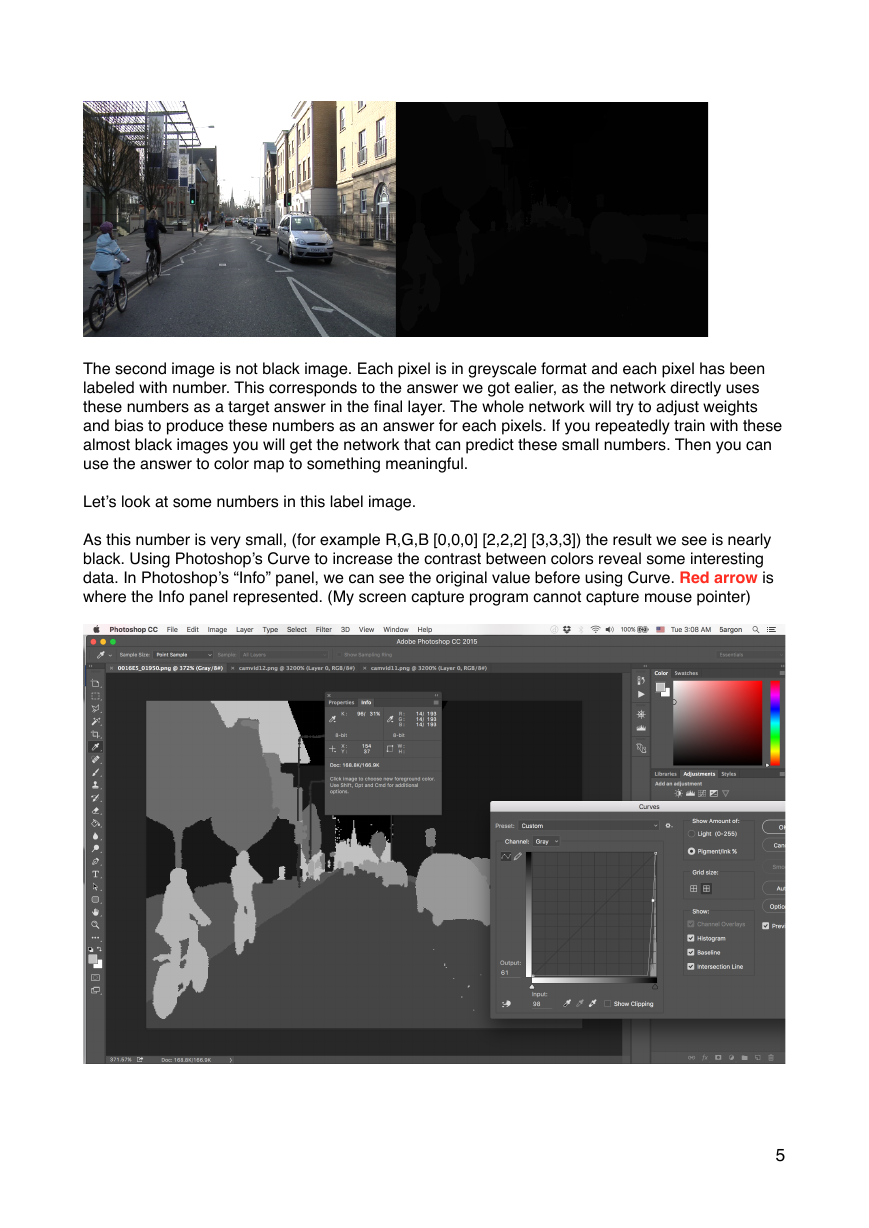
From previous section we can understand the input. Each training data to SegNet is a pair of
image. The image data and the label. One such pair from Segnet-Tutorial/CamVid/train and
trainannot looks like this
�4
�
�
The second image is not black image. Each pixel is in greyscale format and each pixel has been
labeled with number. This corresponds to the answer we got ealier, as the network directly uses
these numbers as a target answer in the final layer. The whole network will try to adjust weights
and bias to produce these numbers as an answer for each pixels. If you repeatedly train with these
almost black images you will get the network that can predict these small numbers. Then you can
use the answer to color map to something meaningful.
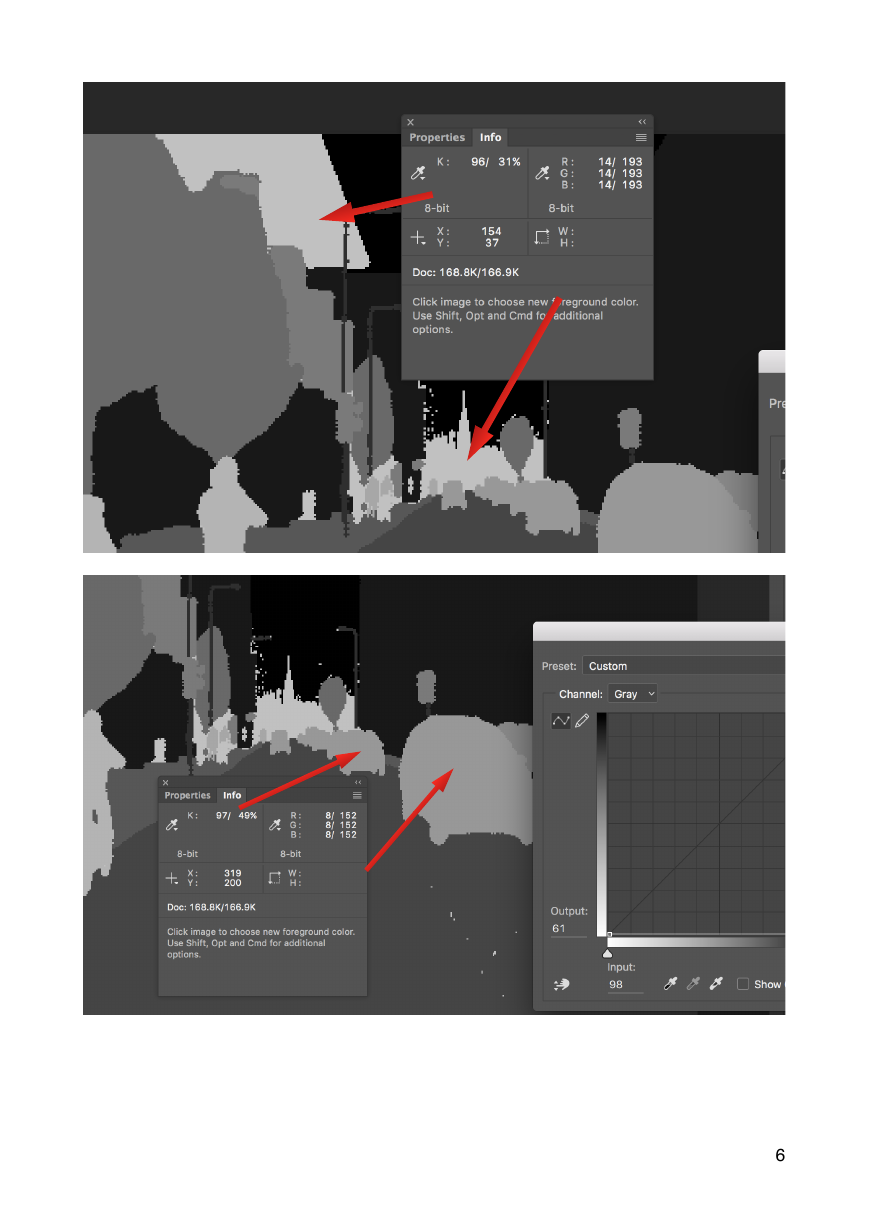
Let’s look at some numbers in this label image.
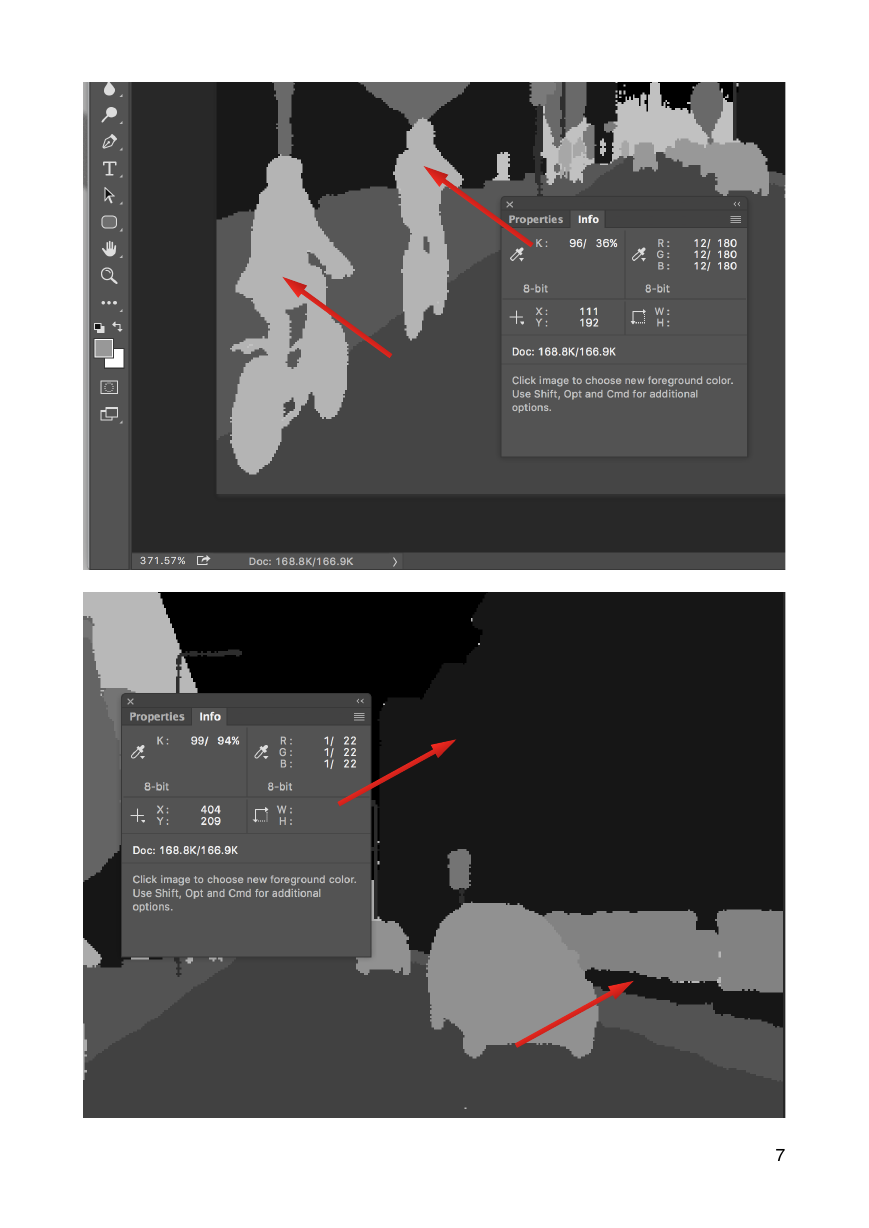
As this number is very small, (for example R,G,B [0,0,0] [2,2,2] [3,3,3]) the result we see is nearly
black. Using Photoshop’s Curve to increase the contrast between colors reveal some interesting
data. In Photoshop’s “Info” panel, we can see the original value before using Curve. Red arrow is
where the Info panel represented. (My screen capture program cannot capture mouse pointer)
�5
�
�
�
�
�6
�
�
�
�7
�
�
�
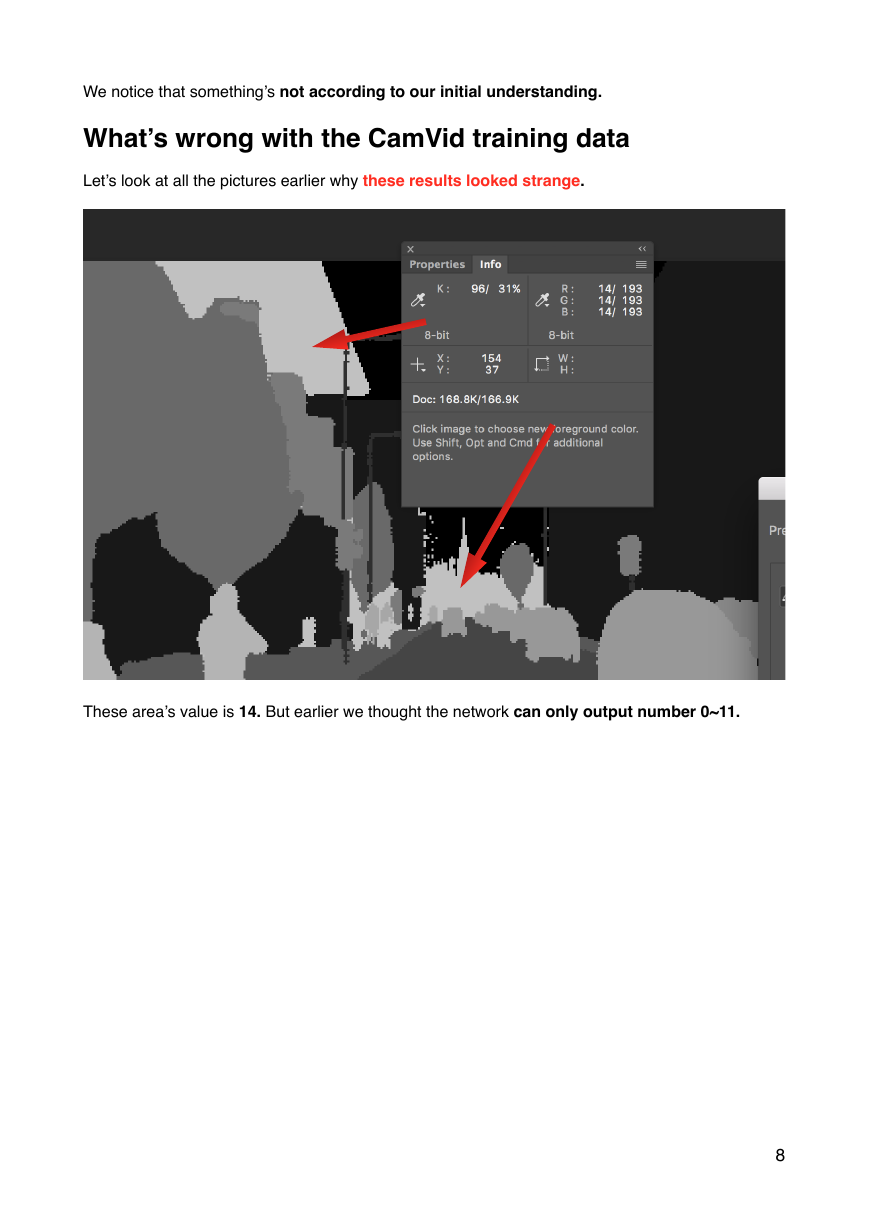
We notice that something’s not according to our initial understanding.
What’s wrong with the CamVid training data
Let’s look at all the pictures earlier why these results looked strange.
These area’s value is 14. But earlier we thought the network can only output number 0~11.
�8
�
�


 2023年江西萍乡中考道德与法治真题及答案.doc
 2012年重庆南川中考生物真题及答案.doc
 2013年江西师范大学地理学综合及文艺理论基础考研真题.doc
 2020年四川甘孜小升初语文真题及答案I卷.doc
 2020年注册岩土工程师专业基础考试真题及答案.doc
 2023-2024学年福建省厦门市九年级上学期数学月考试题及答案.doc
 2021-2022学年辽宁省沈阳市大东区九年级上学期语文期末试题及答案.doc
 2022-2023学年北京东城区初三第一学期物理期末试卷及答案.doc
 2018上半年江西教师资格初中地理学科知识与教学能力真题及答案.doc
 2012年河北国家公务员申论考试真题及答案-省级.doc
 2020-2021学年江苏省扬州市江都区邵樊片九年级上学期数学第一次质量检测试题及答案.doc
 2022下半年黑龙江教师资格证中学综合素质真题及答案.doc