�
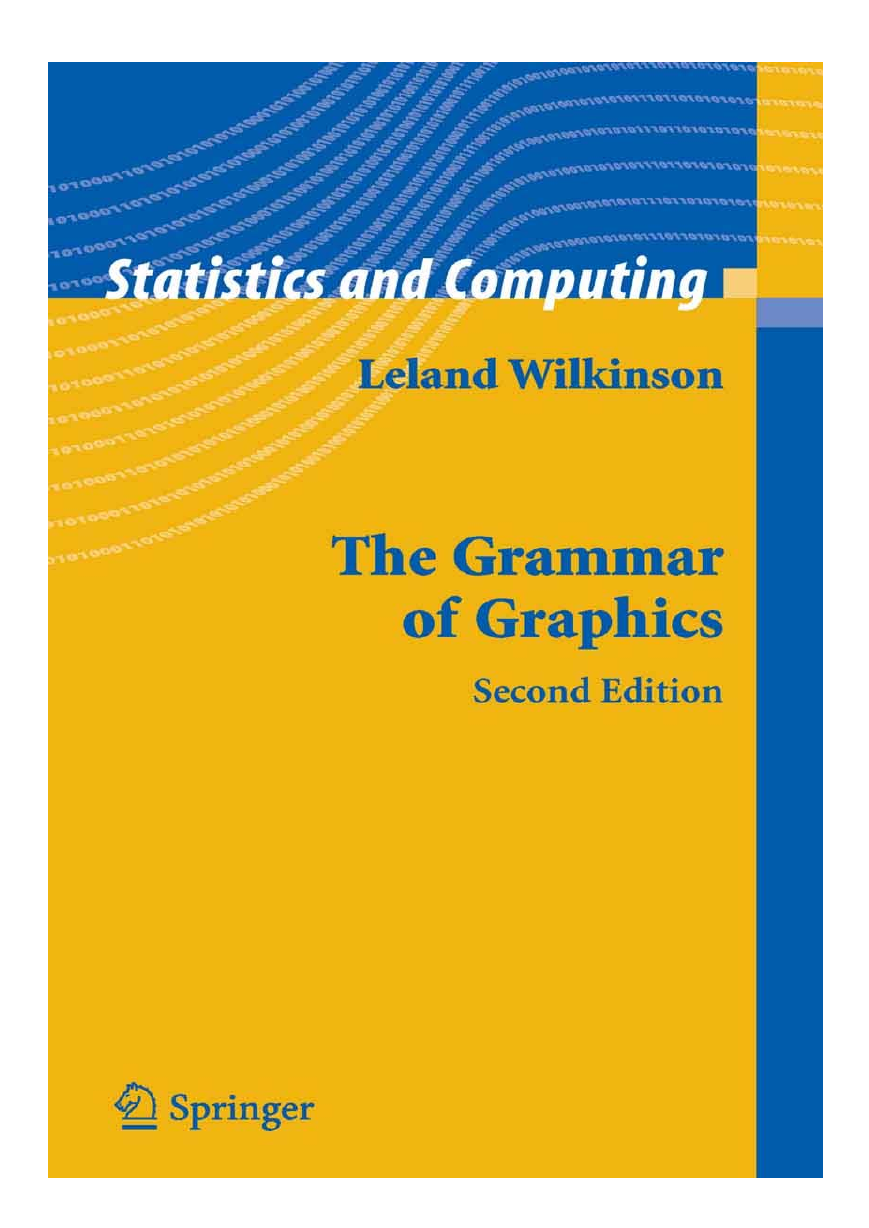
Statistics and Computing
Series Editors:
J. Chambers
D. Hand
W. Ha¨rdle
�
Leland Wilkinson
The Grammar
of Graphics
Second Edition
With 410 Illustrations, 319 in Full Color
With contributions by Graham Wills, Dan Rope,
Andrew Norton, and Roger Dubbs
�
Leland Wilkinson
SPSS Inc.
233 S. Wacker Drive
Chicago, IL 60606-6307
USA
leland@spss.com
Series Editors:
J. Chambers
Bell Labs, Lucent
Technologies
600 Mountain Ave.
Murray Hill, NJ 07974
USA
D. Hand
Department of Mathematics
South Kensington Campus
Imperial College, London
London
SW7 2AZ
United Kingdom
W. Ha¨rdle
Institut fu¨r Statistik und
O¨ konometrie
Humboldt-Universita¨t zu Berlin
Spandauer Str. 1
D-10178 Berlin, Germany
Library of Congress Control Number:
ISBN-10: 0-387-24544-8
ISBN-13: 978-0387-24544-7
Printed on acid-free paper.
© 2005 Springer Science+Business Media, Inc.
All rights reserved. This work may not be translated or copied in whole or in part without the written permission
of the publisher (Springer Science+Business Media, Inc., 233 Spring Street, New York, NY 10013, USA), except
for brief excerpts in connection with reviews or scholarly analysis. Use in connection with any form of information
storage and retrieval, electronic adaptation, computer software, or by similar or dissimilar methodology now known
or hereafter developed is forbidden.
The use in this publication of trade names, trademarks, service marks, and similar terms, even if they are not
identified as such, is not to be taken as an expression of opinion as to whether or not they are subject to proprietary
rights.
Printed in Canada.
9 8 7 6 5 4 3 2 1
springeronline.com
�
To John Hartigan and Amie Wilkinson
�
Who can hide in secret places so that I cannot see them? Do I not fill
heaven and earth?
Jeremiah 23.24
Cleave a piece of wood, I am there; lift up the stone and you will find
me there.
Gospel of Thomas 77
God hides in the smallest pieces.
Caspar Barlaeus
God hides in the details.
Aby Warburg
God is in the details.
Ludwig Mies van der Rohe
The devil is in the details.
George Shultz
Bad programmers ignore details. Bad designers get lost in details.
Nate Kirby
�
Preface
Preface to First Edition
Before writing the graphics for SYSTAT in the 1980’s, I began by teaching a
seminar in statistical graphics and collecting as many different quantitative
graphics as I could find. I was determined to produce a package that could
draw every statistical graphic I had ever seen. The structure of the program
was a collection of procedures named after the basic graph types they pro-
duced. The graphics code was roughly one and a half megabytes in size.
In the early 1990’s, I redesigned the SYSTAT graphics package using ob-
ject-based technology. I intended to produce a more comprehensive and dy-
namic package. I accomplished this by embedding graphical elements in a tree
structure. Rendering graphics was done by walking the tree and editing
worked by adding and deleting nodes. The code size fell to under a megabyte.
In the late 1990’s, I collaborated with Dan Rope at the Bureau of Labor
Statistics and Dan Carr at George Mason University to produce a graphics pro-
duction library called GPL, this time in Java. Our goal was to develop graphics
components. This book was nourished by that project. So far, the GPL code
size is under half a megabyte.
I have not yet achieved that elusive zero-byte graphics program, but I do
believe that bulk, in programming or in writing, can sometimes be an inverse
measure of clarity of thought. Users dislike “bloatware” not only because it is
a pig that wastes their computers’ resources but also because they know it usu-
ally reflects design-by-committee and sloppy thinking.
Notwithstanding my aversion to bulk, this book is longer than I had antic-
ipated. My original intent was to outline a new paradigm for quantitative
graphics using examples from publications and from SYSTAT. As the GPL
project proceeded and we were able to test concepts in a working program, I
began to realize that the details of the system were as important as the outlines.
I also found that it was easier to write about the generalities of graphics than
about the particulars. As every programmer knows, it is easier to wave one’s
hands than to put them to the keyboard. And as every programmer knows in
the middle of the night, the computer “wonderfully focuses the mind.”
The consequence is a book that is not, as some like to say, “an easy read.”
I do not apologize for this. Statistical graphics is not an easy field. With rare
exceptions, theorists have not taken graphics seriously or examined the field
deeply. And I am convinced that those who have, like Jacques Bertin, are not
often read carefully. It has taken me ten years of programming graphics to un-
derstand and appreciate the details in Bertin.
I am not referring to the abstruseness of the mathematics in scientific and
technical charts when I say this is not an easy field. It is easier to graph New-
�
x
Preface
ton’s law of gravitation than to draw a pie chart. And I do not mean that no one
has explored aspects of graphics in depth or covered the whole field with illu-
mination. I mean simply that few have viewed quantitative graphics as an area
that has peculiar rules and deep grammatical structure. As a result, we have
come to expect we can understand graphics by looking at pictures and speak-
ing in generalities. Against that expectation, I designed this book to be read
more than once. On second reading, you will discover the significance of the
details and that will help you understand the necessity of the framework.
Who should read this book? The simple answer is, of course, anyone who
is interested in business or scientific graphics. At the most elementary level are
readers who are looking for a graphical catalog or thesaurus. There are not
many types of graphics that do not appear somewhere in this book. At the next
level are those who want to follow the arguments without the mathematics.
One can skip all the mathematics and still learn what the fundamental compo-
nents of quantitative graphics are and how they interact. At the next level are
those who have completed enough college mathematics to follow the notation.
I have tried to build the argument, except for the statistical methods in Chapter
7, from elementary definitions. I chose a level comparable to an introductory
computer science or discrete math text, and a notation that documents the al-
gorithms in set terminology computer science students will recognize.
I intend to reach several groups. First are college and graduate students in
computer science and statistics. This is the only book in print that lays out in
detail how to write computer programs for business or scientific graphics. For
all the attention computer graphics courses devote to theory, modeling, anima-
tion, and realism, the vast majority of commercial applications involve quan-
titative graphics. As a software developer, I believe the largest business market
for graphics will continue to be analysis and reporting, despite the enthusiastic
predictions (driven by conventional wisdom) for data mining, visualization,
animation, and virtual reality. The reason, I think, is simple. People in business
and science have more trouble communicating than discovering.
The second target group for this book comprises mathematicians, statisti-
cians, and computer scientists who are not experts in quantitative graphics. I
hope to be able to convey to them the richness of this field and to encourage
them to explore it beyond what I have been able to do. Among his many ac-
complishments in the fields of graphics and statistics, William Cleveland is
largely responsible for stimulating psychologists (including me) to take a clos-
er look at graphical perception and cognition. I hope this book will stimulate
experts in other fields to examine the language of graphics.
The third target group consists of statistics and computer science special-
ists in graphics. These are the colleagues most likely to recognize that this
book is more the assembly of a large puzzle than the weaving of a whole cloth.
I cannot assume every expert will understand this book, however, for reasons
similar to why expertise in procedural programming can hinder one from
learning object-oriented design. Those who skim through or jump into the
middle of this book are most likely to misunderstand. There are many terms in
�


 2023年江西萍乡中考道德与法治真题及答案.doc
 2012年重庆南川中考生物真题及答案.doc
 2013年江西师范大学地理学综合及文艺理论基础考研真题.doc
 2020年四川甘孜小升初语文真题及答案I卷.doc
 2020年注册岩土工程师专业基础考试真题及答案.doc
 2023-2024学年福建省厦门市九年级上学期数学月考试题及答案.doc
 2021-2022学年辽宁省沈阳市大东区九年级上学期语文期末试题及答案.doc
 2022-2023学年北京东城区初三第一学期物理期末试卷及答案.doc
 2018上半年江西教师资格初中地理学科知识与教学能力真题及答案.doc
 2012年河北国家公务员申论考试真题及答案-省级.doc
 2020-2021学年江苏省扬州市江都区邵樊片九年级上学期数学第一次质量检测试题及答案.doc
 2022下半年黑龙江教师资格证中学综合素质真题及答案.doc