Voronoi Diagrams — A Survey of a Fundamental Geometric
Data Structure
FRANZ
AURENHAMMER
Institute
fur
Informationsverarbeitung
Technische
Universitat
Graz, Sch iet!stattgasse
4a, Austria
the Voronoi
paper
This
structures
of
and surveys
unified
provides
structures.
exposition
the first
Categories
Complexity]:
computations;
algorithms;
Modeling—geometric
presents
in computational
a survey
of
geometry.
the Voronoi
diagram,
diagram
the history
in a wide
of
variety
its development.
of
its mathematical
It demonstrates
inside
of
fields
The paper
and algorithmic
one of
the most
the importance
and outside
puts particular
fundamental
data
computer
and usefulness
science
on the
emphasis
properties.
diagrams
Finally,
and related
the paper
comprehensive
bibliography
on Voronoi
and Subject
Descriptors:
F.2.2
Nonnumerical
G. 2.1 [Discrete
Algorithms
Mathematics]:
[Analysis
and Problems–geometrical
of Algorithms
Problem
and
problems
and
Combinatorics—
combinatorial
I. 3.5 [Computer
Graphics]:
Computational
Geometry
and Object
algorithms,
languages,
and systems
General
Terms:
Algorithms,
Theory
Additional
convex
model,
planning,
insertion,
Key Words
and Phrases:
Cell
complex,
clustering,
combinatorial
hull,
higher
crystal
structure,
divide-and-conquer,
embedding,
hyperplane
geometric
arrangement,
data
structure,
k-set, motion
complexity,
growth
neighbor
spanning
searching,
tree,
triangulation
object modeling,
plane-sweep,
proximity,
randomized
INTRODUCTION
[19841 and to the textbooks
and Shames[1985]
and Edelsbrunner
by Preparata
will
[1987bl.)
practically
oriented,
problems.
geometry
is
the
design
and analysis
Readers familiar
graphics,
pattern
geometry
in the last
for geometrical
other more
with the literature
have
Computational
with
rithms
ition,
areas of computer
puter
robotics,
tions research—give
inherently
reason
tracted enormous
research interest
past decade and is a well-established
today.
the survey
concerned
of algo-
In add-
computational
ticed, especially
science— such as com-
increasing
design,
struct
and opera-
that
is one
has at-
diagram under
that address the Voronoi
in the
names specific to the respective
different
area
area. Given some number of points in the
to
plane,
the
plane
of
no-
few years, an
con-
diagram.
This
trend can also be observed in combinato-
rial geometry
num-
ber of articles
and in a considerable
in natural
in a geometrical
Voronoi
computer-aided
recognition,
their Voronoi
according
by Lee and Preparata
sources, we refer
diagram divides
are geometrical.
rise to problems
sciencejournals
(For standard
nearest-neighbor
computational
called the
geometry
interest
to the
article
This
to copy without
fee all or part
Permission
or distributed
and its date
or
Machinery.
@ 1991 ACM 0360-0300/91/0900-0345
appear,
To copy otherwise,
for directcommercialadvantage,
that
and notice
to republish,
$01.50
is given
this material
of
the ACM copyright
is granted
notice
copying
is by permission
of
provided
that
and the title
the Association
the copies are not made
of
the publication
for Computing
requires
a fee and/or
specific
permission.
ACM Computing
Surveys, Vol. 23, No. 3, September
1991
�
346
l
Franz A urenhammer
CONTENTS
INTRODUCTION
1. HISTORICAL
PERSPECTIVE
11 The Natural
1,2 The Mathematician’s
13 The Computer
Scientist’s
Viewpoint
Viewpoint
Scientist’s
Viewpoint
2. ALGORITHMIC
2 1 Closest-Site
2,2 Placement
23 Triangulating
2,4 Connectivity
2,5 Clustering
APPLICATIONS
Problems
and Motion Planning
Sites
Graphs
Point Sites
for Sites
3, SELECTED
TOPICS
3.1 The Geometry
of Voronol Diagrams,
Them
Relatlon
to Higher Dimensional
ObJects.
3.2 The Topology
of Planar Diagrams:
Divide-and-Conquer
and its Variants.
ConstructIon
33 A Deformation
of the Voronoi Diagram:
The Plane-Sweep
Technique
REFERENCES
rule:
the
(Figure
Why
point
o~ the
Each
region
1).
do Voronoi
is
plane
associated
closest
with
to it;
diagrams
so
about
con-
It seems three main reasons are
is special
and visualized
defined
receive
situations.
processes
perception.
diagrams
classes
intuition
In-
can be
of
is
If one
the whole
at a higher
have in-
to
First,
easily
define
natural
Voronoi
diagrams.
in various
attention? What
particular
Human
much
this
struct?
responsible.
arise in nature
deed, several
used
Voronoi
often guided by visual
sees an underlying
structure,
situation may be understood
level. Second, Voronoi
teresting
properties;
to many well-known
tures.
led
believe
of
fined by a discrete
diagrams
Voronoi
powerful
tool
related
computational
therefore
the
in
reasonably
has
the Voronoi
fundamental
Thifi
that
the most
increasingly
computer
surprising
instance,
simple techniques
attention
last
few years.
in solving
and
for
have
the
of
diagrams
mathematical
geometrical
several
they are related
struc-
to
diagram is one
de-
constructs
authors
set of points. Finally,
have proved
seemingly
problems
to be a
un-
and
attracted
scientists
Efficient
and
have been
ACM Computmg
Surveys, Vol. 23, No. 3, September
1991
developed
and representation
for
The intention
of
the computer
of Voronoi
this
survey
construction
diagrams.
is three-
that
in the
in mathemat
-
by the fact
have been (reinvented
of
their
natural
science,
historical
independently
sciences,
diagrams
fairly
fold: First, motivated
Voronoi
and studied
applied
its, and in computer
sketches
in these three areas. Second,
the literature
related
phasis on the unified
mathematical
ties and their
science.
comprehensive
diagrams.
exposition
and computational
applications
on Voronoi
with
bibliography
structures,
provides
Finally,
it
diagrams
particular
it presents
development
it surveys
and
em-
of
their
proper-
in computer
first
on Voronoi
the
Basic Properties
of
the Voronoi
Diagram
though
properties
important,
a description
diagram that will
We begin with
tary,
Voronoi
feeling
duce notation
per. See also Preparata
[1985] or Edelsbrunner
on this material.
of elemen-
of the
some
structure. We also intro-
pa-
used throughout
and Shames
for sources
suggest
[1987]
this
this
for
Let S denote a
diagram.
(called sites)
We first give a usual generic definition
of
the Voronoi
in the plane.
set of n points
the domi-
For
nance of p over q is defined as the sub-
set of the plane being at
least as close to
p as to q. Formally,
sites p, q e S,
two distinct
dom(p,
q) = {x~l?zl~(x,p)
Voronoi Diagrams
l
347
least
Although
be observed
should
the center of a circle that passes through
three sites but encloses no site.
at
each vertex
that
is
n sites give rise to
only
linearly
contribute
separators,
graph with
vertex
can be seen by viewing
();=
many
an edge to V(S).
a Voronoi
0( n2)
separators
This
diagram as a planar
gions
and minimum
Each of the e edges has two vertices,
each of the u vertices
belongs to at
three edges. Hence, 2 e >3 U. Euler’s
lation
– 6 and u s 2 n – 4, Thus,
the average number
does not achieve six;
3 n edges, and each of
exactly
n re-
3.
and
least
re-
e < 3n
for example,
of edges of a region
there are less than
to
n + v – e ? 2 now implies
two of the n regions.
them belongs
degree
of
this
reasons
frequent
behavior
structure
speaking,
comprises
is one of
The linear
the size of
of sites. This
than the underlying
for
diagrams.
the
use of
is
about S in an explicit
the
A second reason
the entire proximity
the
Voronoi diagram in the plane means that,
roughly
is not
much more complex
configuration
main
Voronoi
that V(S)
information
computationally
ample,
is based
post-office
x
on the trivial
of a site p if and
falls
to x among all sites in
only if p is closest
S. Moreover,
q,
then reg( p) and reg( q) share a common
the
edge. This particularly
closest pair
of sites
rise to
some edge of V(S).
problem (see below)
if site p is closest
and
For ex-
to the important
into the region
useful manner.
its applicability
that a point
in S gives
observation
implies
to site
that
Applications
in Computer
Science
substantiate
To
Voronoi
briefly
structure
diversity
impart
of
the
usefulness
diagram in computer
the
science, we
describe four situations where this
is used. The practicality y and
of
will
applications
these
the appeal of Voronoi
diagrams.
Associative
File Searching
Consider
records referring,
and longitude
some file
of
n two-attribute
for example,
or
of a city
to latitude
to age and
ACM Computmg
Surveys, Vol. 23, No 3, September
1991
Figure 1.
plane.
Voronoi
diagram
for eight
sites
in the
of
they
least
diagram,
planes,
consists
is to say,
the plane.
n – 1 half
of the finite
form a
This
Since the regions
point-set S (Figure
Note that a region,
is called the Voronoi
of at most
open straight-line
(their endpoints).
are coming from in-
are
of a
n – 1 edges
segments)
Each point
from exactly
is equidistant
three. As a consequence,
are edge to edge and vertex
that
partition
they
tersecting
convex polygons. Thus the boundary
region
(maximal
and vertices
on an edge is equidistant
two sites, and each vertex
from at
the regions
to vertex,
polygonal
partition
V(S),
1).
say reg( p), cannot
of
least as close to p as to any
p e reg( p).
exactly
n
be empty
the plane at
other sites in S. In particular,
It
them are necessarily
regions.
They are defined by sites ly.
unbounded.
of the convex hull of
ing on the boundary
those sites there exist
S because just
for
far away but still
clos-
points arbitrarily
if and only if all
occur
est.1 No vertices
line.
sites in S lie on a single
Such degenerate
also im-
ply the existence of regions with only one
or
(unbounded)
three
more edges meet at a common vertex.
It
since it contains
edge. Otherwise,
configurations
that V(S)
all points
Some of
contains
straight
follows
lThe
gon that
conuex hull
contains
of S is the smallest
S.
convex
polY-
�
348
l
Franz Aurenhammer
file
report
first
[1973]
of
all
n
need
record
that
searching
associative
It possibly
R the best.
record
If
file-searching
generalization
computational
(one-attribute)
data structure
is best known
version under
q (the location
occurs frequently
posed by Knuth
algorithms
that
target
to retrieve
there exists a trivial
by computing
income of a person. Suppose we are given
R and we
an additional
of
quickly
want
re-
the file that matches
on the same file,
trieval
a supporting
is called for.
problem
This
as a
was first
the
two-dimensional
prob-
usual
in its geo-
lem.
metric
the name post-office
problem: Given a set S of n sites in the
a site closest
plane (post offices),
of a
to a given query point
person). Note that
solution
0( n)-time
There are various
distances.
in
geometry
the post office problem as a subroutine
[Preparata
Shames
relevance
problem.
only if q falls
preprocessing
of S is computed.
to q,
region that
problem,
point-location
developed
have
been
et al.
[19831, Edahiro
et al.
brunner
[1986].
in a Voronoi
location
regions
0(n)
the post-office
means of Voronoi
mic query
the order of space, which
to be optimal
searching.
[1984], and Edels-
point
In particular,
n
in O(log n) time and
shows that
problem can be solved by
diagram
To report a site closest
the
this so-called
solutions
and Shames 1985].
[1975a]
of Voronoi
the
to this
to q if and
In a
in logarith-
increasing
known
file
into the region of p.
step the Voronoi
diagrams
and without
A site p is closest
storage overhead.
it now suffices
is well
for
by Kirkpatrick
diagram with
to determine
is supported
observed
diagrams
contains
efficient
already
q. For
time
This
usual
Cluster
Analysis
[Hartigan
clustering
frequently
clusters means
of
The problem of automatically
19751.
data arises
a
Finding
partition
set of data into
subsets whose in-class members are simi-
are
lar and whose cross-class members
dissimilar
simi-
two-
larity
according to a predefined
determining
the given
measure.
case of
the
In
ACM Computing
Surveys, Vol
23, No
3, September
1991
Fig ure 2.
Voronoi
diagram
for
two dense clusters.
have
Figure
regions
direction
instance,
of small
is reflected
data, similarity
similar
having
in turn,
the Voronoi
is revealed
diagram for
by
of sites in the plane. Prox-
by properties
these sites.
dense subsets of sites give
area;
cluster
for
attribute
the proximity
imity,
of
For
rise to Voronoi
regions of sites in a homogeneous
will
clusters
the regions will
density,
sensi-
exhibit
tivity.
2 gives an example. Ahuja
[19821 showed how to use these proper-
ties for clustering
shape;
geometric
orientation-sensitive
the shapes of
a corresponding
sites.
and matching
support
various
used in practice.
diagrams
techniques
required
at
process
the retrieval
any
is
of
of specified
easily by examining
Voronoi
clustering
What
is
often
little
the
the nearest-
more than
They
sites.
neighbor
sites
can be reported
the
edges of the regions of the specified sites.
This
methods
methods
ods involving
et al. 1989].
[Asano et al. 1988], and meth-
selection [Aggarwal
hierarchical
partitional
to
[Murtagh
clustering
several
applies
cluster
1983],
stage
of
Scheduling
Record
Accesses
Consider
a mass storage
system repre-
sented by a two-dimensional
array of grid
points, each capable of storing one record.
head to move
The time for the read/write
(u, U) is
from point
the
proportional
I x – u I + I y – u 1,
these points measured
distance
to the point
between
(x, y)
to
�
Voronoi Diagrams
l
349
. . . ...jgcJytj?JrJ”
.-
Figure 4.
Power
diagram
for seven circles
stop the system before
have occurred.
a collision
will
The robot system and the environment
are
and
Sharir
out
that
usually
between
modeled
threshold
stemming
“harmless”
objects. For
the intersection
others.
there will
by circles whose radii
by
of obstacles
the sake of prox-
polygonal
collision-critical
points
imity
detection,
of these objects may be
on the boundary
cor-
circumscribed
respond to the tolerance
of the
system. This reduces the problem to de-
of circles. Colors
tecting
to
may be assigned to the circles in order
inter-
distinguish
(among
sections
from
circles
robot part or the same
the same moving
obstacle)
[1985]
be no inter-
pointed
colors
section between circles of different
if all
formed
by the circles
Finding
col-
connected
ors seem to involve
of each
pair of circles. The problem becomes easy,
(the
however,
lines
Voronoi
is
of the circles are taken
[1988a]
available;
where
in
O(n log n) time for n colored circles. The
can be exploited
crucial
two
is that
circles
line
(Figure
diagram
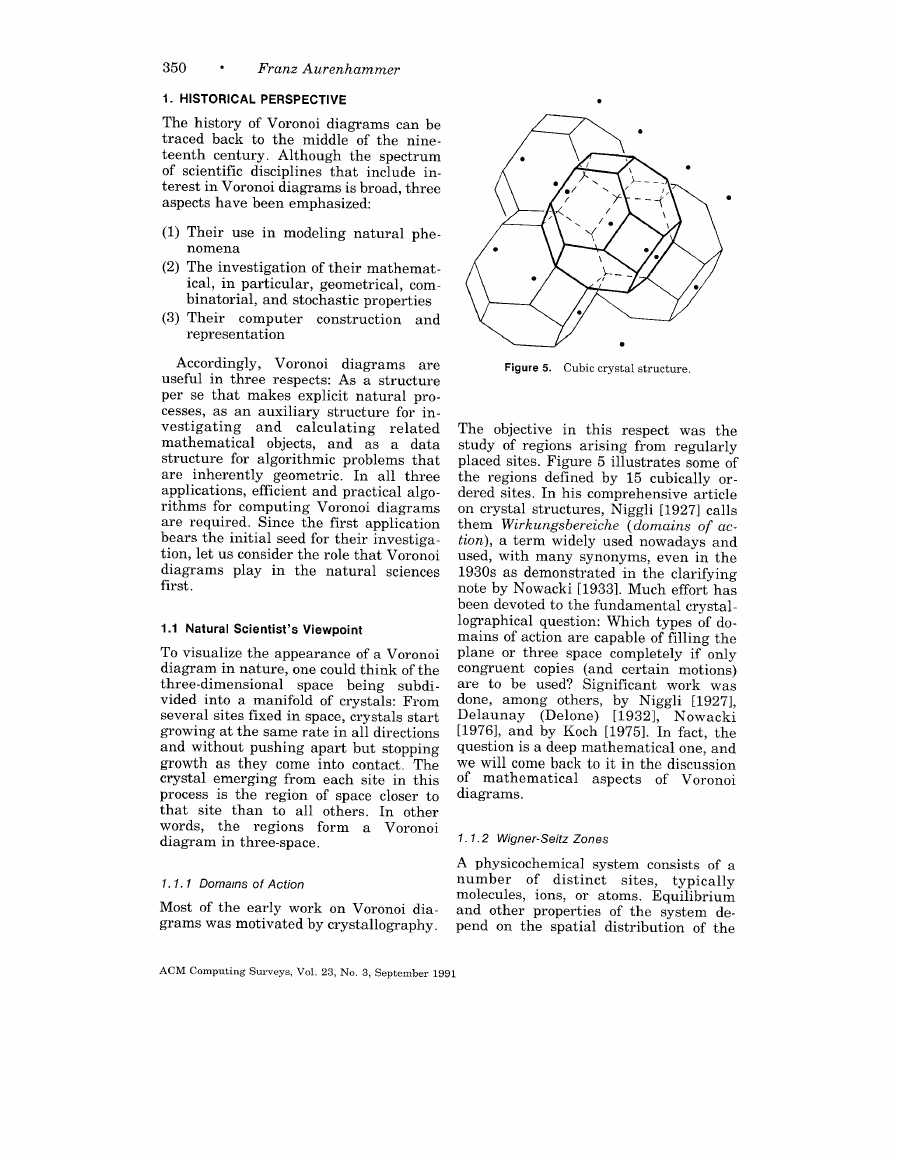
diagram where the power
property
the points
lie on their
4).
see Aurenhammer
are uncolored.
the connected
as separators)
and checking
an inspection
components
components
intersection
common
problem
that
of
solved
if
the
power
power
this
is
of
ACM Computing
Surveys, Vol. 23, No. 3, September
1991
Figure
ning
3.
trees
Voronoi
in the
diagram
and minimum
span-
LI-metric,
L1-metric
(i. e., Manhattan
arises
in the
tance). One problem that
cessing batched requests
How is the head movement
uled in order
records in minimum time (distance)?
to retrieve
to be sched-
the requested
is the following:
dis-
in ac-
grid
step,
points
quickly
Finding
an exact
approximate
In an initial
n requested
is computed
the
under
in 0( n log n)
diagrams.
diagram induced
solution was shown
by Lee and Wong
to be NP-complete
solu-
[19801. A satisfactory
by means of
tion can be obtained
the
Voronoi
the Ll-
Voronoi
time by
metric
as
taking
sites. Now the minimum-Ll-length
tree
spanned by the sites can be constructed
the tree can only
quickly:
are neigh-
connect
bored in the Voronoi
diagram [Hwang
3 il-
1979; Lee and Wong 1980]. Figure
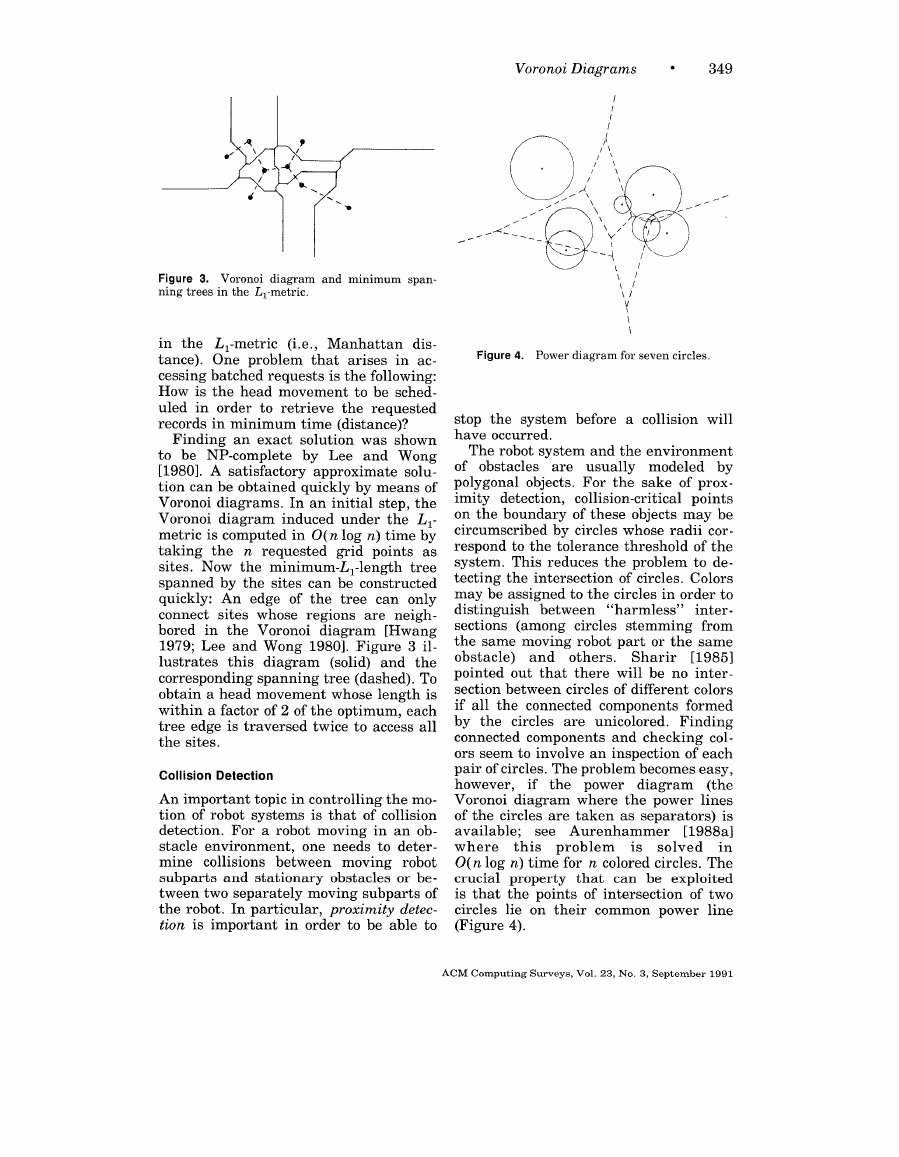
(solid)
lustrates
and the
corresponding
tree (dashed). To
obtain a head movement whose length is
within
each
tree edge is traversed
twice to access all
the sites.
An edge of
sites whose regions
a factor of 2 of the optimum,
diagram
spanning
this
Collision
Detection
For a robot moving
topic in controlling
systems
the mo-
is that of collision
An important
tion of robot
detection.
stacle environment,
mine
subparts
tween two separately moving
the robot.
tion
in an ob-
one needs to deter-
robot
obstacles or be-
of
detec-
to be able to
between moving
and stationary
In particular,
is important
collisions
in order
subparts
proximity
�
350
“
Franz Aurenhammer
1. HISTORICAL
PERSPECTIVE
l
diagrams
of’ Voronoi
to the middle
The history
back
traced
teenth
century.
of scientific
terest
aspects have been emphasized:
in Voronoi
disciplines
diagrams
Although
that
of
can be
the nine-
the spectrum
in-
three
include
is broad,
(1) Their
use in modeling
natural
phe-
nomena
(2) The investigation
ical,
binatorial,
in particular,
geometrical,
of their mathemat
-
com-
and stochastic
properties
(3) Their
computer
construction
and
representation
Accordingly,
Voronoi
diagrams
are
Figure 5. Cubic
crystal
structure.
and
pro-
in-
natural
objects,
structure
for algorithmic
calculating
and
in three respects: As a structure
useful
per se that makes explicit
cesses, as an auxiliary
vestigating
mathematical
structure
are inherently
applications,
rithms
are required.
bears the initial
tion,
diagrams
first.
efficient
for computing
problems
In all
and practical
Voronoi
for
related
as a data
that
three
algo-
diagrams
application
investiga-
the role that Voronoi
sciences
in the natural
Since the first
let us consider
geometric.
seed for
their
play
1.1 Natural
Scientist’s
Viewpoint
being
of crystals:
the appearance
one could think
space
To visualize
diagram in nature,
three-dimensional
vided into a manifold
several
growing
and without
growth
crystal
process
that
words,
diagram in three-space.
of a Voronoi
of the
subdi-
From
sites fixed in space, crystals
start
at the same rate in all directions
apart but stopping
The
from each site in this
to
In other
a Voronoi
of space closer
others.
form
as they
emerging
is the region
come into contact.
site than
pushing
regions
to all
the
1. 1.1 Don-rams of Action
Most of
grams was motivated
the early work
on Voronoi
dia-
by crystallography.
ACM Computing
Surveys, Vol. 23, No. 3, September
1991
of
the
some of
or-
respect was
from regularly
in the clarifying
article
[1927] calls
of ac-
and
even in the
Niggli
arising
regions
in this
(domains
objective
synonyms,
used nowadays
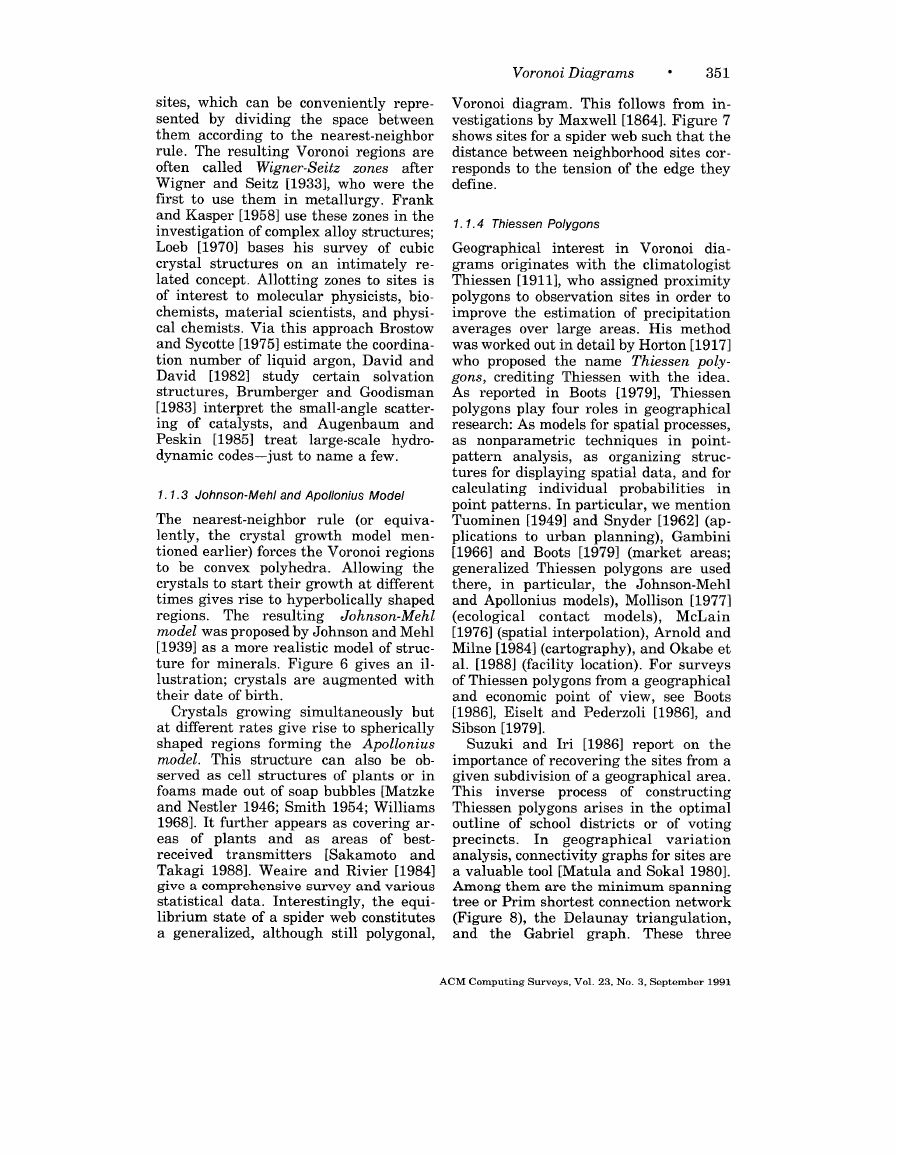
5 illustrates
by 15 cubically
The
study
placed sites. Figure
defined
the regions
dered sites.
In his comprehensive
on crystal
structures,
them Wirkungsbereiche
a term widely
tion),
used, with many
1930s as demonstrated
note by Nowacki
been devoted to the fundamental
lographical
mains of action are capable of filling
plane or
congruent
are to be used? Significant
by Niggli
done, among
Delaunay
[1932],
[19761, and by Koch [19751.
question
we will
of mathematical
diagrams.
is a deep mathematical
come back to it
space completely
question: Which
(Delone)
aspects
others,
copies
three
types of do-
the
if only
(and certain motions)
work was
[1927],
In fact,
the
one, and
in the discussion
of Voronoi
[1933]. Much effort has
crystal-
Nowacki
1. 1.2 Wigner-Seitz
Zones
of
system consists
A physiochemical
typically
number
ions, or atoms. Equilibrium
molecules,
and other
properties
pend on the spatial
of
distribution
the system de-
the
distinct
sites,
of a
of
�
use
can
these
zones
the
which
survey
structures
be conveniently
regions
zones
[1933], who were
called Wigner-Seitz
repre-
space between
the nearest-neighbor
Voronoi
them in metallurgy.
[1958]
are
after
the
Frank
the
in
of complex alloy structures;
bases his
sites,
by dividing
sented
them according
to
rule. The resulting
often
Wigner
and Seitz
first
to
use
and Kasper
investigation
of cubic
Loeb [1970]
crystal
re -
on
lated concept, Allotting
is
bio-
of
chemists, material
and physi-
cal chemists. Via this approach Brostow
and Sycotte [1975] estimate
the coordina-
and
tion
David
structures,
[19831 interpret
ing
Peskin
dynamic
solvation
and Goodisman
scatter-
and
hydro-
argon, David
certain
[1985]
treat
codes—just
zones
physicists,
and Augenbaum
the small-angle
to name a few.
to molecular
of catalysts,
liquid
study
Brumberger
large-scale
scientists,
intimately
number
interest
[1982]
to sites
of
an
1.1.3
Johnson-Mehl
and Apollonius
Model
(or
rule
to start
Allowing
the crystal
nearest-neighbor
forces the Voronoi
polyhedra.
equiva-
growth model men-
regions
the
The
lently,
tioned earlier)
to be convex
crystals
times gives rise to hyperbolically
regions.
model was proposed by Johnson and Mehl
[1939] as a more
ture
lustration;
for minerals.
crystals
model
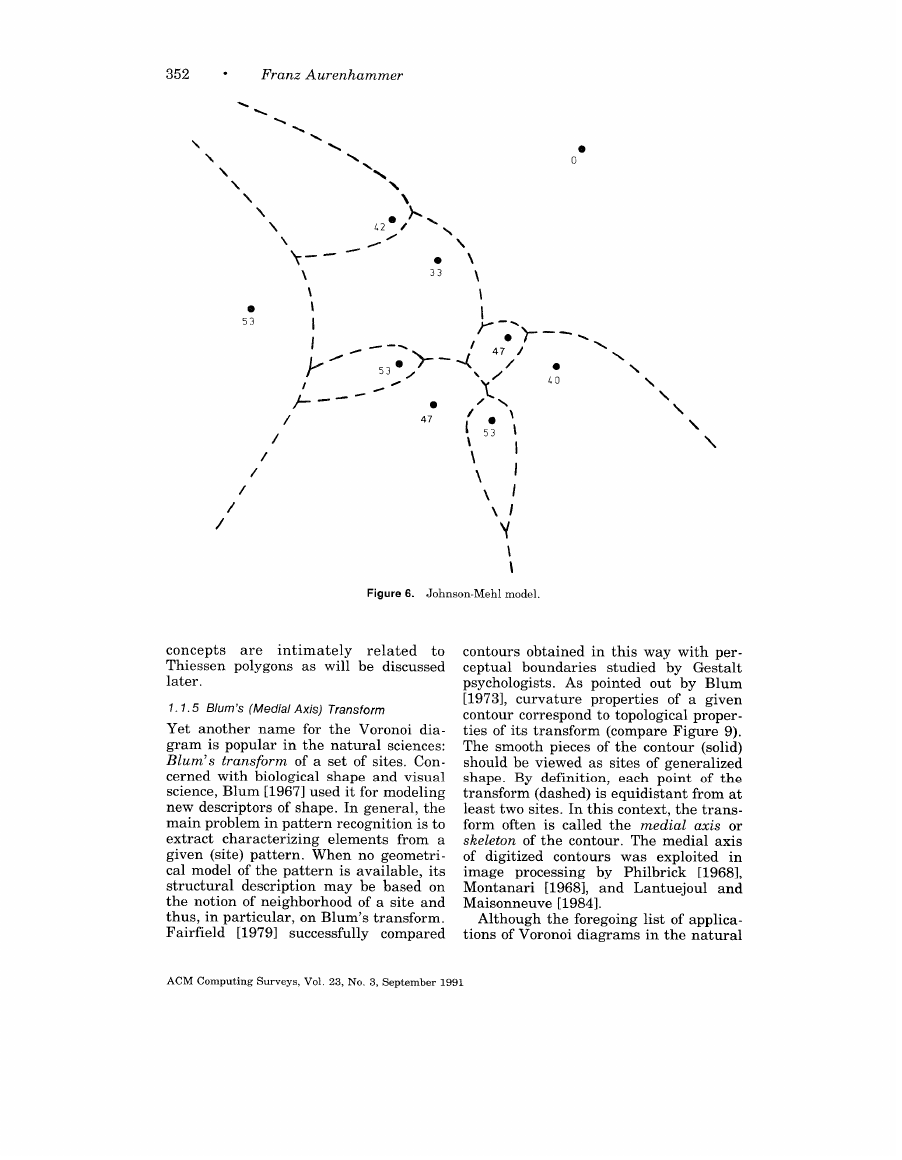
6 gives an
their growth
Figure
are
Johnson-Mehl
at different
resulting
shaped
augmented
realistic
The
struc-
with
il-
of
their
date
of birth.
crystals
growing
simultaneously
but
Voronoi
Diagrams
l
351
Voronoi
vestigations
shows
sites
diagram.
This
by Maxwell
a spider
for
follows
[1864].
web
such
from in-
Figure
that
the
7
distance
responds
define.
between
to
the
neighborhood
of
tension
the
sites
edge
cor-
they
1. 1.4 Thiessen
Polygons
Geographical
grams
originates
interest
with
in
the
Voronoi
climatologist
dia-
Thiessen
polygons
improve
averages
[1911],
who
assigned
proximity
to
the
observation
estimation
sites
of
in
order
precipitation
to
over
large
areas.
His
method
was worked
out
who proposed
crediting
gons,
As
polygons
research:
reported
four
play
As models
in
nonparametric
as
pattern
analysis,
in detail
the name
by Horton
Thiessen
Thiessen with
Boots
[1979],
[19171
poly-
the idea.
Thiessen
roles
for
in
geographical
spatial
processes,
techniques
as
organizing
in
point-
struc-
tures
for
displaying
spatial
data,
and
calculating
individual
probabilities
for
in
patterns.
point
Tuominen
[1949]
In
particular,
and
Snyder
we mention
[1962]
(ap-
plications
[19661
generalized
there,
to
urban
planning),
Gambini
and
Boots
Thiessen
in
particular,
[1979]
(market
areas;
used
are
polygons
the
Johnson-Mehl
and
Apollonius
models),
l~ollison
[1977]
(ecological
contact
models),
McLain
interpolation),
(cartography),
[1988]
(spatial
[1984]
[19761
Milne
al.
of Thiessen polygons
and economic
Eiselt
[1986],
point
and
(facility
location).
Arnold
and
and Okabe et
For surveys
from a geographical
of
Boots
and
see
[1986],
view,
Pederzoli
at
shaped
model.
served
foams
different
rates
give
forming
structure
structures
rise
to
the
can
of
regions
This
cell
as
made
out
of
soap
bubbles
spherically
Apollonius
Sibson
[1979].
Suzuki
and
Iri
[1986]
report
on
the
also
plants
ob-
in
be
or
[Matzke
importance
given
This
of
subdivision
inverse
recovering
the
sites
from
a
of a geographical
area.
process
of
constructing
and
1968].
Nestler
1946;
It
further
Smith
appears
Williams
1954;
as
covering
of
eas
received
plants
and
as
areas
of
transmitters
[Sakamoto
ar-
best-
and
1988].
Takagi
Weaire
give a comprehensive
statistical
librium
a
generalized,
data.
state
of
although
Interestingly,
a spider
and
Rivier
[1984]
survey and various
the
equi-
web
still
constitutes
polygonal,
polygons
arises
in
the
optimal
Thiessen
outline
precincts.
of
school
In
districts
geographical
analysis,
a valuable
Among
tree
(Figure
them
or Prim
8),
connectivity
tool
[Matula
graphs
and
the minimum
are
shortest
connection
the
~elaunay
triangulation,
or
voting
of
variation
for
Sokal
sites
are
1980].
spanning
network
and
the
Gabriel
graph.
These
three
ACM Computing
Surveys, Vol. 23, No. 3, September
1991
�
352
l
Franz Aurenhammer
\
\
\
\
\
e
53
/
/
/
/’
\
‘\
\
e
o
—-
l
Lo
--\
-%
\
\
\
\
\
\
\/
‘i
\
\
Figure 6.
Johnson-Mehl
model.
concepts
Thiessen
later.
are
polygons
intimately
as will
related
to
be discussed
1. 1.5 Blum’s
(Medial Axis) Transform
name
is
Yet another
gram
Blum’s
cerned with
Blum
science,
popular
transform
descriptors
problem
new
main
extract
given
cal model
structural
the
thus,
Fairfield
in
notion
(site)
characterizing
pattern.
the
of
description
of
particular,
[1979]
for
the
in
the
Voronoi
dia-
natural
sciences:
of a set
of sites.
Con-
biological
shape and visual
[1967]
used
shape.
of
pattern
in
it
In
for modeling
general,
recognition
pattern
from
geometri-
When
elements
no
available,
be
of
is
may
based
a site
transform.
on Blum’s
neighborhood
the
is to
a
its
on
and
ACM Computing
Surveys,
Vol. 23, No. 3, September
1991
successfully
compared
tions
of Voronoi
diagrams
contours
ceptual
psychologists.
t1973],
contour
ties
The
of
its
smooth
curvature
correspond
transform
pieces
obtained
boundaries
in
way
this
studied
As pointed
properties
out
with
per-
by Gestalt
by Blum
given
of
a
to
topological
proper-
(compare
Figure
9).
of
the
contour
(solid)
should
shape.
transform
least
two
often
digitized
form
skeleton
of
image
Montanari
Maisonneuve
Although
be
By
viewed
as
sites
of
definition,
each
(dashed)
is equidistant
point
generalized
of
from
the
at
sites.
In
this
context,
the
trans-
is
called
the
medial
axis
or
of the contour.
The
medial
exploited
was
Philbrick
Lantuejoul
by
and
axis
in
[19681,
and
contours
processing
[1968],
[1984].
the
foregoing
list
in
of
applica-
the
natural
�


 2023年江西萍乡中考道德与法治真题及答案.doc
 2012年重庆南川中考生物真题及答案.doc
 2013年江西师范大学地理学综合及文艺理论基础考研真题.doc
 2020年四川甘孜小升初语文真题及答案I卷.doc
 2020年注册岩土工程师专业基础考试真题及答案.doc
 2023-2024学年福建省厦门市九年级上学期数学月考试题及答案.doc
 2021-2022学年辽宁省沈阳市大东区九年级上学期语文期末试题及答案.doc
 2022-2023学年北京东城区初三第一学期物理期末试卷及答案.doc
 2018上半年江西教师资格初中地理学科知识与教学能力真题及答案.doc
 2012年河北国家公务员申论考试真题及答案-省级.doc
 2020-2021学年江苏省扬州市江都区邵樊片九年级上学期数学第一次质量检测试题及答案.doc
 2022下半年黑龙江教师资格证中学综合素质真题及答案.doc