第 42 卷 第 9 期
2015 年 9 月
中
国
激
光
CHINESE JOURNAL OF LASERS
Vol. 42, No. 9
September, 2015
Phase Retrieval with One Interferogram by Reflecting Off-Axis
Microscopic Interferometry
Zeng Yanan
Lei Hai Chang Xinyu Hu Xiaodong Hu Xiaotang
State Key Laboratory of Precision Measuring Technology and Instruments, Tianjin University, Tianjin 300072, China
Abstract A technique called off-axis microscopic interferometry is developed to measure the surface profile of
microstructures. This technique involves the use of a modified Mach-Zehnder microscopic interferometer with a
tilted reference wave. The technique uses a CCD camera to record the off-axis microscopic interferogram and
performs filtering in the Fourier plane via the Fourier transform method for phase retrieval. In contrast to classical
microscopic interferometry, the carrier frequency of the off-axis microscopic interferogram is sufficiently high to
facilitate acquisition of the phase from only one interferogram. As a result, measurements using this technique are
vibration-immune and efficient. The experimental results obtained for a step height standard as well as a micro-
hole array are consistent with measurements taken using a stylus profilometer. Further, the results of a comparative
experiment conducted using a Mirau interferometric microscope show that the carrier frequency added to the
classical microscopic interferogram cannot be as high as that of off-axis microscopic interferogram. Therefore,
it will lead to incorrect phase retrieval with one interferogram.
Key words measurement; surface profile; off-axis; carrier frequency; microscopic interferometry
OCIS codes 120.3180; 180.3170; 180.6900; 120.5050
基于离轴显微干涉术的单幅干涉图相位求解
曾雅楠 雷 海 常新宇 胡晓东 胡小唐
天津大学精密测试技术及仪器国家重点实验室, 天津 300072
-
CCD
曾德尔干涉
摘要 提出一种用于测量微结构表面形貌的离轴显微干涉术。该技术的实验装置为一个优化的马赫
仪。其特点为参考波是具有一定载频的倾斜波。该技术中应用
记录离轴显微干涉图,并用傅里叶变换方法对
记录的干涉图在傅里叶面进行频谱滤波求解相位。不同于经典显微干涉术,离轴显微干涉图的载频较高,仅需单
Mirau
幅干涉图即可得到相位信息。因此该技术在测量中具有防振、快捷有效的特点。利用一个标准微台阶以及微孔阵
列的形貌检测结果验证该技术的有效性,同时与轮廓仪的测试结果进行对比,证明结果一致。被测物也应用
干涉显微镜进行测试,实验结果表明经典显微干涉图干涉信息载频不足,仅使用单幅干涉图不能得到正确相位,该
组实验证明了离轴显微干涉术相对于传统显微干涉术的优越性。
关键词 测量
中图分类号
;
;
O436.1
表面形貌
doi: 10.3788/CJL201542.0908006
Introduction
1
Optical interferometry is utilized extensively in surface profile measurement because of advantages such as non-
invasiveness, high precision, and full field-of-view. Optical interferometry includes techniques such as classical
interferometry[1], holographic interferometry[2], electronic speckle pattern interferometry[3], and Moire interferometry[4].
Among these techniques, classical interferometry is used in Mirau, Michelson, and Linnik interferometers to test
A
显微干涉
文献标识码
离轴
载频
;
;
收稿日期: 2015-02-12; 收到修改稿日期: 2015-03-12
基金项目
(61223008, 51375340, 51075297)
:
:
:
国家自然科学基金
曾雅楠
胡晓东
(1988—)
(1974—)
作者简介
导师简介
,女,博士研究生,主要从事显微干涉术方面的研究。
,男,博士,教授,主要从事微纳结构检测技术方面的研究。
E-mail: ynzeng@tju.edu.cn
E-mail: xdhu@tju.edu.cn(
)
通信联系人
0908006-
1
�
中 国 激 光
microstructures; for microscopic systems, microscopic interferometry is the most frequently used technique because of
its good performance and simplicity[5-7]. Microscopic interferometry primarily includes phase shifting interferometry[8] and
white- light scanning interferometry[9 - 10] . Phase shifting interferometry extracts phase from at least three inter-
ferograms[11 - 13] . White-light scanning interferometry continually scans the surface of the sample. However, the techniques
cited above have disadvantages such as necessity for several interferograms, sensitivity to vibration, and need for an
expensive scanner or phase shifter with nanometer resolution. Further, the experimental configuration of an interferometer
microscope requires a very high degree of precision[14]. Quantitative phase microscopy is widely utilized in the
measurement of living cell movement because the phase of the samples can be retrieved using one interferogram.
However, an extra microscope objective is needed in the reference arm to correct aberrations. In addition, in quantitative
phase microscopy, the samples tested are rarely calibrated[15-17]. Theoretically, a combination of microscopic interferometry
with the Fourier transform method would only require one interferogram. In the classical microscopic interferometry setup,
this is practically achieved by tilting the tested sample to increase the carrier frequency[18-19]. However, because the carrier
frequency is insufficient, phase reversal may occur because of the overlapped frequency spectrum. Consequently, an
additional interferogram with a known shifted phase is usually required to correct the reversed phase[20]. Digital
holographic microscopy reconstructs the wavefront of the object beam with one hologram. However, this method typically
has issues such as high frequency and phase fluctuations at the edge of the reconstructed images[21-22], low efficiency
resulting from the complex Fresnel diffraction-based algorithms utilized[23-25], as well as enlargement of noise levels due
to diffraction calculation.
In this paper, we propose a technique based on off-axis microscopic interferometry. The approach increases the carrier
frequency of the interferogram with a tilted reference beam to avoid phase reversals and corrects phase distortions. This
facilitates surface profile measurement by phase retrieval from one interferogram using the filtering method in the Fourier
plane via the Fourier transform method. To verify the feasibility of the proposed approach, an experimental setup that
is quite similar to off-axis digital holographic microscope, only with the difference that the sample is focused by
microscope objective (MO), is used. In the experiments conducted, the surface profiles of some microstructures, such
as step height standard and micro-hole array, are measured to prove that the technique is feasible. Further, the results
of a test conducted on the increased carrier frequency of a classical microscopic interferogram (specifically using a Mirau
microscopic interferometer) by tilting the sample are presented to show that the carrier frequency is not high enough to
retrieve the correct phase from one interferogram.
2 Experimental setup and principle
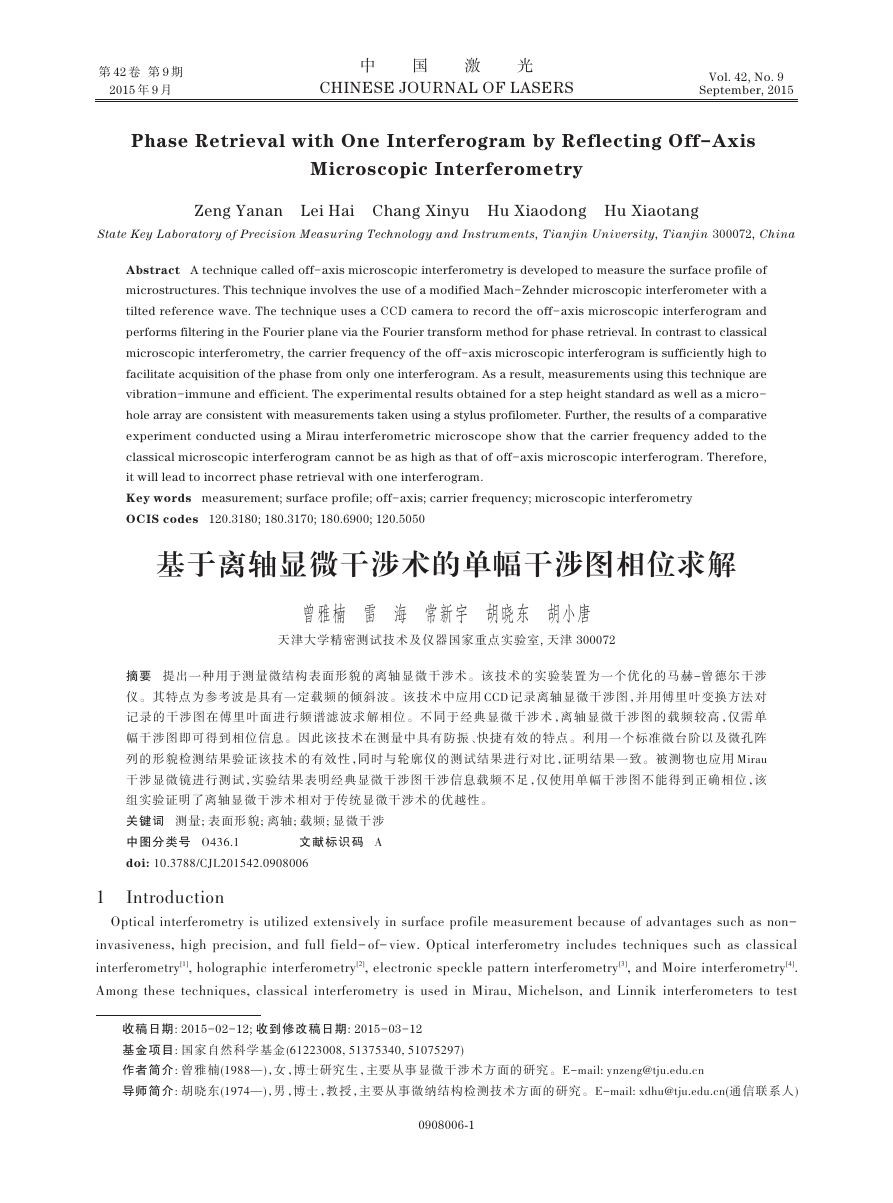
The experimental setup used to verify the feasibility of off-axis microscopic interferometry is shown in Fig. 1. The
source was a diode pumped laser with
= 640 nm (CrystaLaser, CL640-050-S). The object wave O containing the
information about the sample was collected by MO (Mitutoyo, M Plan Apo SL,
=0.42, magnification is 50 × ). The
sample was illuminated with an approximately collimated beam by applying an object lens (OL in Fig. 1) located at the
back focal plane of the MO. The reference wave R was tilted by adjusting mirror M2 to increase the carrier frequency,
reducing the overlapping effect of the frequency spectrum. Like the object wave, the reference wave was also a spherical
, specifically the off-axis angle, is the angle
wave with the aid of the reference lens (RL in Fig. 1). The tilted angle
between the central axis of the object and reference beams. A CCD camera (Imperx, PX-2M30-L,
= 1008 × 1028 ,
square pixel view of 7.4 μm , 33 frame/s) was used to record the interferogram.
The intensity distribution of the interferogram can be written as
(
)+
,
where (
is related to the local contrast of the pattern,
)cos[
is the coordinate of the interferogram,
(
ϕo
) is the phase of object beam at pixel
,
(
(1)
(
,
)
) is the
)-
)
)=
)+
NA
×
M
N
λ
(
(
(
(
)
,
,
,
,
,
,
a
a
y
x
,
,
(
)+
)]=
(
is the background intensity (which varies slowly),
ϕR
,
) , and
) ,
*(
(
(
,
,
a
x
y
x
y
x
y
c
c
b
x
b
x
i
x
x
y
θ
x
y
x
y
y
y
x
y
y
x
y
ϕR
x
y
ϕo
x
y
0908006-
2
�
phase of the reference beam. The phase of
(
,
) is given by
中 国 激 光
,
)-
,
,
(
)=
(
The frequency spectrum of
) and
,
(
,
c
y
x
,
*(
) are symmetrical to the origin.
(
,
M2 (Fig. 1) in the off-axis setup (Fig. 1) to create a small off-axis angle
frequency of the interference fringes. Thus, the angle
is evaluated as follows.
(
a
θ
x
y
x
y
x
y
c
c
c
y
x
y
x
(
ϕ
) .
(2)
) is centralized in the adjacent domain of the origin, and the frequency spectra of
) by adjusting mirror
(
,
is related to the spatial
ϕo
) can be achieved with separation from
. The angle
ϕR
a
x
y
x
y
x
y
c
θ
θ
Fig.1 Off-axis microscopic interferometry in reflection configuration. NF: neutral filter; M: mirror; BE: beam expander;
The MO can be simplified as a lens. Fig. 2 shows the imaging principle of this lens.
OL: object lens; RL: reference lens; BS: beam splitter; MO: microscope objective
i
y
x
,
(
(
U
2
λ
)=
The complex amplitude distribution in the image plane is
(
,
Fig.2 Imaging principle of lens
2) ∬∬
2 +
U0
(
-j k
expé
ê
ë
+
is the coordinate of the object plane,
is the wavenumber,
j k2
expé
ê
ë
2 +
j k2
y
2
d0
-
)expì
,
jé
êê
í
ë
î
= 2π/
(
,
)×
) expé
-j k
ù
y0 η
ú
ëê
û
2 +
+ k
1
d0 d
expæ
ç
∬
è
(
x0
+
k
d
x0 ξ
yη
ö
÷
ø
ö
÷
ø
xξ
ù
ú
û
M
y0
D
P
η
η
)
d
d
(
x
x
y
ξ
ξ
2
i
i
i
i
)
where (
,
coordinate,
x0
y0
distance and image distance,
magnification.
)
*(
)=
(
(
,
,
k
c
x
y
O
x
y
R
x
y
k
.
respectively.
) , hence, the phase of
,
λ
λ
η
(
)
ξ
) d
ù
ûú
ü
ý
þ
d
i
2
x
)
d
y0
d0
xξ
æ
ç
è
yη
y
2
2 +
+ k
d0
(
,
x0
d
is the object′s wavefront,
(
is the wavelength of the laser source, and
,
U0
x0
is the coordinate of
ù
)
úú
û
M
y0
η
)
(
x
y
ξ
2
the lens plane,
d0
)
,
i
y
i
x
) is
(
,
c
x
y
0908006-
3
(
+
d
d
=
d
ξ
η
,
(3)
is the image plane′s
are the object
and
is the imaging
d
i
M
�
2 +
i
c
m
m
2
y
x
x
y
x
y
x
d
,
,
(
(
(
ϕ
M
d0
ξx
y
2
ηy
-
+
(
′[
)+ k
)= - k
中 国 激 光
(4)
2 +
′ is the distance from the center to the CCD camera.
)2 +(
+ k
) is the center of the spherical reference beam, and
where (
Thus the spatial frequency of the fringes in the
= - k
= - k
2)- k2
directions is
- k2
+ k
+ k
- k2
The spatial frequency should not only be large enough to separate
(
(
than the cut-off frequency of the CCD camera according to the Nyquist sampling theory. Therefore,
)
-
)
-
) and
= 1
2π
= 1
2π
and
+ k
+ k
y
x
2
M
y
2
M
∂
P∂
∂
P∂
(5)
) , but also less
,
y
′(
′(
,
from
2
2
2
2
ì
ïï
í
ïï
î
*(
-
)2
d0
d0
η
)
]
,
.
,
d
d
d
d
d
d
d
d
d
a
x
y
x
x
y
y
x
x
x
x
y
y
y
x
y
x
y
x
ξ
c
i
i
f
x
f
y
c
i
i
m
m
n
n
i
)
)
|O|2
|O|2
= MX
= MY
λd
i
λd
i
)
)
)
)
min
f
x
min
f
y
min
f
x
OR*
OR*
OR*
f
min
OR*
x
f
f
max
≥(
≥(
max
≤ 1
2Δ
≤ 1
2Δ
x
y
y
(
ì
ï
(
ï
ï
ïï
ï
(
í
ï
ï
(
ï
ïï
ï
î
,
(6)
X
and
are, respectively, the size of the sample in the
where
intervals in the image plane, specifically, the pixel size of the CCD camera.
The off-axis angle
and
is
Y
x
y
x
θ
directions. Δ
and Δ
y
x
are the sampling
+
n
2
2
c
y
x
y
x
θ
θ
θ
d
,
,
(
=
m
d
≈ tan
(7)
is the vertical distance between mirror M2 in Fig. 1 and the center of the spherical reference beam. According
is evaluated in the range of 1.18°~
where
to equations (6) and (7) and the parameters of the selected components in our setup,
1.53° . Thus, it is set to approximately 1.5° .
Consequently,
(
,
) is obtained by frequency-domain filtering of the interferogram:
-1 denote Fourier transform and inverse Fourier transform, respectively.
(8)
) is the window function
where
) is the shifting function to shift the filtered frequency spectrum to the center. The
for frequency filtering and
window function is chosen to be a circular one, with center located at the most powerful point in the frequency spectrum
and radius set to include as much of the frequency spectrum as possible while avoiding the central part.
The phase distortions caused by the position error between the centers of the two interfering spherical waves can
be viewed as system error because they are relatively fixed if the setup is kept stationary. It is calculated by phase
correction of computation related to optical aberration parameters. The phase of the reference wave and the surface
profile can be calculated using equations (9) and (10), respectively.
and
)]
}
)=
-1{
W
W
D
D
F
F
F
F
η
η
η
η
(
)
(
)
[
(
(
(
,
,
,
,
,
,
x
y
x
y
ξ
ξ
ξ
ξ
c
I
i
i
(
,
x
y
ϕsample
Im[
)= arctanì
Re[
í
(
,
)×
î
4π
x
y
= ϕ sample
(
(
c
c
λ
x
x
,
,
,
h
y
y
)× exp(-
)× exp(-
)
]
)
]
,
ü
ý
þ
ϕse
ϕse
(9)
(10)
ϕse
is the phase of the system error and
where
3 Results and analysis
To evaluate the feasibility of off-axis microscopic interferometry, the surface profiles of a nanometer step height
standard [VLSI, SHS-440-QC, (43.2±0.6) nm] and a micro-hole array (853 nm in depth) were measured and
is the height of the tested sample.
h
0908006-
4
�
中 国 激 光
analyzed. The results were compared to those obtained using a stylus profilometer (KLA-Tencor, P-16+/P-6) with a
mass of 2 mg, which confirmed that the system error was effectively corrected. To evaluate whether the carrier
frequency was high enough to extract phase from one interferogram in order to measure the surface profile of the
complicated microstructure, the micro-hole array was also tested using a classical Mirau microscopic interferometer
combined with the Fourier transform method.
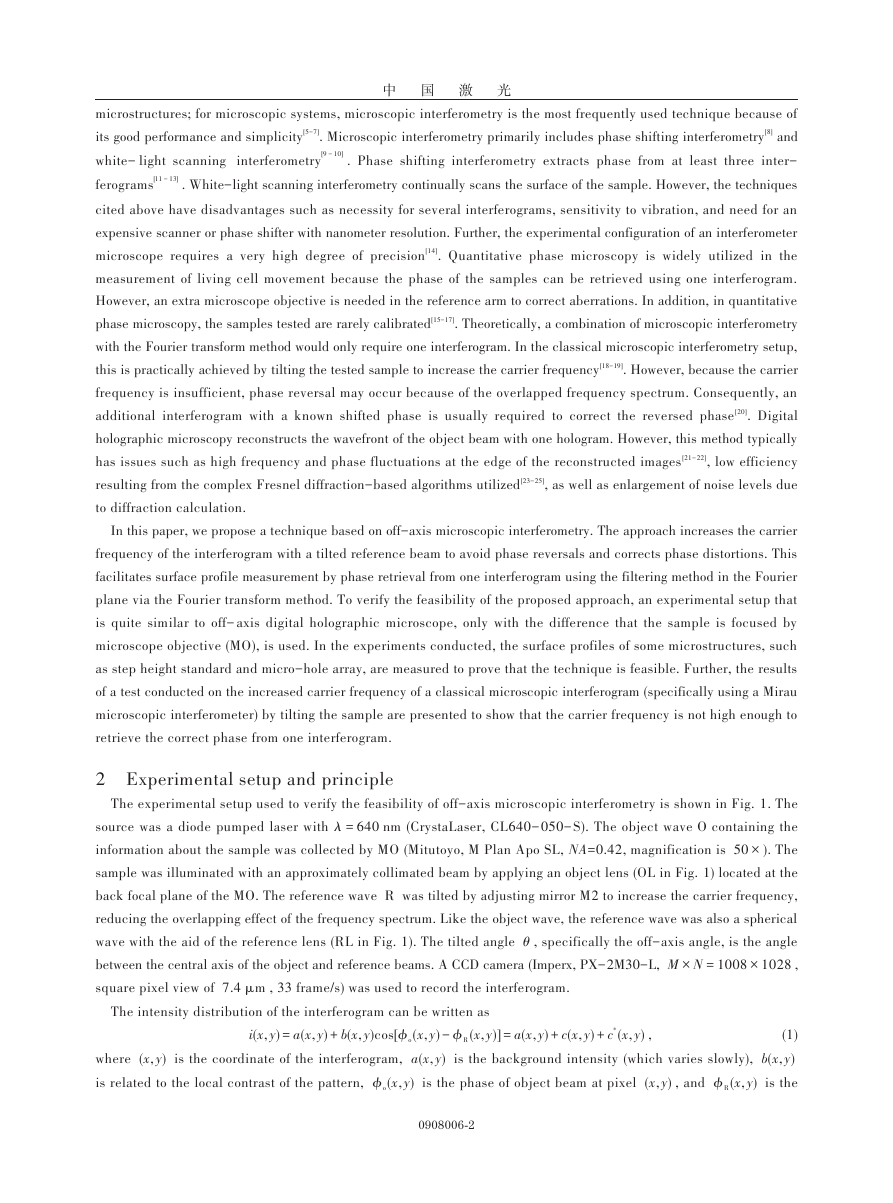
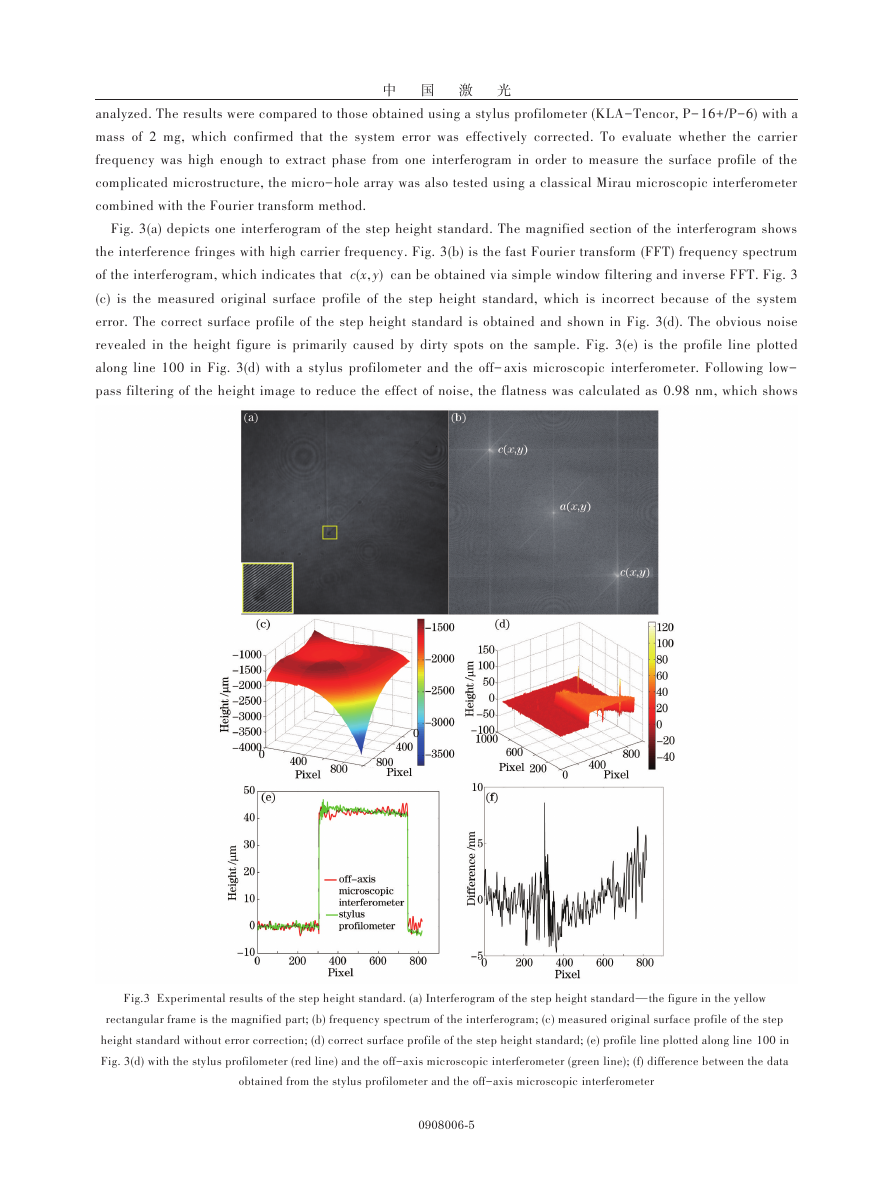
Fig. 3(a) depicts one interferogram of the step height standard. The magnified section of the interferogram shows
the interference fringes with high carrier frequency. Fig. 3(b) is the fast Fourier transform (FFT) frequency spectrum
of the interferogram, which indicates that
) can be obtained via simple window filtering and inverse FFT. Fig. 3
(c) is the measured original surface profile of the step height standard, which is incorrect because of the system
error. The correct surface profile of the step height standard is obtained and shown in Fig. 3(d). The obvious noise
revealed in the height figure is primarily caused by dirty spots on the sample. Fig. 3(e) is the profile line plotted
along line 100 in Fig. 3(d) with a stylus profilometer and the off-axis microscopic interferometer. Following low-
pass filtering of the height image to reduce the effect of noise, the flatness was calculated as 0.98 nm, which shows
(
,
c
x
y
Fig.3 Experimental results of the step height standard. (a) Interferogram of the step height standard—the figure in the yellow
rectangular frame is the magnified part; (b) frequency spectrum of the interferogram; (c) measured original surface profile of the step
height standard without error correction; (d) correct surface profile of the step height standard; (e) profile line plotted along line 100 in
Fig. 3(d) with the stylus profilometer (red line) and the off-axis microscopic interferometer (green line); (f) difference between the data
obtained from the stylus profilometer and the off-axis microscopic interferometer
0908006-
5
�
中 国 激 光
that the phase distortions were effectively corrected. The step height measured was (42.6 ± 0.7) nm. This is in
reasonable agreement with the standard value. Fig. 3(f) shows the difference between the data obtained from the
stylus profilometer and the off-axis microscopic interferometry setup. The difference is controlled in the range of -
4.2~ 5.4 nm. The effective area of the field of view is approximately 149
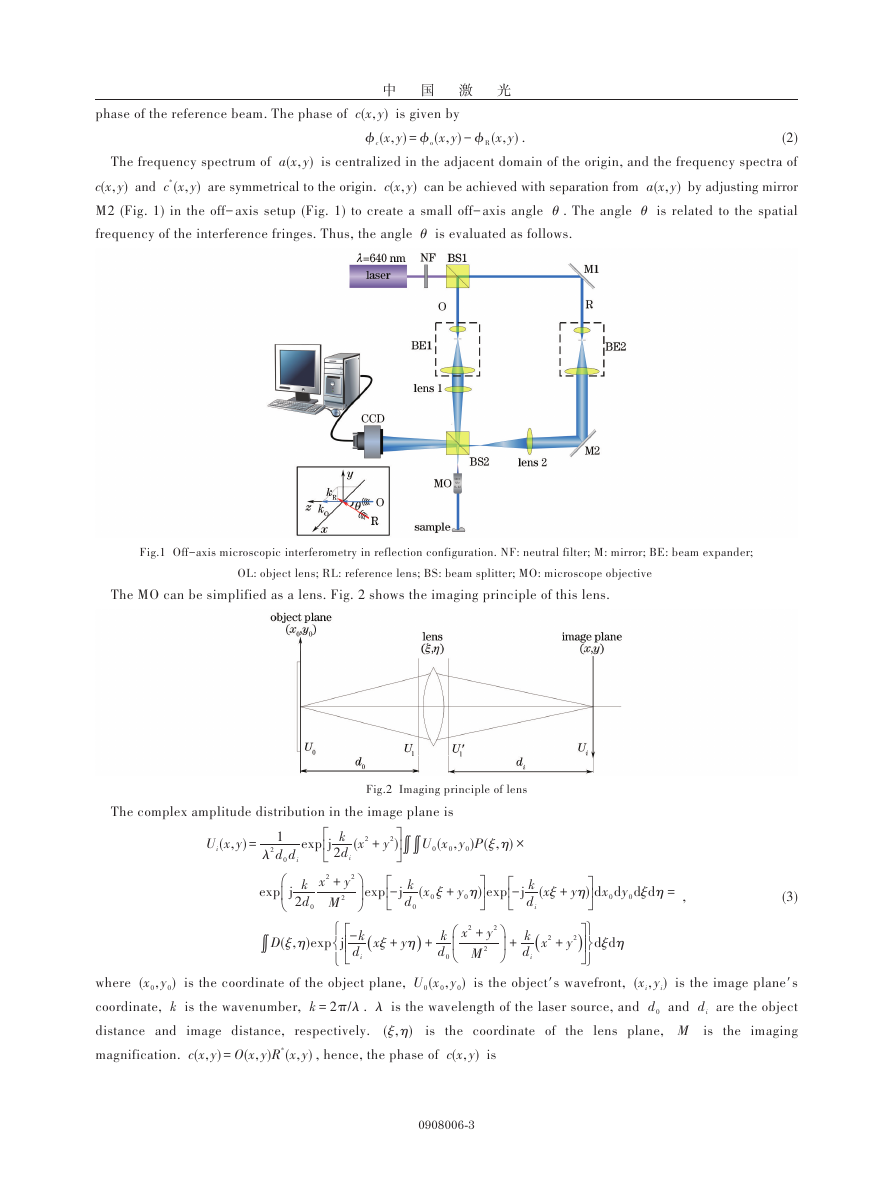
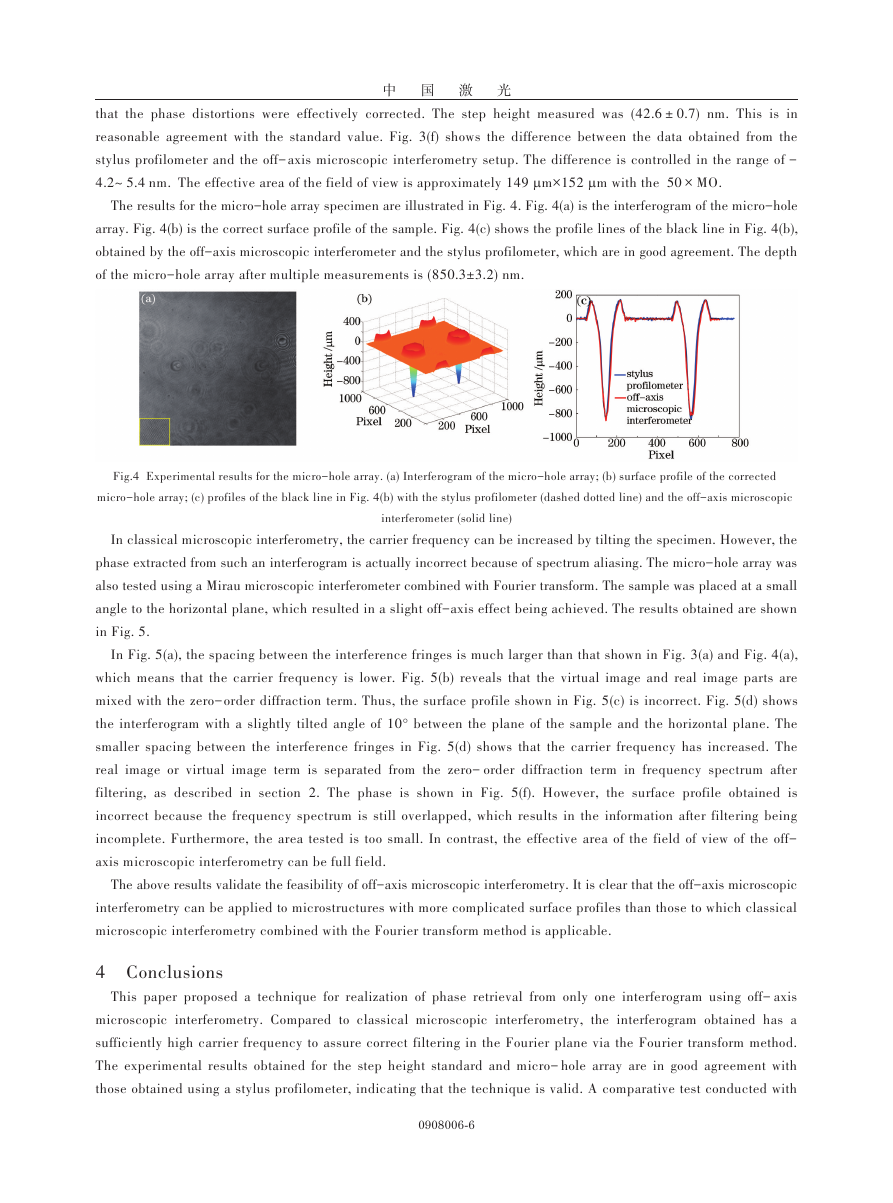
The results for the micro-hole array specimen are illustrated in Fig. 4. Fig. 4(a) is the interferogram of the micro-hole
array. Fig. 4(b) is the correct surface profile of the sample. Fig. 4(c) shows the profile lines of the black line in Fig. 4(b),
obtained by the off-axis microscopic interferometer and the stylus profilometer, which are in good agreement. The depth
of the micro-hole array after multiple measurements is (850.3±3.2) nm.
m with the 50 × MO.
m
m×152
m
Fig.4 Experimental results for the micro-hole array. (a) Interferogram of the micro-hole array; (b) surface profile of the corrected
interferometer (solid line)
micro-hole array; (c) profiles of the black line in Fig. 4(b) with the stylus profilometer (dashed dotted line) and the off-axis microscopic
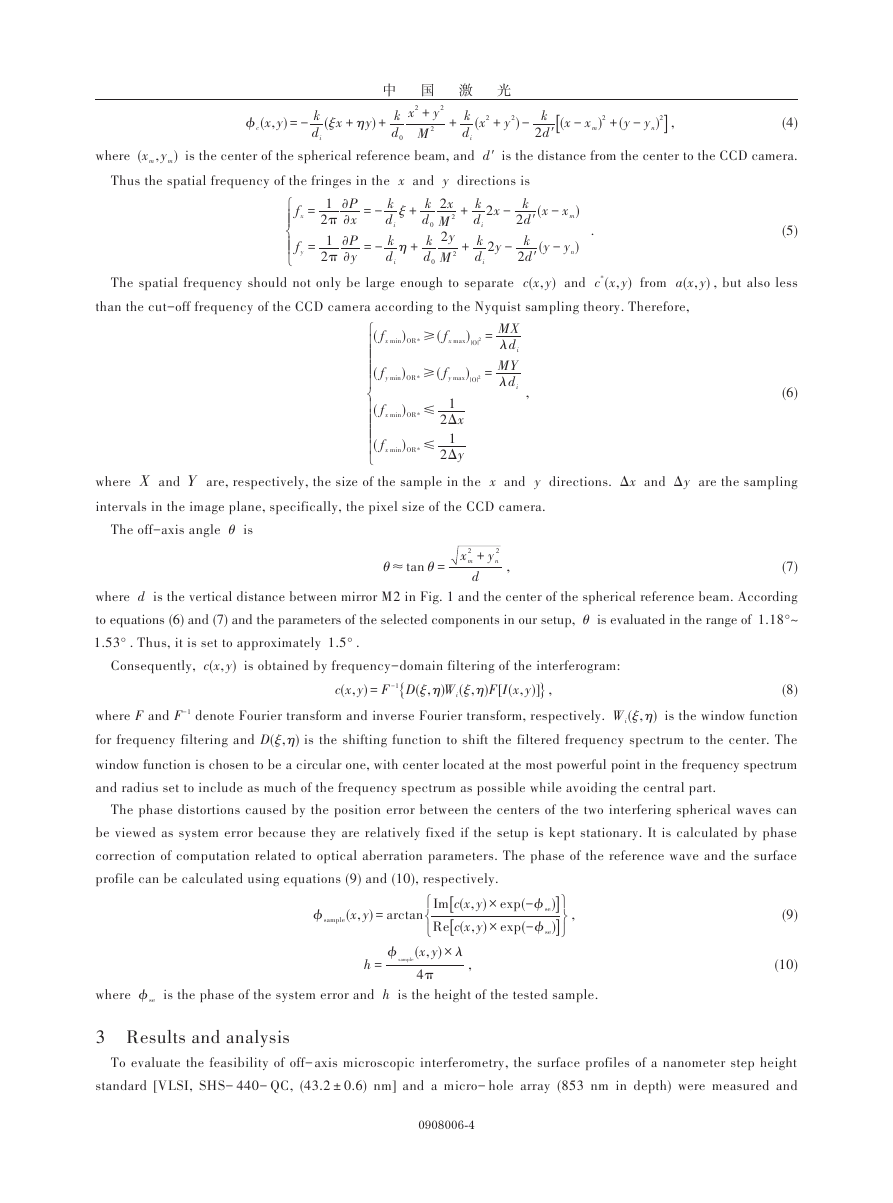
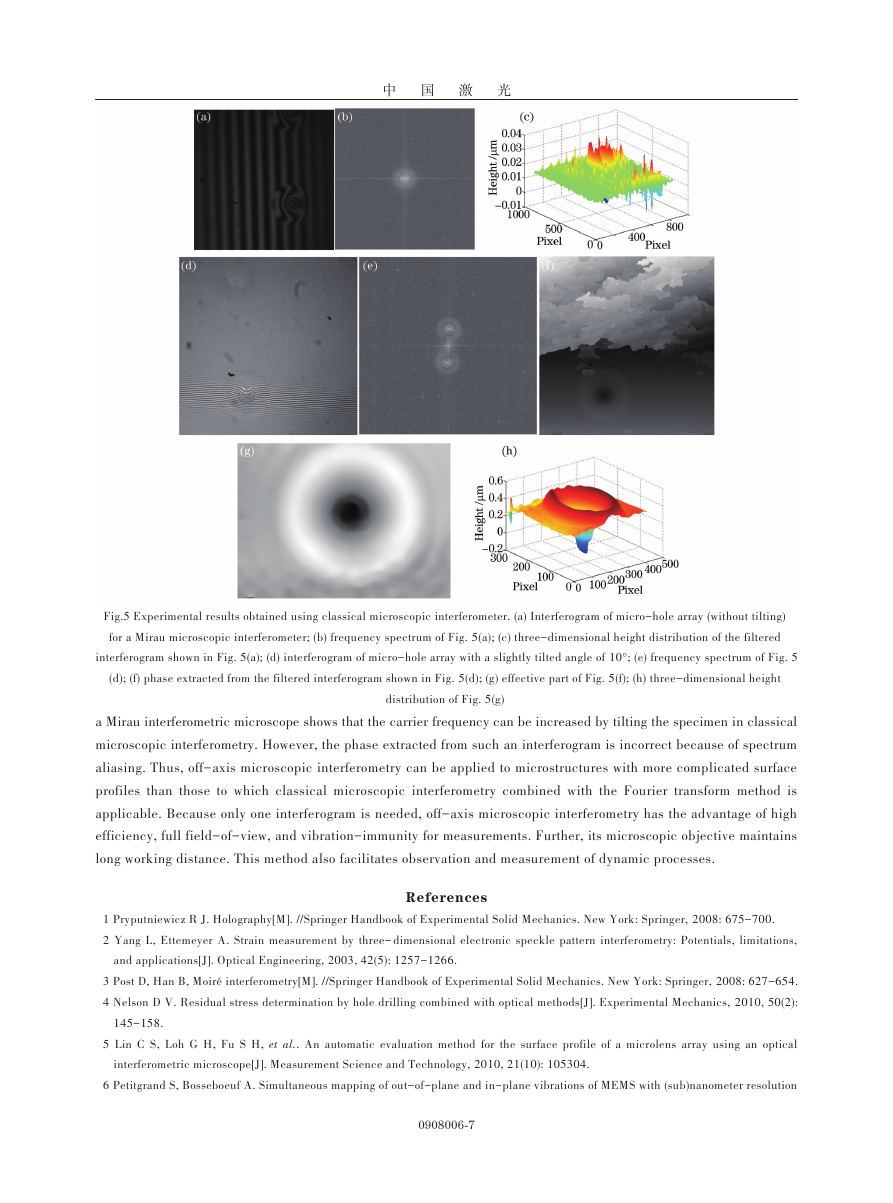
In classical microscopic interferometry, the carrier frequency can be increased by tilting the specimen. However, the
phase extracted from such an interferogram is actually incorrect because of spectrum aliasing. The micro-hole array was
also tested using a Mirau microscopic interferometer combined with Fourier transform. The sample was placed at a small
angle to the horizontal plane, which resulted in a slight off-axis effect being achieved. The results obtained are shown
in Fig. 5.
In Fig. 5(a), the spacing between the interference fringes is much larger than that shown in Fig. 3(a) and Fig. 4(a),
which means that the carrier frequency is lower. Fig. 5(b) reveals that the virtual image and real image parts are
mixed with the zero-order diffraction term. Thus, the surface profile shown in Fig. 5(c) is incorrect. Fig. 5(d) shows
the interferogram with a slightly tilted angle of 10° between the plane of the sample and the horizontal plane. The
smaller spacing between the interference fringes in Fig. 5(d) shows that the carrier frequency has increased. The
real image or virtual image term is separated from the zero- order diffraction term in frequency spectrum after
filtering, as described in section 2. The phase is shown in Fig. 5(f). However, the surface profile obtained is
incorrect because the frequency spectrum is still overlapped, which results in the information after filtering being
incomplete. Furthermore, the area tested is too small. In contrast, the effective area of the field of view of the off-
axis microscopic interferometry can be full field.
The above results validate the feasibility of off-axis microscopic interferometry. It is clear that the off-axis microscopic
interferometry can be applied to microstructures with more complicated surface profiles than those to which classical
microscopic interferometry combined with the Fourier transform method is applicable.
4 Conclusions
This paper proposed a technique for realization of phase retrieval from only one interferogram using off-axis
microscopic interferometry. Compared to classical microscopic interferometry, the interferogram obtained has a
sufficiently high carrier frequency to assure correct filtering in the Fourier plane via the Fourier transform method.
The experimental results obtained for the step height standard and micro-hole array are in good agreement with
those obtained using a stylus profilometer, indicating that the technique is valid. A comparative test conducted with
0908006-
6
�
中 国 激 光
Fig.5 Experimental results obtained using classical microscopic interferometer. (a) Interferogram of micro-hole array (without tilting)
for a Mirau microscopic interferometer; (b) frequency spectrum of Fig. 5(a); (c) three-dimensional height distribution of the filtered
interferogram shown in Fig. 5(a); (d) interferogram of micro-hole array with a slightly tilted angle of 10°; (e) frequency spectrum of Fig. 5
(d); (f) phase extracted from the filtered interferogram shown in Fig. 5(d); (g) effective part of Fig. 5(f); (h) three-dimensional height
a Mirau interferometric microscope shows that the carrier frequency can be increased by tilting the specimen in classical
microscopic interferometry. However, the phase extracted from such an interferogram is incorrect because of spectrum
aliasing. Thus, off-axis microscopic interferometry can be applied to microstructures with more complicated surface
profiles than those to which classical microscopic interferometry combined with the Fourier transform method is
applicable. Because only one interferogram is needed, off-axis microscopic interferometry has the advantage of high
efficiency, full field-of-view, and vibration-immunity for measurements. Further, its microscopic objective maintains
long working distance. This method also facilitates observation and measurement of dynamic processes.
distribution of Fig. 5(g)
1 Pryputniewicz R J. Holography[M]. //Springer Handbook of Experimental Solid Mechanics. New York: Springer, 2008: 675-700.
2 Yang L, Ettemeyer A. Strain measurement by three-dimensional electronic speckle pattern interferometry: Potentials, limitations,
and applications[J]. Optical Engineering, 2003, 42(5): 1257-1266.
3 Post D, Han B, Moiré interferometry[M]. //Springer Handbook of Experimental Solid Mechanics. New York: Springer, 2008: 627-654.
4 Nelson D V. Residual stress determination by hole drilling combined with optical methods[J]. Experimental Mechanics, 2010, 50(2):
145-158.
5 Lin C S, Loh G H, Fu S H,
interferometric microscope[J]. Measurement Science and Technology, 2010, 21(10): 105304.
6 Petitgrand S, Bosseboeuf A. Simultaneous mapping of out-of-plane and in-plane vibrations of MEMS with (sub)nanometer resolution
. An automatic evaluation method for the surface profile of a microlens array using an optical
et al.
References
0908006-
7
�
中 国 激 光
[J]. Journal of Micromechanics and Microengineering, 2004, 14(9): S97.
7 Nolte D. Interference microscopy[M]. //Optical Interferometry for Biology and Medicine. New York: Springer, 2012: 251-272.
8 Chen F, Brown G M, Song M. Overview of three-dimensional shape measurement using optical methods[J]. Optical Engineering,
2000, 39(1): 10-22.
9 Windecker R, Fleischer M, Körner K,
and Lasers in Engineering, 2001, 36(2): 141-154.
Testing micro devices with fringe projection and white-light interferometry[J]. Optics
et al..
Micro- structure characterization based on white light interferometry[C]. 2012 International
10 Guo T, Zhang Y, Wang S,
Workshop on Image Processing and Optical Engineering, 2012: 833509.
et al..
11 Wang Z, Han B. Advanced iterative algorithm for phase extraction of randomly phase-shifted interferograms[J]. Optics Letters,
12 Marroquin J L, Servin M, Rodriguez Vera R. Adaptive quadrature filters for multiple phase-stepping images[J]. Optics Letters,
13 Larkin K. A self-calibrating phase-shifting algorithm based on the natural demodulation of two-dimensional fringe patterns[J].
2004, 29(14): 1671-1673.
1998, 23(4): 238-240.
Optics Express, 2001, 9(5): 236-253.
14 Osten W. Optical Inspection of Microsystems[M]. Boca Raton: CRC Press, 2006: 376.
15 Ikeda T, Popescu G, Dasari R R,
Letters, 2005, 30(10): 1165-1167.
et al.
. Hilbert phase microscopy for investigating fast dynamics in transparent systems[J]. Optics
16 Jang J, Bae C Y, Park J K,
. Self-reference quantitative phase microscopy for microfluidic devices[J]. Optics Letters, 2010, 35
. Diffraction phase microscopy for quantifying cell structure and dynamics[J]. Optics Letters,
et al.
et al.
(4): 514-516.
17 Popescu G, Ikeda T, Dasari R R,
2006, 31(6): 775-777.
18 Hu X, Liu G, Hu C,
Characterization of static and dynamic microstructures by microscopic interferometry based on a Fourier
transform method[J]. Measurement Science and Technology, 2006, 17(6): 1312.
et al..
19 Srivastava V, Anna T, Mehta D S. Full-field Hilbert phase microscopy using nearly common-path low coherence off-axis interferometry
for quantitative imaging of biological cells[J]. Journal of Optics, 2012, 14(12): 125707.
20 Garcia-Sucerquia J, Ramírez J A H, Prieto D V. Reduction of speckle noise in digital holography by using digital image processing
[J]. Optik-International Journal for Light and Electron Optics, 2005, 116(1): 44-48.
21 Cuche E, Marquet P, Depeursinge C. Aperture apodization using cubic spline interpolation: Application in digital holographic microscopy
[J]. Optics Communications, 2000, 182(1): 59-69.
22 Schlichthaber F, von Bally G, Kemper B. Influence of Fresnel diffraction on numerical propagation and correction of tilted image
planes in digital holographic microscopy[C]. SPIE, 2012, 8430: 843003.
23 Schnars U, Jüptner W. Direct recording of holograms by a CCD target and numerical reconstruction[J]. Applied Optics, 1994, 33(2):
179-181.
2002, 13(9): R85.
24 Schnars U, Jüptner W P O. Digital recording and numerical reconstruction of holograms[J]. Measurement Science and Technology,
25 Weng J, Zhong J, Hu C. Digital reconstruction based on angular spectrum diffraction with the ridge of wavelet transform in
holographic phase-contrast microscopy[J]. Optics Express, 2008, 16(26): 21971-21981.
栏目编辑:吴秀娟
0908006-
8
�


 2023年江西萍乡中考道德与法治真题及答案.doc
 2012年重庆南川中考生物真题及答案.doc
 2013年江西师范大学地理学综合及文艺理论基础考研真题.doc
 2020年四川甘孜小升初语文真题及答案I卷.doc
 2020年注册岩土工程师专业基础考试真题及答案.doc
 2023-2024学年福建省厦门市九年级上学期数学月考试题及答案.doc
 2021-2022学年辽宁省沈阳市大东区九年级上学期语文期末试题及答案.doc
 2022-2023学年北京东城区初三第一学期物理期末试卷及答案.doc
 2018上半年江西教师资格初中地理学科知识与教学能力真题及答案.doc
 2012年河北国家公务员申论考试真题及答案-省级.doc
 2020-2021学年江苏省扬州市江都区邵樊片九年级上学期数学第一次质量检测试题及答案.doc
 2022下半年黑龙江教师资格证中学综合素质真题及答案.doc