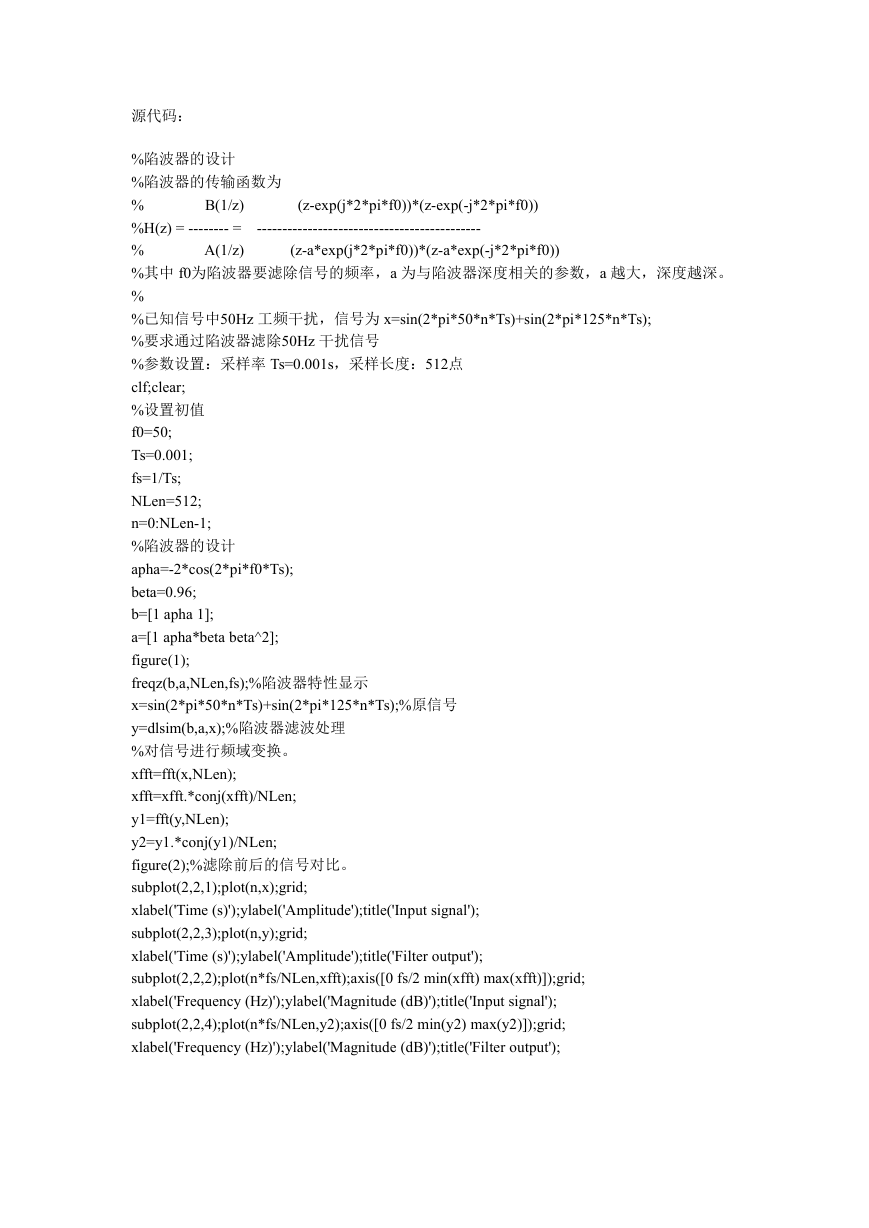
源代码:
B(1/z)
A(1/z)
(z-exp(j*2*pi*f0))*(z-exp(-j*2*pi*f0))
(z-a*exp(j*2*pi*f0))*(z-a*exp(-j*2*pi*f0))
%陷波器的设计
%陷波器的传输函数为
%
%H(z) = -------- = --------------------------------------------
%
%其中 f0为陷波器要滤除信号的频率,a 为与陷波器深度相关的参数,a 越大,深度越深。
%
%已知信号中50Hz 工频干扰,信号为 x=sin(2*pi*50*n*Ts)+sin(2*pi*125*n*Ts);
%要求通过陷波器滤除50Hz 干扰信号
%参数设置:采样率 Ts=0.001s,采样长度:512点
clf;clear;
%设置初值
f0=50;
Ts=0.001;
fs=1/Ts;
NLen=512;
n=0:NLen-1;
%陷波器的设计
apha=-2*cos(2*pi*f0*Ts);
beta=0.96;
b=[1 apha 1];
a=[1 apha*beta beta^2];
figure(1);
freqz(b,a,NLen,fs);%陷波器特性显示
x=sin(2*pi*50*n*Ts)+sin(2*pi*125*n*Ts);%原信号
y=dlsim(b,a,x);%陷波器滤波处理
%对信号进行频域变换。
xfft=fft(x,NLen);
xfft=xfft.*conj(xfft)/NLen;
y1=fft(y,NLen);
y2=y1.*conj(y1)/NLen;
figure(2);%滤除前后的信号对比。
subplot(2,2,1);plot(n,x);grid;
xlabel('Time (s)');ylabel('Amplitude');title('Input signal');
subplot(2,2,3);plot(n,y);grid;
xlabel('Time (s)');ylabel('Amplitude');title('Filter output');
subplot(2,2,2);plot(n*fs/NLen,xfft);axis([0 fs/2 min(xfft) max(xfft)]);grid;
xlabel('Frequency (Hz)');ylabel('Magnitude (dB)');title('Input signal');
subplot(2,2,4);plot(n*fs/NLen,y2);axis([0 fs/2 min(y2) max(y2)]);grid;
xlabel('Frequency (Hz)');ylabel('Magnitude (dB)');title('Filter output');
�
e
d
u
t
i
l
p
m
A
e
d
u
t
i
l
p
m
A
2
1
0
-1
-2
0
2
1
0
-1
-2
0
Input signal
120
100
80
60
40
20
)
B
d
(
e
d
u
t
i
n
g
a
M
100
200
300
Time (s)
400
500
600
0
100
Filter output
)
B
d
(
e
d
u
t
i
n
g
a
M
120
100
80
60
40
20
100
200
300
Time (s)
400
500
600
0
100
�


 2023年江西萍乡中考道德与法治真题及答案.doc
 2012年重庆南川中考生物真题及答案.doc
 2013年江西师范大学地理学综合及文艺理论基础考研真题.doc
 2020年四川甘孜小升初语文真题及答案I卷.doc
 2020年注册岩土工程师专业基础考试真题及答案.doc
 2023-2024学年福建省厦门市九年级上学期数学月考试题及答案.doc
 2021-2022学年辽宁省沈阳市大东区九年级上学期语文期末试题及答案.doc
 2022-2023学年北京东城区初三第一学期物理期末试卷及答案.doc
 2018上半年江西教师资格初中地理学科知识与教学能力真题及答案.doc
 2012年河北国家公务员申论考试真题及答案-省级.doc
 2020-2021学年江苏省扬州市江都区邵樊片九年级上学期数学第一次质量检测试题及答案.doc
 2022下半年黑龙江教师资格证中学综合素质真题及答案.doc