10.1109/ULTSYM.2011.0481
1-3 Microfabricated Composite Acoustic Matching
Layers for High Frequency Transducers
Tung Manh, Lars Hoff
Institute of Micro and Nano Systems Technology
Vestfold University College
Horten, Norway
Tung.Manh@hive.no
Tonni Franke Johansen
Department of Circulation and Medical Imaging
Norwegian University of Science and Technology
Trondheim, Norway
Geir Uri Jensen
Department of Microsystems and Nanotechnology
SINTEF ICT
Oslo, Norway
the
paper
presents
fabrication
and
Abstract—This
characterization of a 1-3 silicon-polymer composite matching
layer made by Deep Reactive Ion Etch (DRIE) method. A well-
defined composite layer thickness of 83 µm was obtained by using
Silicon-on-Insulator (SOI) wafers as substrate. The resulting
composite has 7 µm size posts and 9 µm spacing between posts. A
slight tapering of the posts was observed after the DRIE process,
causing the posts to be narrower in the bottom than at the top.
The composite was used as acoustic matching layer in an air-
backed 15 MHz transducer and characterized by electrical
impedance measurements in air. The effective acoustic properties
of the composite, speed of sound and acoustic impedance,
deduced from measured results, were found to be lower than
those predicted from iso-strain model. This deviation can be
explained by tapering of the trench walls and the dispersion
caused by the finite dimensions of the bi-phase material, an
explanation that was verified by FEM simulations.
Keywords-1-3 composite; acoustic matching layers; silicon
micromachining; high frequency transducers.
I.
INTRODUCTION
for
high
frequency
High frequency broadband ultrasound transducers provide
high resolution images in situations where the imaging depth
is small, e.g. in intravascular ultrasound. In such transducers,
one or more acoustic matching layers are used to effectively
couple energy from the transducer to the tissue. We have
previously presented methods to fabricate such matching
layers
using
micromachining technologies from Micro-Electro-Mechanical
Systems (MEMS) industry, such as photolithography and etch
[1]. The acoustic matching
is a silicon-polymer
composite, of 2-2 or 1-3 connectivity, where the silicon
substrate is micromachined and filled with epoxy resin.
Different micromachining methods can be used to fabricate
such a layer, e.g. anisotropic wet etch of <110>-oriented
silicon wafer or Deep Reactive Ion Etch (DRIE) by the Bosch-
process. Anisotropic wet etch depends on
the crystal
orientation, and is only suitable to form 2-2 composite
transducers
layer
by
structures. This method requires a very good alignment of the
feature lines along the <111> crystal planes, which can be
demanding at the small dimensions needed for transducers
working at high frequencies.
This paper describes fabrication of 1-3 composites by DRIE
method. This technology is not sensitive to crystal orientation,
and is promising for mass production. The process uses a
Silicon-on-Insulator (SOI) wafer with a buried silicon dioxide
layer to stop the etching at a well-defined thickness, 83 µm.
The composite fabricated by this method was bonded to a
15MHz PZT disc with coaxial electrodes, forming an air-
backed ultrasound transducer. Composite properties were
calculated from electrical measurements in air, and compared
to values calculated from the iso-strain model.
II. THEORY
A. The iso-strain model
A composite behaves acoustically like a homogeneous
material if its lateral dimensions are sufficiently fine. Within
this regime, effective elastic parameters of the composite can
be calculated from the theoretical model developed by Smith
et al. [2] without piezoelectric coupling. The resulting
effective parameters for a 1-3 composite are
=
C
c
33
⎡
⎢
⎢
v c
⎢
⎢
⎢
⎣
Si
11
2
+
p
⎛
c
⎜
12
⎝
Si
⎞
c
⎟
12
⎠
−
ˆ
v
Si
c
11
ˆ
v
⎛
⎜
⎝
2
−
Si
⎞
c
⎟
12
⎠
p
+
ν
⎛
c
⎜
11
⎝
=
v
Z
Si
ˆ p
C
ρ ρ ρ
+ %
v
C
C C
c ρ
33
C
c
33
C
ρ
V
C
=
=
⎤
⎥
⎥
⎥
⎥
⎥
⎦
+
p
c
12
⎞
⎟
⎠
+
ˆ
vc
p
11
(1)
(2)
(3)
(4)
This work is funded by the Research Council of Norway under Grants
No. 176540, 191282, and 181712/I30.
978-1-4577-1252-4/11/$26.00 ©2011 IEEE
1932
2011 IEEE International Ultrasonics Symposium Proceedings
�
etched structures vacuum filled by epoxy resin (Spurrs,
Electron Microscopy Sciences, PA, USA) to form the
composite material. The impregnated wafers were cured at
70°C for 8 hours. The composite with high aspect ratio posts
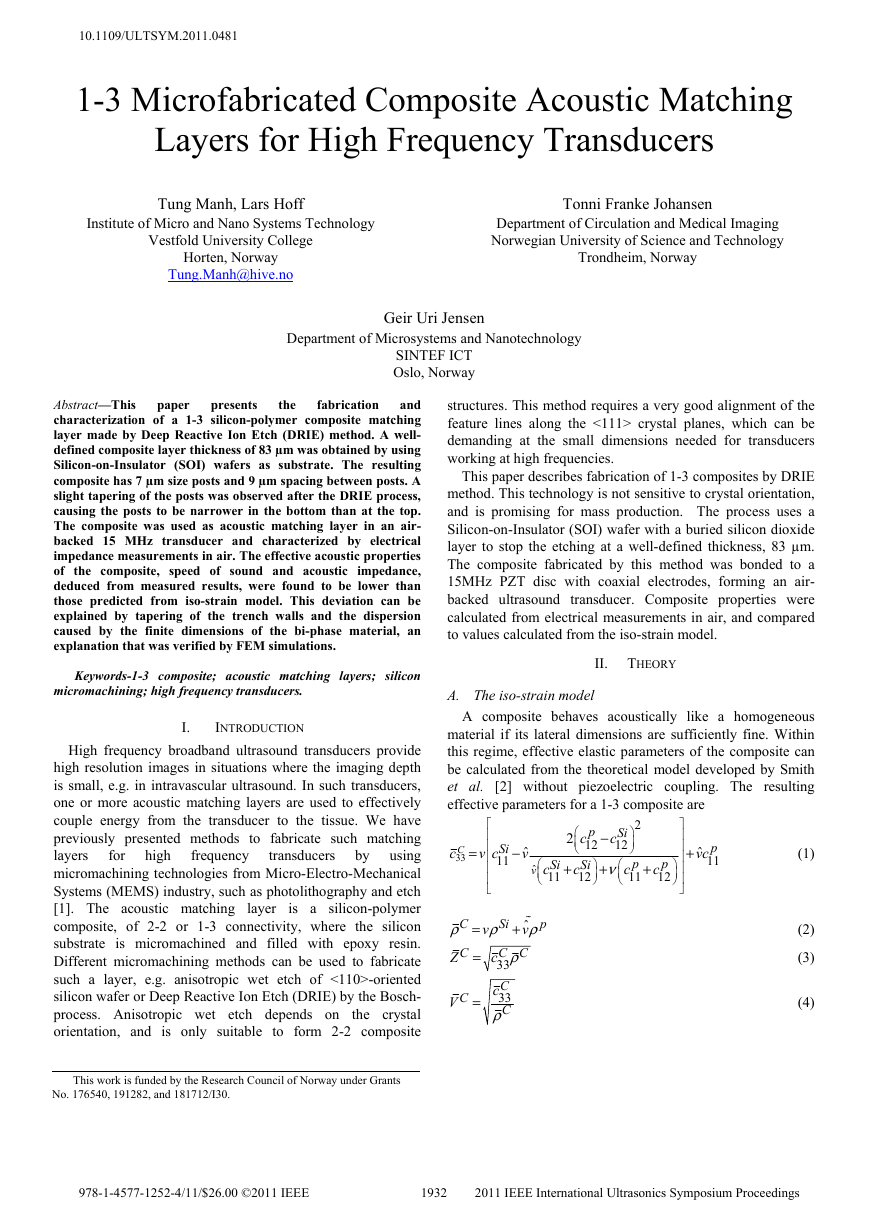
in polymer matrix is shown in Fig. 1.
The processed wafers were diced into 6mm x 6mm dies
using a Disco Abrasive Systems dicing saw
(Disco
Corporation, Japan). The top polymer and bottom silicon
layers of each sample were grinded and polished, leaving only
the composite layer. This lapping process was done using
MultiPrepTM System grinding and polishing equipment (Allied
High Tech Products Inc, USA) with a coarse to fine grit
scheme. The final lapping particle diameter was 5 µm and the
polishing chemical was a mixture of colloidal silica and 0.05
µm alumina (Allied High Tech Products Inc, USA).
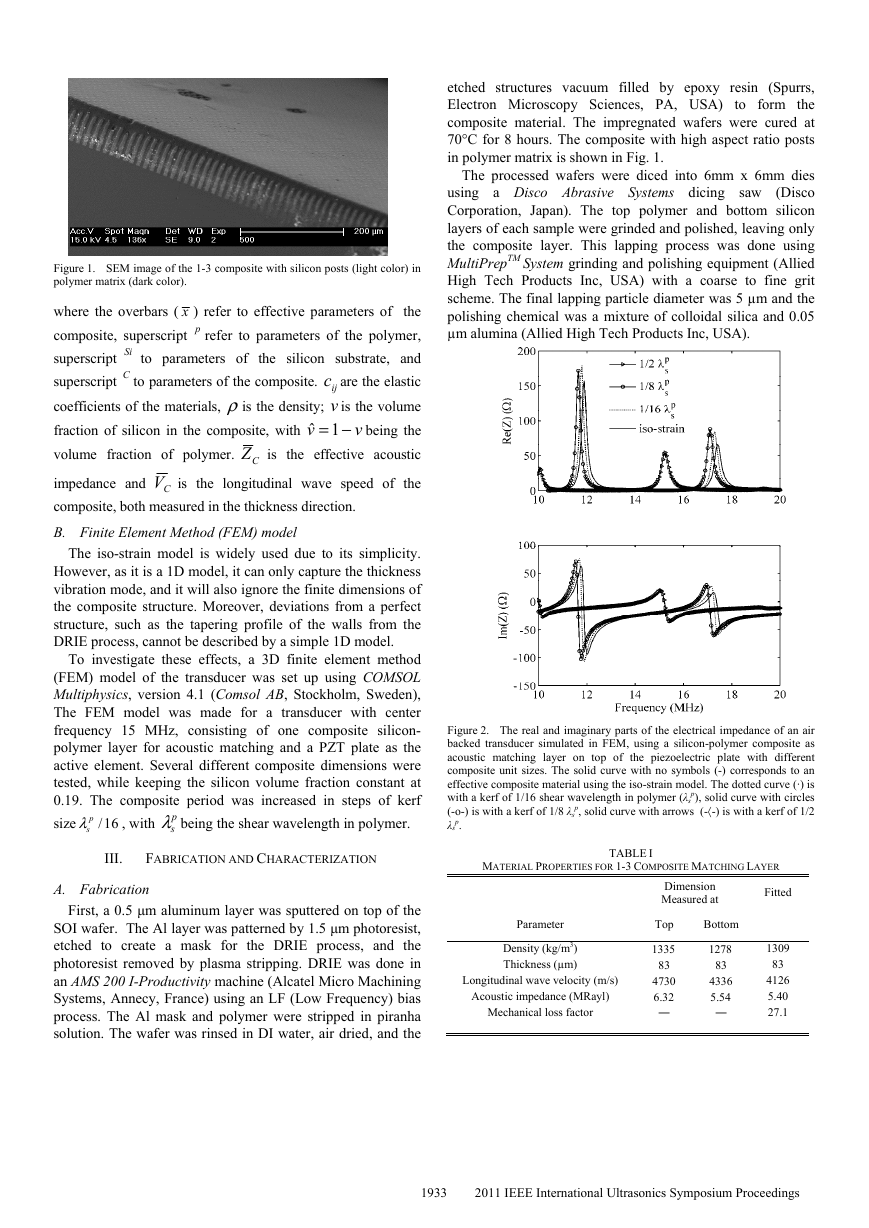
Figure 2. The real and imaginary parts of the electrical impedance of an air
backed transducer simulated in FEM, using a silicon-polymer composite as
acoustic matching layer on top of the piezoelectric plate with different
composite unit sizes. The solid curve with no symbols (-) corresponds to an
effective composite material using the iso-strain model. The dotted curve (·) is
p), solid curve with circles
with a kerf of 1/16 shear wavelength in polymer (λs
p, solid curve with arrows (-〈-) is with a kerf of 1/2
(-o-) is with a kerf of 1/8 λs
p.
λs
Figure 1. SEM image of the 1-3 composite with silicon posts (light color) in
polymer matrix (dark color).
where the overbars ( x ) refer to effective parameters of the
composite, superscript p refer to parameters of the polymer,
superscript Si
to parameters of the silicon substrate, and
ijc are the elastic
superscript C to parameters of the composite.
coefficients of the materials, ρis the density; v is the volume
fraction of silicon in the composite, with
being the
CZ is the effective acoustic
volume fraction of polymer.
CV is the longitudinal wave speed of the
impedance and
composite, both measured in the thickness direction.
B. Finite Element Method (FEM) model
−= 1ˆ
v
v
The iso-strain model is widely used due to its simplicity.
However, as it is a 1D model, it can only capture the thickness
vibration mode, and it will also ignore the finite dimensions of
the composite structure. Moreover, deviations from a perfect
structure, such as the tapering profile of the walls from the
DRIE process, cannot be described by a simple 1D model.
To investigate these effects, a 3D finite element method
(FEM) model of the transducer was set up using COMSOL
Multiphysics, version 4.1 (Comsol AB, Stockholm, Sweden),
The FEM model was made for a transducer with center
frequency 15 MHz, consisting of one composite silicon-
polymer layer for acoustic matching and a PZT plate as the
active element. Several different composite dimensions were
tested, while keeping the silicon volume fraction constant at
0.19. The composite period was increased in steps of kerf
sλ being the shear wavelength in polymer.
size
sλ , with
p
p
/16
III.
FABRICATION AND CHARACTERIZATION
MATERIAL PROPERTIES FOR 1-3 COMPOSITE MATCHING LAYER
TABLE I
A. Fabrication
First, a 0.5 μm aluminum layer was sputtered on top of the
SOI wafer. The Al layer was patterned by 1.5 μm photoresist,
etched to create a mask for the DRIE process, and the
photoresist removed by plasma stripping. DRIE was done in
an AMS 200 I-Productivity machine (Alcatel Micro Machining
Systems, Annecy, France) using an LF (Low Frequency) bias
process. The Al mask and polymer were stripped in piranha
solution. The wafer was rinsed in DI water, air dried, and the
Parameter
Density (kg/m3)
Thickness (µm)
Longitudinal wave velocity (m/s)
Acoustic impedance (MRayl)
Mechanical loss factor
Dimension
Measured at
Fitted
Top
1335
83
4730
6.32
―
Bottom
1278
83
4336
5.54
―
1309
83
4126
5.40
27.1
1933
2011 IEEE International Ultrasonics Symposium Proceedings
�
were used to find the material coefficients of the PZT in
thickness mode. Then, the composite layers were bonded to
the PZT discs, and impedance measurements on this structure
were used to extract the properties of the silicon-polymer
composite. All impedance measurements were done in air,
using an HP 8753D Network Analyzer (Agilent Technologies,
Santa Clara, CA, USA), with the PZT discs connected to the
SMA connector.
Before bonding to the piezoelectric disc, feature sizes from
the top and bottom of the composite were measured under
microscope, and initial estimates for the material parameters
were calculated using the iso-strain model. Improved values
three composite material parameters, acoustic
for
CZ , longitudinal wave speed
CV , and Q-factor
impedance
CQ , were found by fitting the measured electrical impedance
curves to calculations from the Mason model, using the iso-
strain estimates as start values. The fitting was done using a
non-linear regression scheme, the Nelder-Mead simplex
method, implemented in MATLAB (The Mathworks Inc.,
Natick, MA, USA). The thickness of the composite layers is
accurately defined by the device layer thickness in the SOI
wafer, and the PZT material parameters were known from
electrical impedance measurements on the PZT disc alone.
the
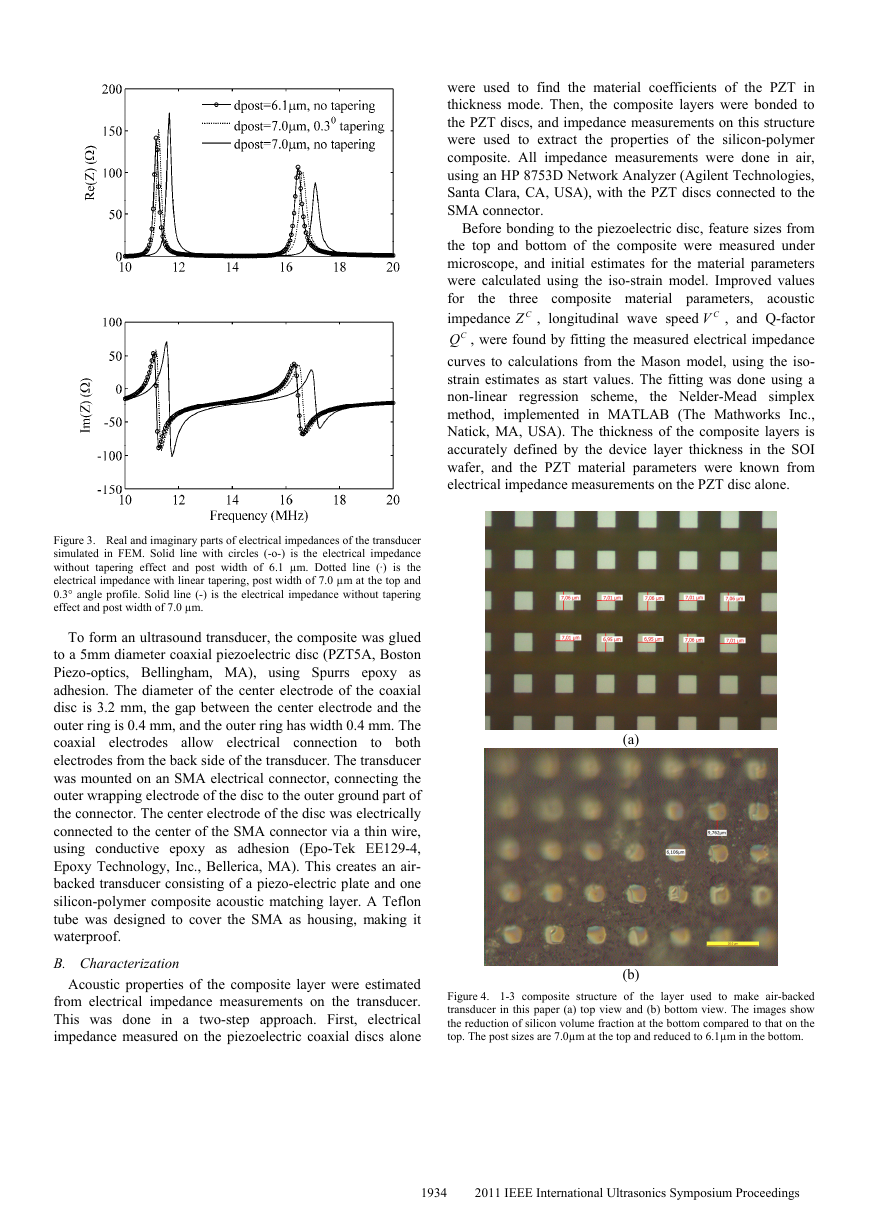
Figure 3. Real and imaginary parts of electrical impedances of the transducer
simulated in FEM. Solid line with circles (-o-) is the electrical impedance
without tapering effect and post width of 6.1 µm. Dotted line (·) is the
electrical impedance with linear tapering, post width of 7.0 µm at the top and
0.3° angle profile. Solid line (-) is the electrical impedance without tapering
effect and post width of 7.0 µm.
To form an ultrasound transducer, the composite was glued
to a 5mm diameter coaxial piezoelectric disc (PZT5A, Boston
Piezo-optics, Bellingham, MA), using Spurrs epoxy as
adhesion. The diameter of the center electrode of the coaxial
disc is 3.2 mm, the gap between the center electrode and the
outer ring is 0.4 mm, and the outer ring has width 0.4 mm. The
coaxial electrodes allow electrical connection
to both
electrodes from the back side of the transducer. The transducer
was mounted on an SMA electrical connector, connecting the
outer wrapping electrode of the disc to the outer ground part of
the connector. The center electrode of the disc was electrically
connected to the center of the SMA connector via a thin wire,
using conductive epoxy as adhesion (Epo-Tek EE129-4,
Epoxy Technology, Inc., Bellerica, MA). This creates an air-
backed transducer consisting of a piezo-electric plate and one
silicon-polymer composite acoustic matching layer. A Teflon
tube was designed to cover the SMA as housing, making it
waterproof.
B. Characterization
Acoustic properties of the composite layer were estimated
from electrical impedance measurements on the transducer.
This was done in a two-step approach. First, electrical
impedance measured on the piezoelectric coaxial discs alone
(a)
(b)
Figure 4. 1-3 composite structure of the layer used to make air-backed
transducer in this paper (a) top view and (b) bottom view. The images show
the reduction of silicon volume fraction at the bottom compared to that on the
top. The post sizes are 7.0µm at the top and reduced to 6.1µm in the bottom.
1934
2011 IEEE International Ultrasonics Symposium Proceedings
�
are reduced by about 0.9 µm compared to those at the top, see
Fig. 4(a) and 4(b). This tapering profile reduces the silicon
volume fraction. It could potentially be
improved by
optimizing the DRIE process parameters for this specific
process.
C. Electrical Impedance and Estimated Material Parameters
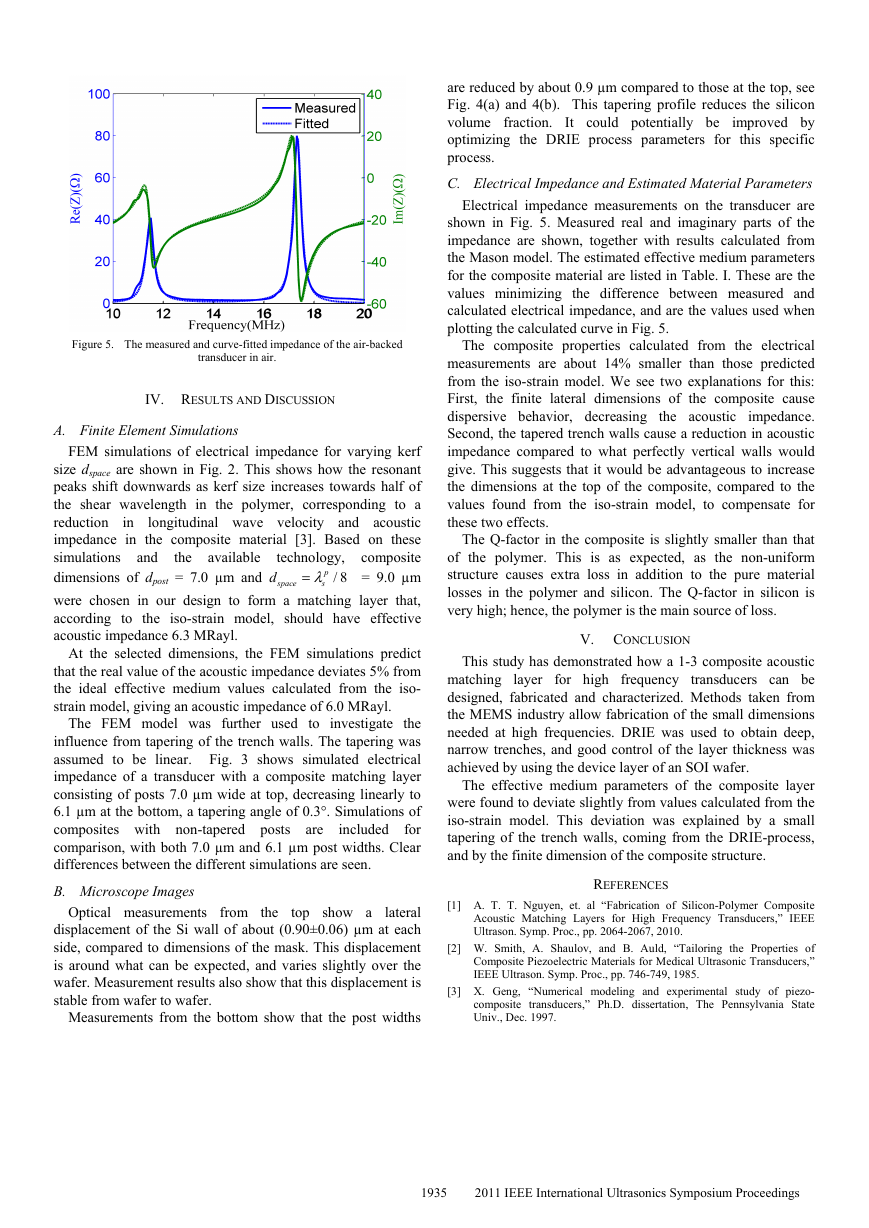
Electrical impedance measurements on the transducer are
shown in Fig. 5. Measured real and imaginary parts of the
impedance are shown, together with results calculated from
the Mason model. The estimated effective medium parameters
for the composite material are listed in Table. I. These are the
values minimizing the difference between measured and
calculated electrical impedance, and are the values used when
plotting the calculated curve in Fig. 5.
The composite properties calculated from the electrical
measurements are about 14% smaller than those predicted
from the iso-strain model. We see two explanations for this:
First, the finite lateral dimensions of the composite cause
dispersive behavior, decreasing
impedance.
Second, the tapered trench walls cause a reduction in acoustic
impedance compared to what perfectly vertical walls would
give. This suggests that it would be advantageous to increase
the dimensions at the top of the composite, compared to the
values found from the iso-strain model, to compensate for
these two effects.
the acoustic
The Q-factor in the composite is slightly smaller than that
of the polymer. This is as expected, as the non-uniform
structure causes extra loss in addition to the pure material
losses in the polymer and silicon. The Q-factor in silicon is
very high; hence, the polymer is the main source of loss.
V. CONCLUSION
layer for high frequency
This study has demonstrated how a 1-3 composite acoustic
matching
transducers can be
designed, fabricated and characterized. Methods taken from
the MEMS industry allow fabrication of the small dimensions
needed at high frequencies. DRIE was used to obtain deep,
narrow trenches, and good control of the layer thickness was
achieved by using the device layer of an SOI wafer.
The effective medium parameters of the composite layer
were found to deviate slightly from values calculated from the
iso-strain model. This deviation was explained by a small
tapering of the trench walls, coming from the DRIE-process,
and by the finite dimension of the composite structure.
REFERENCES
[1] A. T. T. Nguyen, et. al “Fabrication of Silicon-Polymer Composite
Acoustic Matching Layers for High Frequency Transducers,” IEEE
Ultrason. Symp. Proc., pp. 2064-2067, 2010.
[2] W. Smith, A. Shaulov, and B. Auld, “Tailoring the Properties of
Composite Piezoelectric Materials for Medical Ultrasonic Transducers,”
IEEE Ultrason. Symp. Proc., pp. 746-749, 1985.
[3] X. Geng, “Numerical modeling and experimental study of piezo-
composite transducers,” Ph.D. dissertation, The Pennsylvania State
Univ., Dec. 1997.
Figure 5. The measured and curve-fitted impedance of the air-backed
transducer in air.
IV. RESULTS AND DISCUSSION
A. Finite Element Simulations
d
space
in
FEM simulations of electrical impedance for varying kerf
size dspace are shown in Fig. 2. This shows how the resonant
peaks shift downwards as kerf size increases towards half of
the shear wavelength in the polymer, corresponding to a
reduction
longitudinal wave velocity and acoustic
impedance in the composite material [3]. Based on these
simulations and
technology, composite
the available
dimensions of dpost = 7.0 µm and
= 9.0 µm
were chosen in our design to form a matching layer that,
according to the iso-strain model, should have effective
acoustic impedance 6.3 MRayl.
λ=
/ 8p
s
At the selected dimensions, the FEM simulations predict
that the real value of the acoustic impedance deviates 5% from
the ideal effective medium values calculated from the iso-
strain model, giving an acoustic impedance of 6.0 MRayl.
The FEM model was further used to investigate the
influence from tapering of the trench walls. The tapering was
assumed to be linear. Fig. 3 shows simulated electrical
impedance of a transducer with a composite matching layer
consisting of posts 7.0 µm wide at top, decreasing linearly to
6.1 µm at the bottom, a tapering angle of 0.3°. Simulations of
composites with non-tapered posts are
for
comparison, with both 7.0 µm and 6.1 µm post widths. Clear
differences between the different simulations are seen.
B. Microscope Images
included
the
top show a
Optical measurements from
lateral
displacement of the Si wall of about (0.90±0.06) µm at each
side, compared to dimensions of the mask. This displacement
is around what can be expected, and varies slightly over the
wafer. Measurement results also show that this displacement is
stable from wafer to wafer.
Measurements from the bottom show that the post widths
1935
2011 IEEE International Ultrasonics Symposium Proceedings
�


 2023年江西萍乡中考道德与法治真题及答案.doc
 2012年重庆南川中考生物真题及答案.doc
 2013年江西师范大学地理学综合及文艺理论基础考研真题.doc
 2020年四川甘孜小升初语文真题及答案I卷.doc
 2020年注册岩土工程师专业基础考试真题及答案.doc
 2023-2024学年福建省厦门市九年级上学期数学月考试题及答案.doc
 2021-2022学年辽宁省沈阳市大东区九年级上学期语文期末试题及答案.doc
 2022-2023学年北京东城区初三第一学期物理期末试卷及答案.doc
 2018上半年江西教师资格初中地理学科知识与教学能力真题及答案.doc
 2012年河北国家公务员申论考试真题及答案-省级.doc
 2020-2021学年江苏省扬州市江都区邵樊片九年级上学期数学第一次质量检测试题及答案.doc
 2022下半年黑龙江教师资格证中学综合素质真题及答案.doc