Cartographic Perspectives
Journal of the
North American Cartographic
Information Society
sPeCi a l m o u n t a i n Ca r t o g r aPh y i s s u e
Number 67, Winter 2010
�
Cartographic Perspectives
Journal of the
North American Cartographic
Information Society
sPeCi a l m o u n t a i n Ca r t o g r aPh y i s s u e
Number 67, Winter 2010
I n t hIs I s s u e
L E T T E R F R O M T H E G uEsT E D I T O Rs
Bernhard Jenny and Tom Patterson
F E ATuR E D A R T I C L Es
Mountain Ski Maps of North America: A Preliminary Survey and Analysis of Style
Alex Tait
Accidental cARTographer
Tibor Tóth
Mapping Glacier Bay National Park, Alaska
Tom Patterson
Design and Production of the Himachal Pradesh Topographic Overview Map, 1:500,000
David Schobesberger, Karel Kriz, Markus Breier
Terrain Sculptor: Generalizing Terrain Models for Relief Shading
Anna M. Leonowicz, Bernhard Jenny, Lorenz Hurni
Visual Fields
Elbie Bentley
Practical Cartographer’s Corner
Alex Tait
Book Reviews
Various Reviewers
Instructions to Authors
3
5
19
29
43
51
61
63
75
83
Cartographic Perspectives, Number 67, Winter 2010
1
�
Cartographic Perspectives
Journal of the
North American Cartographic
Information Society
© 2 0 1 0 N A C I S
I S S N 1 0 4 8 - 9 0 8 5
w w w. n a c i s . o r g
ED I T O R
Fritz Kessler
Department of Geography
Frostburg State University
230 Gunter Hall
101 Braddock Blvd
Frostburg, MD 21532
(301) 687-4266
(301) 687-4495 fax
fkessler@frostburg.edu
G u e s t edIt o rs
G uEsT ED I T O R
Bernhard Jenny
Institute of Cartography
ETH Zurich
jenny@karto.baug.ethz.ch
CO P Y ED I T O R
Mary Spalding
Potomac State College of
West Virginia University
G uEsT ED I T O R
Tom Patterson
US National Park Service
Harpers Ferry, WV, USA
tom_patterson@nps.gov
MA N A G I N G G uEsT ED I T O R
Tanya MA Buckingham
UW-Madison Cartography Lab
tbuckingham@uwisc.edu
C O P Y R I G H T N O T I C E
Unless otherwise noted, NACIS holds the
copyrights to all items published in each
issue. The opinions expressed are those
of the author(s), and not necessarily the
opinion of NACIS.
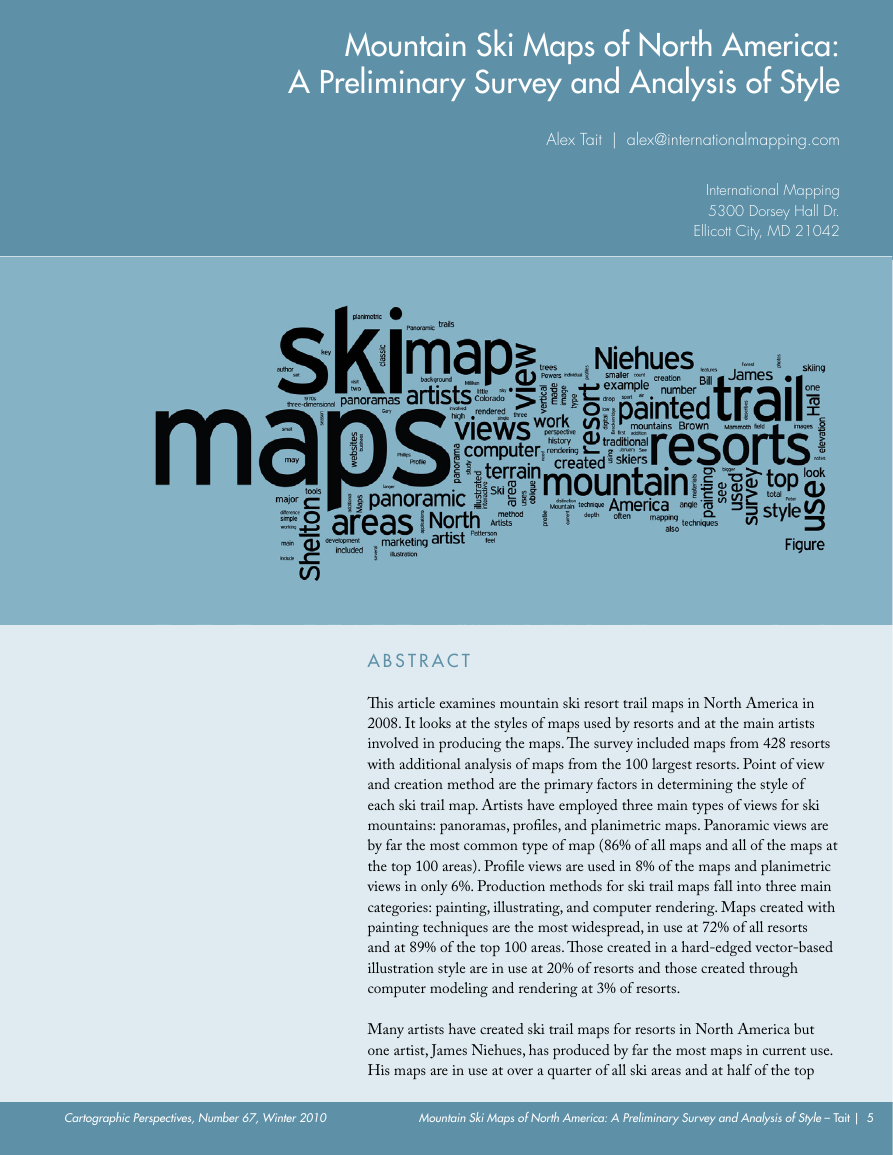
W O R D C L OuD A BsT R A C Ts
The wordclouds featured in the
abstracts were produced using Wordle
(http://www.wordle.net/). Complete
text from each article was included.
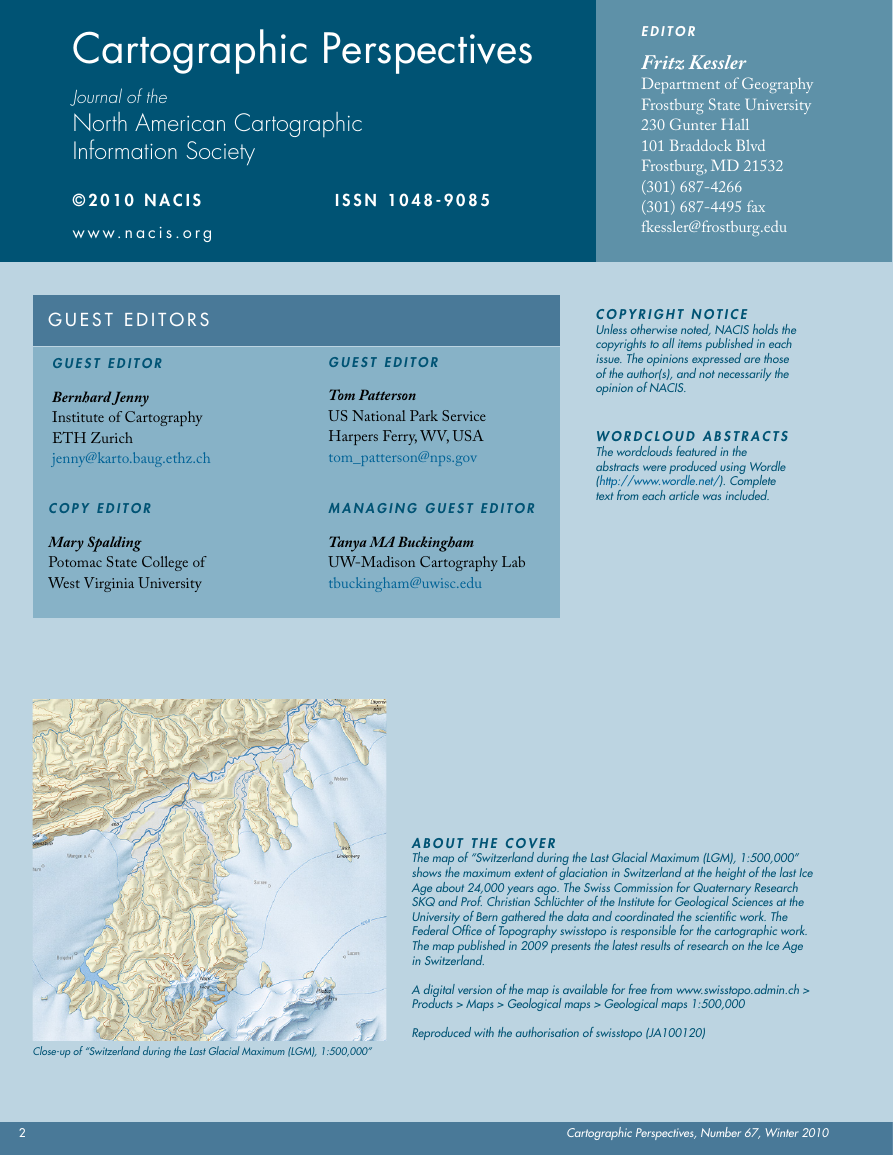
A B OuT T H E C O V E R
The map of “Switzerland during the Last Glacial Maximum (LGM), 1:500,000”
shows the maximum extent of glaciation in Switzerland at the height of the last Ice
Age about 24,000 years ago. The Swiss Commission for Quaternary Research
SKQ and Prof. Christian Schlüchter of the Institute for Geological Sciences at the
University of Bern gathered the data and coordinated the scientific work. The
Federal Office of Topography swisstopo is responsible for the cartographic work.
The map published in 2009 presents the latest results of research on the Ice Age
in Switzerland.
A digital version of the map is available for free from www.swisstopo.admin.ch >
Products > Maps > Geological maps > Geological maps 1:500,000
Reproduced with the authorisation of swisstopo (JA100120)
Close-up of “Switzerland during the Last Glacial Maximum (LGM), 1:500,000”
2
Cartographic Perspectives, Number 67, Winter 2010
�
L e t t e r Fr oM t h e Gu e s t edIt o rs
This special mountain cartography issue of Cartographic Perspectives features papers
by members of the Commission on Mountain Cartography, a special interest group
of the International Cartographic Association (ICA). The commission focuses on
a range of issues related to the mapping of mountains—peaks, cliffs, scree, glaciers,
and various other types of rough terrain. Mapping such extreme places presents
challenges. For example, standard mapping techniques often do not apply, and
collecting good geospatial data of high mountains is an ongoing challenge despite
technology advances. There also is a cultural aspect to mountain mapping. Many
mountain dwellers live under the threat of gravity-induced natural hazards, from
avalanches to mudslides to damn bursts, which maps can help them better understand
and deal with. But mountains have also long been a source of inspiration for those
who visit and map them alike, prompting cartographic innovation. The well-known
maps of Heinrich Berann, Richard Edes Harrison, Eduard Imhof, Hal Shelton, and
Bradford Washburn highlight just some of the contributions by those engaged in
mountain cartography to the profession as a whole. Most papers that follow are a
sampling of those presented at the 2008 Mountain Cartography workshop at Lenk,
Switzerland.
Since its founding in 1999, the Commission on Mountain Cartography has held
biannual workshops at various mountain venues. To date these have included the
Austrian Alps (2000), Mount Hood in the USA (2002), the Spanish Pyrenees
(2004), the Julian Alps of Slovenia (2006), the Swiss Alps (2008), and the Carpathian
Mountains of Romania (2010). The workshops have attracted an increasing number
of presenters, reaching almost 60 participants at the last two workshops in 2008 and
2010. In addition to the formal program, the relaxed atmosphere of the workshops
is conducive for catching up with old friends and making new ones. A workshop
tradition is to devote the last day to outdoor activities for a range of interests
and abilities, from ski touring to curling, or hiking, depending on the season. The
workshops typically occur over three days in either late February or early September.
The workshop participants represent diverse backgrounds and interests, but share a
common passion for mountain mapping. The presentations take many forms. These
include longer academic papers, Pecha Kucha-style short presentations, software
demonstrations, panel discussions, and posters. The presentation topics generally fall
Cartographic Perspectives, Number 67, Winter 2010
3
�
into four thematic groups. In the first group are techniques, software, and ideas about
2D or 3D relief mapping, which are topics of recurring interest. This includes the
related pursuits of contouring, relief shading, rock drawing, and vegetation mapping.
The second group covers the monitoring of mountain environments and thematic
mapping. The survey and visualization of glacier movements, and the mapping of
avalanches and other mountain hazards are common topics in this category. The
third group focuses on information systems and digital maps of mountain areas used
by tourists and outdoor recreation enthusiasts. And, the fourth group concentrates
on historical mountain mapping, looking at the activities of cartographers and
expeditions from the past and their rich contributions to our profession. However,
many of the workshop presentations are on alternative and innovative topics that do
not fit into these neat groups.
This special issue contains three papers from North American and two papers from
European authors. The first paper by Alex Tait (International Mapping, USA)
examines maps of alpine ski resorts in North America. He compares the graphical
styles of trail maps of more than 400 resorts, and traces the history of past and
present artists, such as James Niehues, Hal Shelton and Bill Brown. The paper by
Tibor Tóth (Tóth Graphix, USA) looks back on his forty-year career as a relief
artist, much of it spent at the National Geographic Society. He discusses the manual
development of relief art created by pencil, airbrush, and acrylic painting, and ends
with digital relief shading. Tom Patterson (US National Park Service) discusses the
making of a National Park Service map of Glacier Bay. He describes the various
steps leading to a brochure map of this wilderness park visited mostly by cruise ship
passengers. The paper examines various mountain-mapping challenges, including
shaded relief, land cover, glaciers, fjord bathymetry, braided rivers, and place names.
David Schobesberger and his coauthors (University of Vienna, Austria) describe the
design of a map of mountainous Himachal Pradesh, India. The aim of this map is to
support an interdisciplinary research network focusing on the cultural history of the
western Himalayas. Schobesberger’s paper describes data compilation from a variety
of mostly suboptimal sources, starting with maps originally surveyed by the colonial
British and ending with satellite imagery. The main author of the last paper is Anna
Leonowicz (University of Zurich, Switzerland). Her paper discusses Terrain Sculptor,
a new freeware application that prepares generalized terrain models for relief shading.
For additional mountain cartography readings and to learn more about the ICA
Commission on Mountain Cartography, visit http://mountaincartography.org/. The
website offers the proceedings of past workshops, the commission’s terms of reference,
a list of commission members, and information about the next scheduled workshop.
We would welcome your participation.
Bernhard Jenny
Institute of Cartography
ETH Zurich
and
Tom Patterson
US National Park Service
Harpers Ferry, WV, USA
4
Cartographic Perspectives, Number 67, Winter 2010
�
Mountain ski Maps of North America:
A Preliminary survey and Analysis of style
Alex Tait | alex@internationalmapping.com
International Mapping
5300 Dorsey Hall Dr.
Ellicott City, MD 21042
A b sTrAcT
This article examines mountain ski resort trail maps in North America in
2008. It looks at the styles of maps used by resorts and at the main artists
involved in producing the maps. The survey included maps from 428 resorts
with additional analysis of maps from the 100 largest resorts. Point of view
and creation method are the primary factors in determining the style of
each ski trail map. Artists have employed three main types of views for ski
mountains: panoramas, profiles, and planimetric maps. Panoramic views are
by far the most common type of map (86% of all maps and all of the maps at
the top 100 areas). Profile views are used in 8% of the maps and planimetric
views in only 6%. Production methods for ski trail maps fall into three main
categories: painting, illustrating, and computer rendering. Maps created with
painting techniques are the most widespread, in use at 72% of all resorts
and at 89% of the top 100 areas. Those created in a hard-edged vector-based
illustration style are in use at 20% of resorts and those created through
computer modeling and rendering at 3% of resorts.
Many artists have created ski trail maps for resorts in North America but
one artist, James Niehues, has produced by far the most maps in current use.
His maps are in use at over a quarter of all ski areas and at half of the top
Cartographic Perspectives, Number 67, Winter 2010
Mountain Ski Maps of North America: A Preliminary Survey and Analysis of Style – Tait | 5
�
100 resorts. Niehues follows in the footsteps of two other Coloradans, Hal Shelton
and then Bill Brown, and this Colorado School has been key in the development of
a classic painted panoramic style of North American ski maps. Additional research
is recommended to provide further details of the history of the maps and their
creators as well as to analyze the artists’ terrain manipulations and to look at the
growing use of electronic trail maps.
K e y w o r d s
Ski maps, 3D-maps, panoramas, North America, map design, Hal Shelton, James
Niehues
MA P PiNg s Ki M o uN TAiNs iN N o r
Th AMe r i cA
Trails maps for ski areas are iconic images of the nature of the sport of skiing and
its relation to the terrain on which ski resorts are built. Canada and the United
States have well over 400 ski areas that are large enough to merit a trail map. The
development of the maps has paralleled the development of the sport of lift-served
skiing. As skiing in North America has grown and more money has flowed to
building bigger resorts and marketing the resorts to skiers, more attention has been
paid to marketing materials (Fry, 2006). The combination of bigger areas to map
and an increase in money in the sport led to a shift from simple wayfinding maps
to more elaborate mountain portrayals.
This study looks at the total number of ski maps in use during the 2007-2008
winter ski season and categorizes them by angle of view, method of creation, size,
and artist, if known. An evaluation of these factors is provided in the context of
how they affect the style of the ski map. In addition, an examination of the artists
involved in the maps’ creation yields information about the history of mapping ski
resorts.
S u r v e y o f S k i M a pS i n C u r r e n t u Se
A mountain ski map as defined for this paper is a map of the trails and ski facilities
of a lift-served ski area. Maps are included for any ski area that has a vertical drop
(top to bottom elevation change) of at least 200 feet (60 meters). In addition,
due to the limit on time and expenses for gathering materials, the study includes
only ski areas and resorts with established websites, indicating that they are both
currently operating and that they are marketing to the public to entice skiers.
The resulting survey of ski maps does not include very small areas—because of
the vertical minimum—and it does not include some of the smaller private and
non-commerical ski areas that do not have websites or advertise in the manner of a
commercial ski resort. Many of these areas have trail maps but are outside the main
ski area focus of the industry and of this paper. Most resorts have additional maps
in their marketing materials and on their websites that display Nordic or cross-
country skiing trails, base lodge areas, resort towns, and lodging. These maps are
not included in this study.
The develoPMeNT
of The MAPs hAs
PArAlleled The
develoPMeNT of
The sPorT of
lifT-served sKiiNg.
6 | Mountain Ski Maps of North America: A Preliminary Survey and Analysis of Style – Tait
Cartographic Perspectives, Number 67, Winter 2010
�
PAiNTed PANorAMic
views hAve A
sTroNg TrAdiTioN
iN sKi MAPPiNg iN
NorTh AMericA
ANd Much of This
doMiNANce iN The
curreNT survey cAN
be ATTribuTed To jusT
A few ArTisTs.
The survey was conducted during January 2008 by searching the Internet for
ski resorts and then for ski maps used by each resort during the 2007-2008 ski
season. Compiled lists of resorts data were accessed at www.skitown.com and
www.skireport.com. Each ski map was obtained directly from the individual
ski resort website. A visit to the individual websites confirmed that each resort
was currently operating and allowed viewing of the trail maps provided by the
resort. In cases of a resort with multiple trail maps, for example different maps
for print and on-line use, the map designated for print and on-slope use was
used. An electronic file was available for 428 out of 429 resorts researched (the
only exception was Apple Mountain in Michigan, not included as part of the
survey).
For each trail map the following information was catalogued: view type,
creation method, artist, existence and type of interactive web map, and size of
resort (vertical drop, number of lifts, number of slopes). In addition, subjective
style notes were made to assist in categorizing maps and assigning authorship.
View type describes the general nature of the view of the mountain, i.e. the
location and orientation of the cartographer’s (or photographer’s) point of view
in relation to the terrain. Creation method describes the technique used to
construct the final image.
In order to isolate some of the more important trends in the creation of ski
maps, a distinction was made between major resorts and minor resorts. The
major resorts are the top 100 ski areas as defined by a size index calculated
by multiplying the vertical drop (top to bottom elevation difference) by the
number of lifts and then by the number of trails. The use of vertical drop in
the index aided in putting the larger mountains (in terms of terrain covered)
toward the top of the list. Many of the smaller mountains did not make it into
the top 100 resorts.
The initial results of the survey are summarized in Table 1. Some immediate
trends emerge, such as the preponderance of ski maps using the panoramic
view. Indeed for the major resorts it is the only type of view used. Also, the
painted technique—originally using traditional art tools and now often using
computer painting applications—is the dominant method used to create the
trail maps. Painted panoramic views have a strong tradition in ski mapping
in North America and much of this dominance in the current survey can be
attributed to just a few artists.
All Ski Resorts
View type
panoramic
profile
planimetric
Total
Table 1. Survey of North American mountain
ski maps, counts, and percentages
by view type and creation method.
Creation method
painted
illustrated
annotated photo
computer rendered
Total
368
36
24
423
307
85
24
12
428
%
86%
8%
6%
100%*
72%
20%
6%
3%
100%*
Top 100 Ski Resorts
100
0
0
100
89
7
1
3
100
*All percentages have been rounded
Cartographic Perspectives, Number 67, Winter 2010
Mountain Ski Maps of North America: A Preliminary Survey and Analysis of Style – Tait | 7
�



 2023年江西萍乡中考道德与法治真题及答案.doc
 2012年重庆南川中考生物真题及答案.doc
 2013年江西师范大学地理学综合及文艺理论基础考研真题.doc
 2020年四川甘孜小升初语文真题及答案I卷.doc
 2020年注册岩土工程师专业基础考试真题及答案.doc
 2023-2024学年福建省厦门市九年级上学期数学月考试题及答案.doc
 2021-2022学年辽宁省沈阳市大东区九年级上学期语文期末试题及答案.doc
 2022-2023学年北京东城区初三第一学期物理期末试卷及答案.doc
 2018上半年江西教师资格初中地理学科知识与教学能力真题及答案.doc
 2012年河北国家公务员申论考试真题及答案-省级.doc
 2020-2021学年江苏省扬州市江都区邵樊片九年级上学期数学第一次质量检测试题及答案.doc
 2022下半年黑龙江教师资格证中学综合素质真题及答案.doc