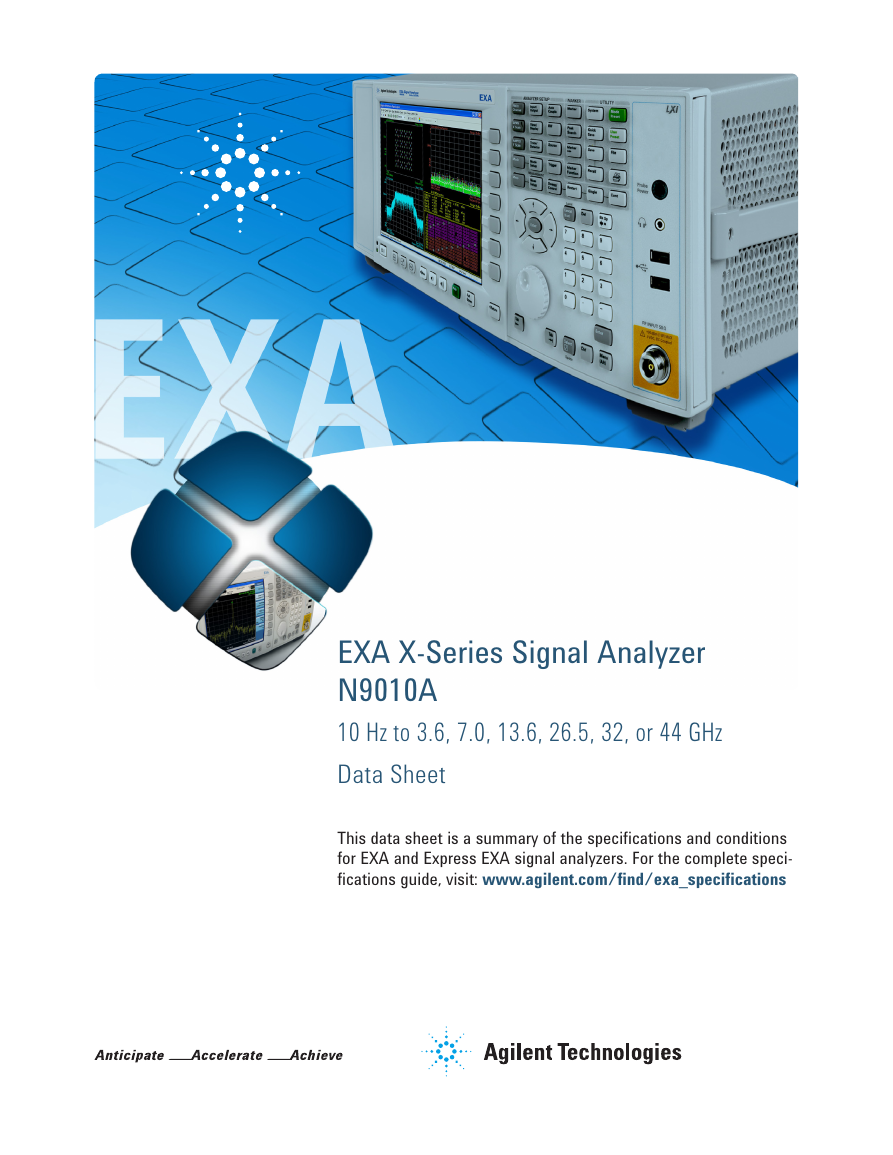
EXA X-Series Signal Analyzer
N9010A
10 Hz to 3.6, 7.0, 13.6, 26.5, 32, or 44 GHz
Data Sheet
This data sheet is a summary of the specifications and conditions
for EXA and Express EXA signal analyzers. For the complete speci-
fications guide, visit: www.agilent.com/find/exa_specifications
�
Table of Contents
Definitions and Conditions .......................................................................................................3
Frequency and Time Specifications........................................................................................4
Amplitude Accuracy and Range Specifications ..................................................................6
Dynamic Range Specifications ................................................................................................9
PowerSuite Measurement Specifications ..........................................................................15
General Specifications .............................................................................................................16
Inputs and Outputs ...................................................................................................................17
I/Q Analyzer ...............................................................................................................................19
Related Literature .....................................................................................................................21
Balance the Challenges
Whether you’re focused on time-
to-market, time-to-volume, or cost
of test, your choice of
economyclass signal analyzer
should help you save both time
and money. That’s the idea that
drives the Agilent EXA signal
analyzer—and it’s the fastest
way to maximize throughput
on the production line. From
measurement speed to code
compatibility, it makes every
millisecond count and helps
reduce your overall cost of test.
2
�
Get More Information
This EXA signal analyzer data
sheet is a summary of the
specifications and conditions
for N9010A EXA and N9010AEP
Express EXA signal analyzers,
which are available in the EXA
Signal Analyzer Specification
Guide (N9010-90025).
For ordering information, refer
to the EXA Signal Analyzer
Configuration Guide
(5989-6531EN).
Definitions and Conditions
Specifications describe the performance of parameters covered by the product
warranty and apply to the full temperature of 0 to 55 °C 1, unless otherwise
noted.
95th percentile values indicate the breadth of the population (approx. 2 σ) of perfor-
mance tolerances expected to be met in 95 percent of the cases with a 95 percent
confidence, for any ambient temperature in the range of 20 to 30 °C. In addition to
the statistical observations of a sample of instruments, these values include the
effects of the uncertainties of external calibration references. These values are not
warranted. These values are updated occasionally if a significant change in the
statistically observed behavior of production instruments is observed.
Typical describes additional product performance information that is not covered by
the product warranty. It is performance beyond specifications that 80 percent of the
units exhibit with a 95 percent confidence level over the temperature range 20 to
30 °C. Typical performance does not include measurement uncertainty.
Nominal values indicate expected performance, or describe product performance
that is useful in the application of the product, but are not covered by the product
warranty.
The analyzer will meet its specifications when:
• It is within its calibration cycle
• Under auto couple control, except when Auto Sweep Time Rules = Accy
• Signal frequencies < 10 MHz, with DC coupling applied
• The analyzer has been stored at an ambient temperature within the allowed
operating range for at least two hours before being turned on; if it had previously
been stored at a temperature range inside the allowed storage range, but outside
the allowed operating range
• The analyzer has been turned on at least 30 minutes with Auto Align set to
normal, or, if Auto Align is set to off or partial, alignments must have been run
recently enough to prevent an Alert message; if the Alert condition is changed
from Time and Temperature to one of the disabled duration choices, the analyzer
may fail to meet specifications without informing the user
For the complete specifications guide, visit:
www.agilent.com/find/exa_specifications
1. For earlier instruments (Serial number prefix < MY/SG/US5052), the full temperature ranges
from 5 to 50 °C.
3
�
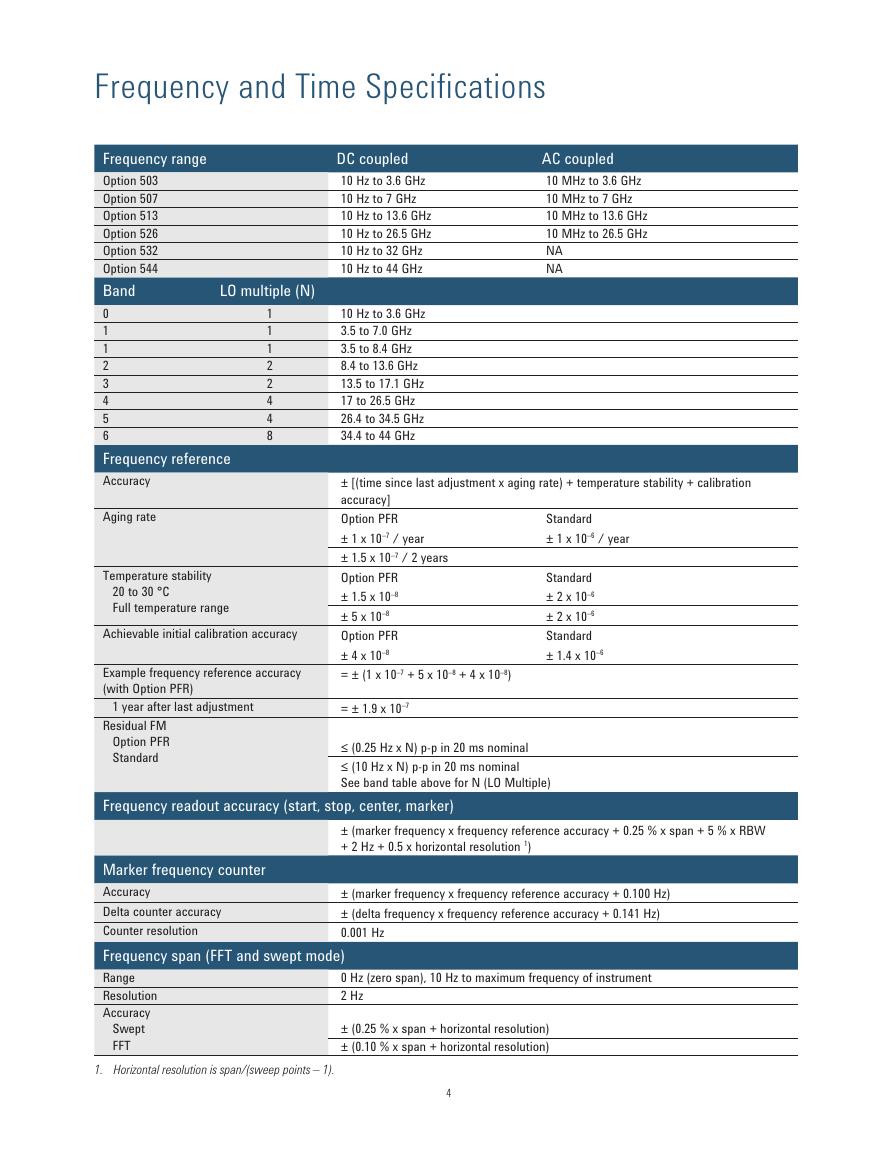
Frequency and Time Specifications
Frequency range
Option 503
Option 507
Option 513
Option 526
Option 532
Option 544
Band
0
1
1
2
3
4
5
6
Frequency reference
Accuracy
LO multiple (N)
1
1
1
2
2
4
4
8
Aging rate
Temperature stability
20 to 30 °C
Full temperature range
Achievable initial calibration accuracy
Example frequency reference accuracy
(with Option PFR)
1 year after last adjustment
Residual FM
Option PFR
Standard
AC coupled
10 MHz to 3.6 GHz
10 MHz to 7 GHz
10 MHz to 13.6 GHz
10 MHz to 26.5 GHz
NA
NA
DC coupled
10 Hz to 3.6 GHz
10 Hz to 7 GHz
10 Hz to 13.6 GHz
10 Hz to 26.5 GHz
10 Hz to 32 GHz
10 Hz to 44 GHz
10 Hz to 3.6 GHz
3.5 to 7.0 GHz
3.5 to 8.4 GHz
8.4 to 13.6 GHz
13.5 to 17.1 GHz
17 to 26.5 GHz
26.4 to 34.5 GHz
34.4 to 44 GHz
Standard
± 1 x 10⁻⁶ / year
± [(time since last adjustment x aging rate) + temperature stability + calibration
accuracy]
Option PFR
± 1 x 10⁻⁷ / year
± 1.5 x 10⁻⁷ / 2 years
Option PFR
± 1.5 x 10⁻⁸
± 5 x 10⁻⁸
Option PFR
± 4 x 10–8
= ± (1 x 10⁻⁷ + 5 x 10⁻⁸ + 4 x 10⁻⁸)
Standard
± 2 x 10⁻⁶
± 2 x 10⁻⁶
Standard
± 1.4 x 10–6
= ± 1.9 x 10⁻⁷
≤ (0.25 Hz x N) p-p in 20 ms nominal
≤ (10 Hz x N) p-p in 20 ms nominal
See band table above for N (LO Multiple)
Frequency readout accuracy (start, stop, center, marker)
± (marker frequency x frequency reference accuracy + 0.25 % x span + 5 % x RBW
+ 2 Hz + 0.5 x horizontal resolution 1)
Marker frequency counter
Accuracy
Delta counter accuracy
Counter resolution
Frequency span (FFT and swept mode)
Range
Resolution
Accuracy
Swept
FFT
1. Horizontal resolution is span/(sweep points – 1).
± (marker frequency x frequency reference accuracy + 0.100 Hz)
± (delta frequency x frequency reference accuracy + 0.141 Hz)
0.001 Hz
0 Hz (zero span), 10 Hz to maximum frequency of instrument
2 Hz
± (0.25 % x span + horizontal resolution)
± (0.10 % x span + horizontal resolution)
4
�
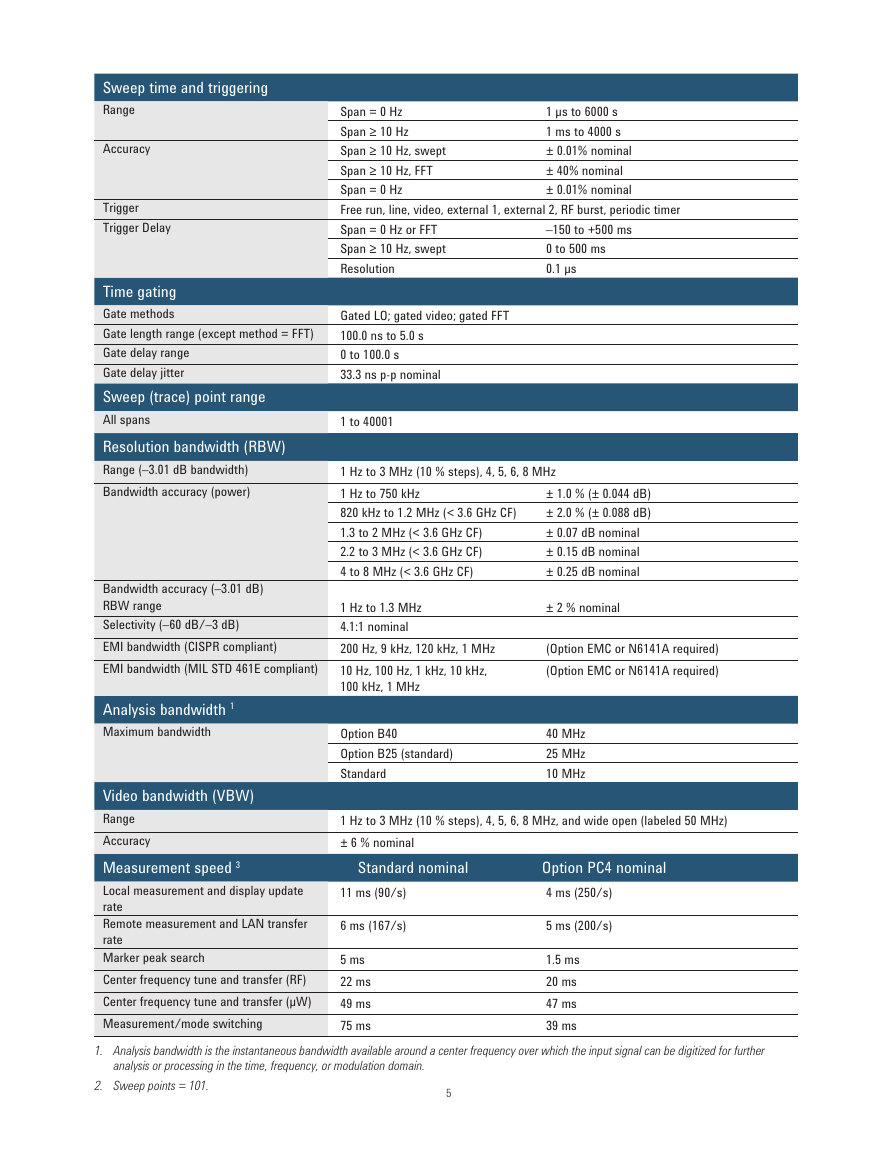
Sweep time and triggering
Range
Accuracy
Trigger
Trigger Delay
Time gating
Gate methods
Gate length range (except method = FFT)
Gate delay range
Gate delay jitter
Sweep (trace) point range
All spans
Resolution bandwidth (RBW)
Range (–3.01 dB bandwidth)
Bandwidth accuracy (power)
Bandwidth accuracy (–3.01 dB)
RBW range
Selectivity (–60 dB/–3 dB)
EMI bandwidth (CISPR compliant)
EMI bandwidth (MIL STD 461E compliant)
Analysis bandwidth 1
Maximum bandwidth
1 μs to 6000 s
1 ms to 4000 s
± 0.01% nominal
± 40% nominal
± 0.01% nominal
Span = 0 Hz
Span ≥ 10 Hz
Span ≥ 10 Hz, swept
Span ≥ 10 Hz, FFT
Span = 0 Hz
Free run, line, video, external 1, external 2, RF burst, periodic timer
Span = 0 Hz or FFT
Span ≥ 10 Hz, swept
Resolution
–150 to +500 ms
0 to 500 ms
0.1 μs
Gated LO; gated video; gated FFT
100.0 ns to 5.0 s
0 to 100.0 s
33.3 ns p-p nominal
1 to 40001
1 Hz to 3 MHz (10 % steps), 4, 5, 6, 8 MHz
1 Hz to 750 kHz
820 kHz to 1.2 MHz (< 3.6 GHz CF)
1.3 to 2 MHz (< 3.6 GHz CF)
2.2 to 3 MHz (< 3.6 GHz CF)
4 to 8 MHz (< 3.6 GHz CF)
± 1.0 % (± 0.044 dB)
± 2.0 % (± 0.088 dB)
± 0.07 dB nominal
± 0.15 dB nominal
± 0.25 dB nominal
1 Hz to 1.3 MHz
4.1:1 nominal
200 Hz, 9 kHz, 120 kHz, 1 MHz
10 Hz, 100 Hz, 1 kHz, 10 kHz,
100 kHz, 1 MHz
± 2 % nominal
(Option EMC or N6141A required)
(Option EMC or N6141A required)
Option B40
Option B25 (standard)
Standard
40 MHz
25 MHz
10 MHz
Standard nominal
1 Hz to 3 MHz (10 % steps), 4, 5, 6, 8 MHz, and wide open (labeled 50 MHz)
± 6 % nominal
Video bandwidth (VBW)
Range
Accuracy
Measurement speed 3
Local measurement and display update
rate
Remote measurement and LAN transfer
rate
Marker peak search
Center frequency tune and transfer (RF)
Center frequency tune and transfer (μW)
Measurement/mode switching
1. Analysis bandwidth is the instantaneous bandwidth available around a center frequency over which the input signal can be digitized for further
Option PC4 nominal
4 ms (250/s)
1.5 ms
20 ms
47 ms
39 ms
11 ms (90/s)
6 ms (167/s)
analysis or processing in the time, frequency, or modulation domain.
2. Sweep points = 101.
5
5 ms (200/s)
5 ms
22 ms
49 ms
75 ms
�
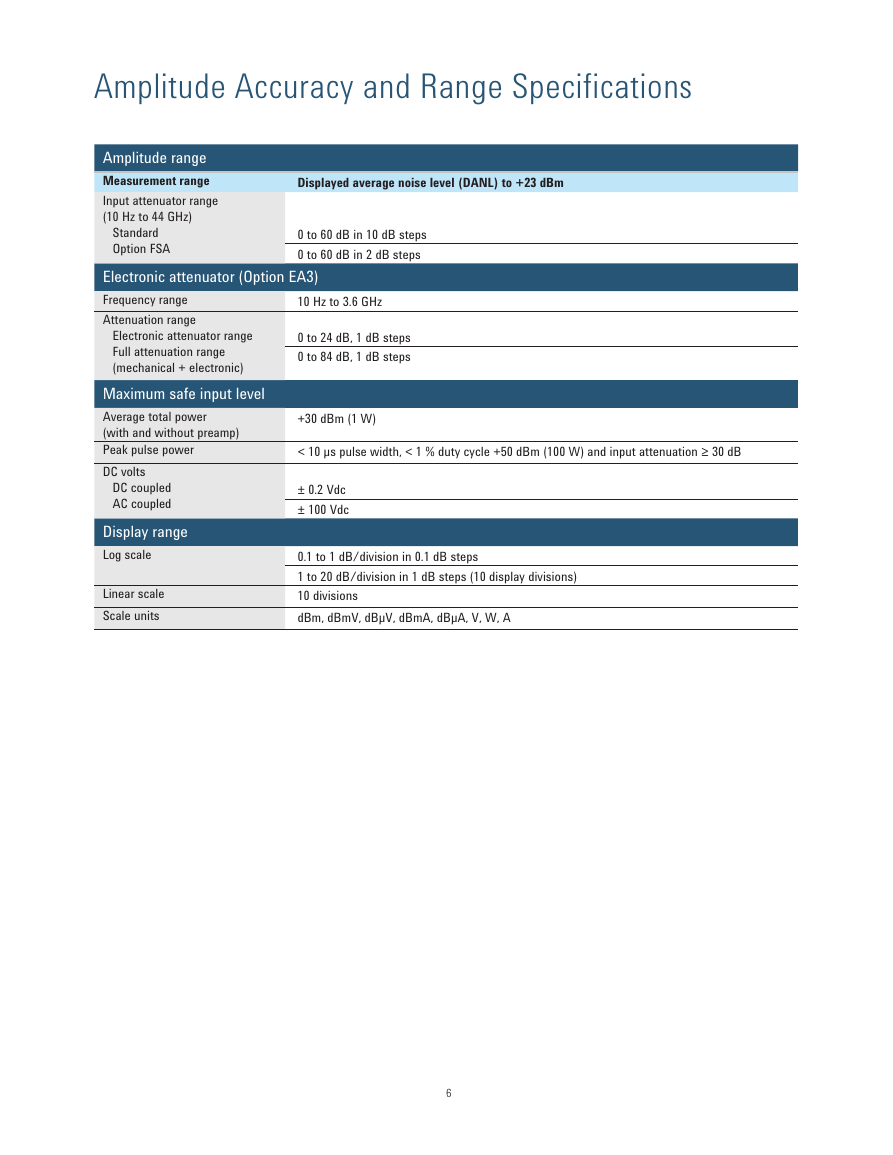
Amplitude Accuracy and Range Specifications
Displayed average noise level (DANL) to +23 dBm
0 to 60 dB in 10 dB steps
0 to 60 dB in 2 dB steps
10 Hz to 3.6 GHz
0 to 24 dB, 1 dB steps
0 to 84 dB, 1 dB steps
+30 dBm (1 W)
Amplitude range
Measurement range
Input attenuator range
(10 Hz to 44 GHz)
Standard
Option FSA
Electronic attenuator (Option EA3)
Frequency range
Attenuation range
Electronic attenuator range
Full attenuation range
(mechanical + electronic)
Maximum safe input level
Average total power
(with and without preamp)
Peak pulse power
DC volts
DC coupled
AC coupled
Display range
Log scale
Linear scale
Scale units
< 10 μs pulse width, < 1 % duty cycle +50 dBm (100 W) and input attenuation ≥ 30 dB
± 0.2 Vdc
± 100 Vdc
0.1 to 1 dB/division in 0.1 dB steps
1 to 20 dB/division in 1 dB steps (10 display divisions)
10 divisions
dBm, dBmV, dBμV, dBmA, dBμA, V, W, A
6
�
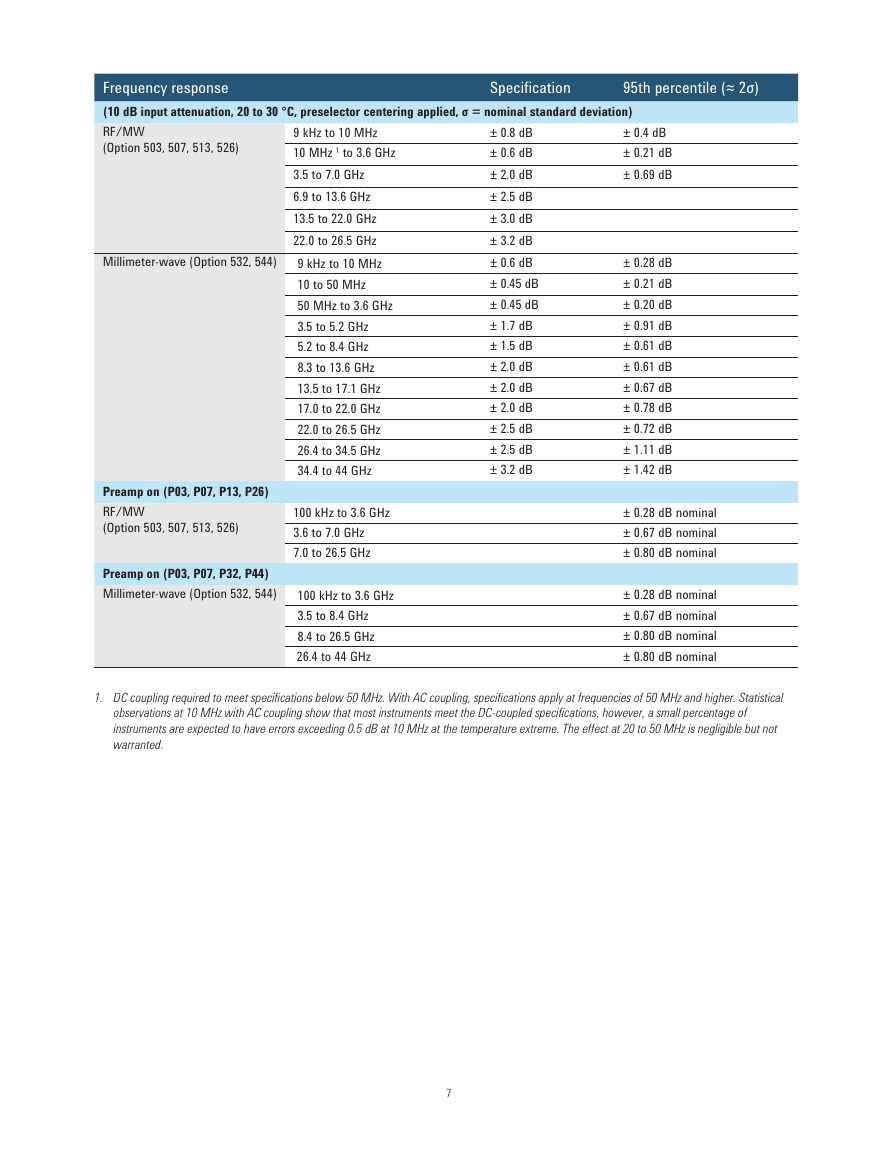
Frequency response
(10 dB input attenuation, 20 to 30 °C, preselector centering applied, σ = nominal standard deviation)
RF/MW
(Option 503, 507, 513, 526)
Specification
95th percentile (≈ 2σ)
± 0.4 dB
± 0.21 dB
± 0.69 dB
9 kHz to 10 MHz
10 MHz 1 to 3.6 GHz
3.5 to 7.0 GHz
6.9 to 13.6 GHz
13.5 to 22.0 GHz
22.0 to 26.5 GHz
9 kHz to 10 MHz
10 to 50 MHz
50 MHz to 3.6 GHz
3.5 to 5.2 GHz
5.2 to 8.4 GHz
8.3 to 13.6 GHz
13.5 to 17.1 GHz
17.0 to 22.0 GHz
22.0 to 26.5 GHz
26.4 to 34.5 GHz
34.4 to 44 GHz
± 0.8 dB
± 0.6 dB
± 2.0 dB
± 2.5 dB
± 3.0 dB
± 3.2 dB
± 0.6 dB
± 0.45 dB
± 0.45 dB
± 1.7 dB
± 1.5 dB
± 2.0 dB
± 2.0 dB
± 2.0 dB
± 2.5 dB
± 2.5 dB
± 3.2 dB
± 0.28 dB
± 0.21 dB
± 0.20 dB
± 0.91 dB
± 0.61 dB
± 0.61 dB
± 0.67 dB
± 0.78 dB
± 0.72 dB
± 1.11 dB
± 1.42 dB
± 0.28 dB nominal
± 0.67 dB nominal
± 0.80 dB nominal
± 0.28 dB nominal
± 0.67 dB nominal
± 0.80 dB nominal
± 0.80 dB nominal
Millimeter-wave (Option 532, 544)
Preamp on (P03, P07, P13, P26)
RF/MW
(Option 503, 507, 513, 526)
Preamp on (P03, P07, P32, P44)
Millimeter-wave (Option 532, 544)
100 kHz to 3.6 GHz
3.6 to 7.0 GHz
7.0 to 26.5 GHz
100 kHz to 3.6 GHz
3.5 to 8.4 GHz
8.4 to 26.5 GHz
26.4 to 44 GHz
1. DC coupling required to meet specifications below 50 MHz. With AC coupling, specifications apply at frequencies of 50 MHz and higher. Statistical
observations at 10 MHz with AC coupling show that most instruments meet the DC-coupled specifications, however, a small percentage of
instruments are expected to have errors exceeding 0.5 dB at 10 MHz at the temperature extreme. The effect at 20 to 50 MHz is negligible but not
warranted.
7
�
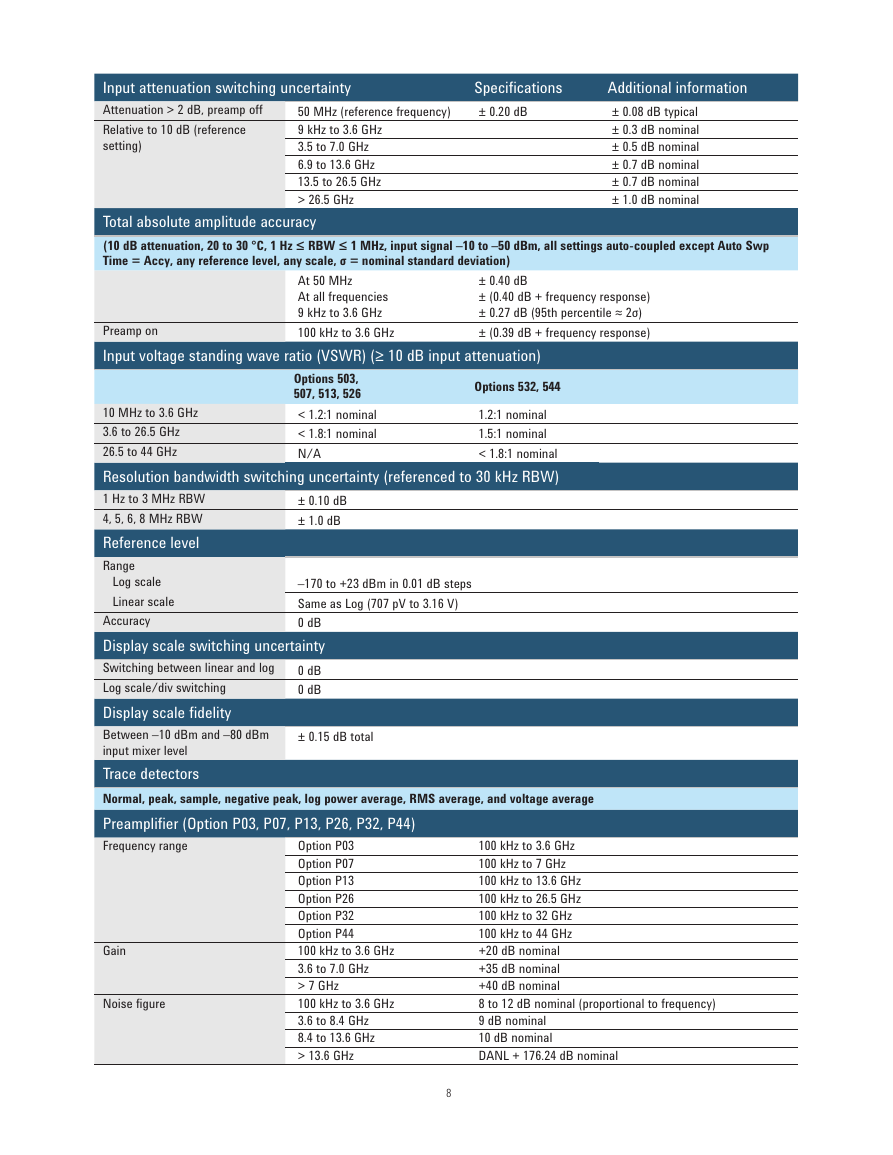
Input attenuation switching uncertainty
Attenuation > 2 dB, preamp off
Relative to 10 dB (reference
setting)
50 MHz (reference frequency)
9 kHz to 3.6 GHz
3.5 to 7.0 GHz
6.9 to 13.6 GHz
13.5 to 26.5 GHz
> 26.5 GHz
Specifications
± 0.20 dB
Additional information
± 0.08 dB typical
± 0.3 dB nominal
± 0.5 dB nominal
± 0.7 dB nominal
± 0.7 dB nominal
± 1.0 dB nominal
Total absolute amplitude accuracy
(10 dB attenuation, 20 to 30 °C, 1 Hz ≤ RBW ≤ 1 MHz, input signal –10 to –50 dBm, all settings auto-coupled except Auto Swp
Time = Accy, any reference level, any scale, σ = nominal standard deviation)
At 50 MHz
At all frequencies
9 kHz to 3.6 GHz
100 kHz to 3.6 GHz
± 0.40 dB
± (0.40 dB + frequency response)
± 0.27 dB (95th percentile ≈ 2σ)
± (0.39 dB + frequency response)
Preamp on
Input voltage standing wave ratio (VSWR) (≥ 10 dB input attenuation)
± 0.10 dB
± 1.0 dB
Options 503,
507, 513, 526
< 1.2:1 nominal
< 1.8:1 nominal
N/A
Options 532, 544
10 MHz to 3.6 GHz
1.2:1 nominal
3.6 to 26.5 GHz
1.5:1 nominal
26.5 to 44 GHz
< 1.8:1 nominal
Resolution bandwidth switching uncertainty (referenced to 30 kHz RBW)
1 Hz to 3 MHz RBW
4, 5, 6, 8 MHz RBW
Reference level
Range
Log scale
–170 to +23 dBm in 0.01 dB steps
Linear scale
Same as Log (707 pV to 3.16 V)
Accuracy
0 dB
Display scale switching uncertainty
Switching between linear and log
0 dB
Log scale/div switching
0 dB
Display scale fidelity
Between –10 dBm and –80 dBm
input mixer level
Trace detectors
Normal, peak, sample, negative peak, log power average, RMS average, and voltage average
Preamplifier (Option P03, P07, P13, P26, P32, P44)
Frequency range
± 0.15 dB total
Option P03
Option P07
Option P13
Option P26
Option P32
Option P44
100 kHz to 3.6 GHz
3.6 to 7.0 GHz
> 7 GHz
100 kHz to 3.6 GHz
3.6 to 8.4 GHz
8.4 to 13.6 GHz
> 13.6 GHz
Gain
Noise figure
100 kHz to 3.6 GHz
100 kHz to 7 GHz
100 kHz to 13.6 GHz
100 kHz to 26.5 GHz
100 kHz to 32 GHz
100 kHz to 44 GHz
+20 dB nominal
+35 dB nominal
+40 dB nominal
8 to 12 dB nominal (proportional to frequency)
9 dB nominal
10 dB nominal
DANL + 176.24 dB nominal
8
�


 2023年江西萍乡中考道德与法治真题及答案.doc
 2012年重庆南川中考生物真题及答案.doc
 2013年江西师范大学地理学综合及文艺理论基础考研真题.doc
 2020年四川甘孜小升初语文真题及答案I卷.doc
 2020年注册岩土工程师专业基础考试真题及答案.doc
 2023-2024学年福建省厦门市九年级上学期数学月考试题及答案.doc
 2021-2022学年辽宁省沈阳市大东区九年级上学期语文期末试题及答案.doc
 2022-2023学年北京东城区初三第一学期物理期末试卷及答案.doc
 2018上半年江西教师资格初中地理学科知识与教学能力真题及答案.doc
 2012年河北国家公务员申论考试真题及答案-省级.doc
 2020-2021学年江苏省扬州市江都区邵樊片九年级上学期数学第一次质量检测试题及答案.doc
 2022下半年黑龙江教师资格证中学综合素质真题及答案.doc