通信原理仿真
姓名:郭耀川
学号:12041077
班级:信息 3 班
�
1.Gaussian distributed random variates, draw the corresponding,PDFs(histograms)
for N( ,
obtained.
2) be N(0,1), N(0,4.26), and N(-2.5,1) by using the random variates
相关代码
#include
double uniform(double a,double b,long int *seed)
{double t;
*seed=2045*(*seed)+1;
*seed=*seed-(*seed/1048576)*1048576;
t=(*seed)/1048576.0;
t=a+(b-a)*t;
return(t);
}
double gauss(double mean,double std,long *s)
{int i;
double x=0.0,y=0.0;
for(i=0;i<12;i++)
{x=x+uniform(0.0,1.0,s);}
x=x-6.0;
y=mean+std*x;
return y;
}
void main()
{double mean=0.0,std=1.0,y;
int i,j;
long s=13579;
scanf("%lf %lf",&mean,&std);
FILE *fp=fopen("c:\\data.txt","w");
for(j=0;j<5000;j++)
{y=gauss(mean,std,&s);
printf("%13.7f",y);
fprintf(fp,"%13.7f",y);
}
�
fclose(fp);
}
说明:以上代码可进行高斯概率密度的仿真模拟实现。并且由用户手工录入高
斯概率的均值mean及标准差std。本程序中需先通过uniform函数产生0—1均匀分
布的随机随机数,再通过用户手工录入高斯概率的均值mean及标准差std,然后
按照相关算法进行建模仿真,计算出高斯概率分布数,并且重复模拟5000次,以
达到尽量与理论的高斯分布近似。
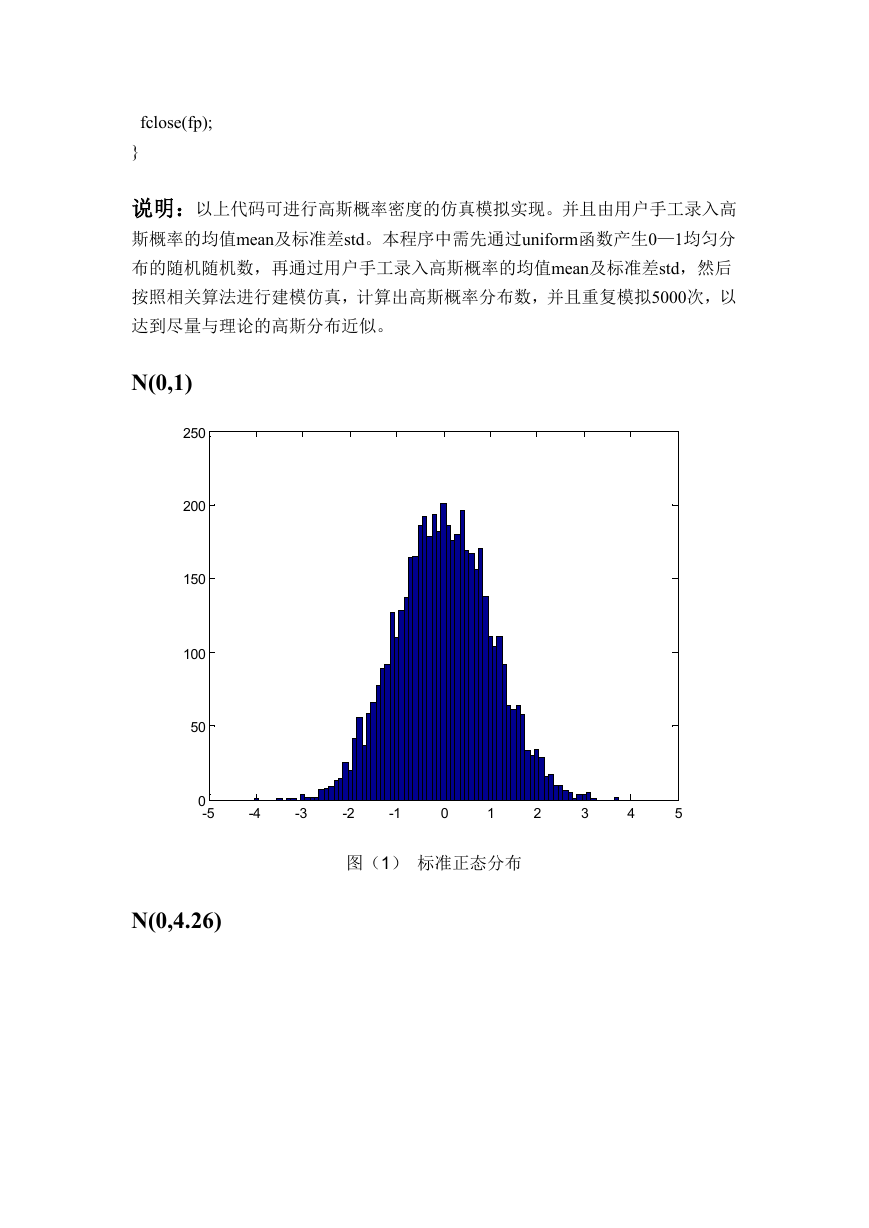
N(0,1)
250
200
150
100
50
0
-5
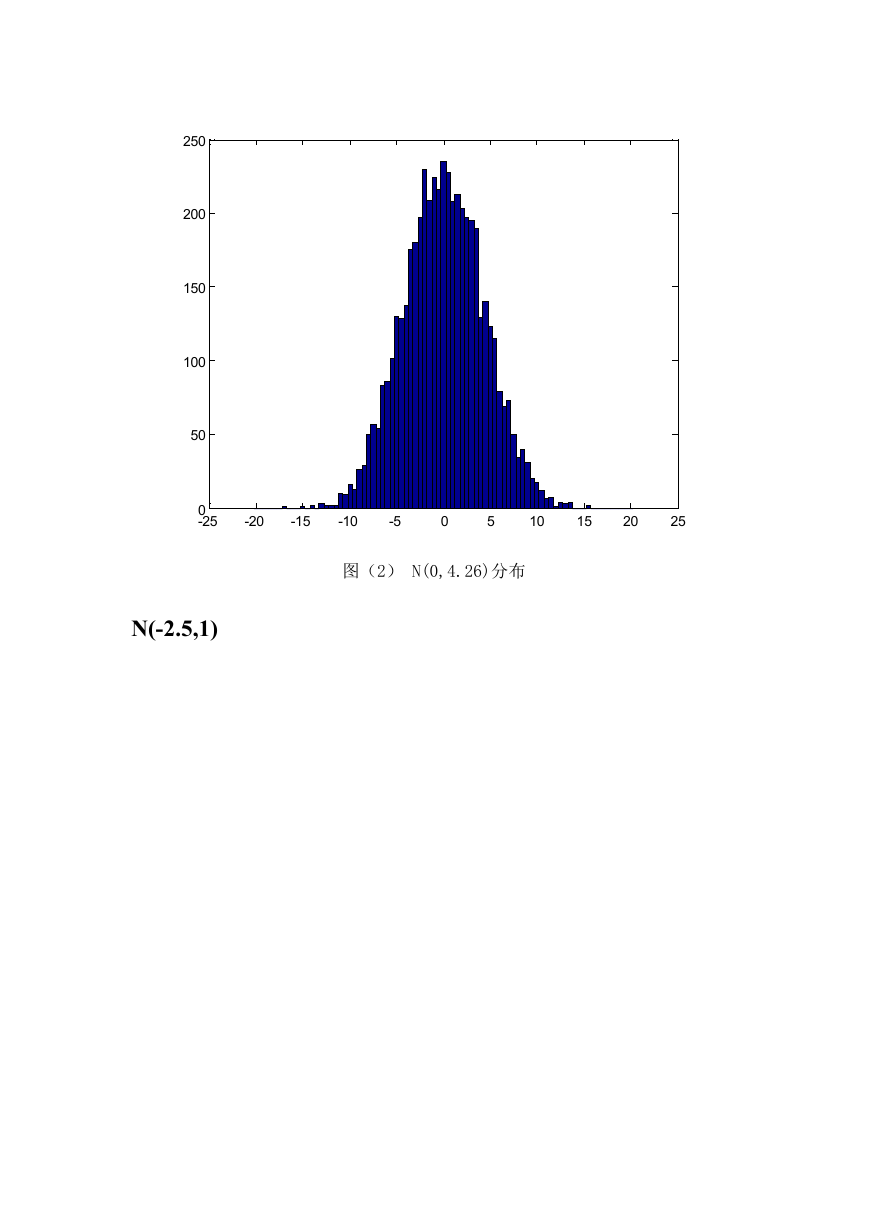
N(0,4.26)
-4
-3
-2
-1
0
1
2
3
4
5
图(1) 标准正态分布
�
250
200
150
100
50
0
-25
-20
-15
-10
-5
0
5
10
15
20
25
图(2) N(0,4.26)分布
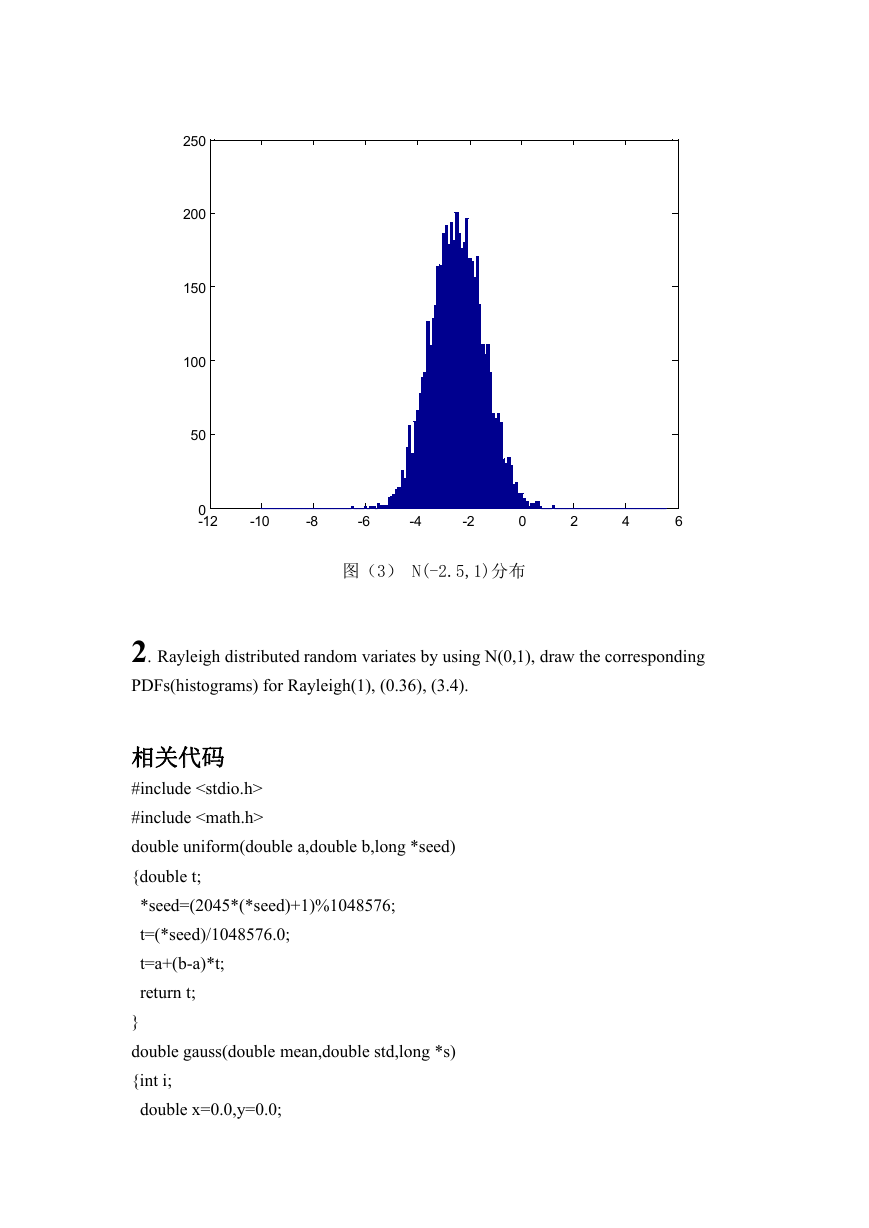
N(-2.5,1)
�
250
200
150
100
50
0
-12
-10
-8
-6
-4
-2
0
2
4
6
图(3) N(-2.5,1)分布
2. Rayleigh distributed random variates by using N(0,1), draw the corresponding
PDFs(histograms) for Rayleigh(1), (0.36), (3.4).
相关代码
#include
#include
double uniform(double a,double b,long *seed)
{double t;
*seed=(2045*(*seed)+1)%1048576;
t=(*seed)/1048576.0;
t=a+(b-a)*t;
return t;
}
double gauss(double mean,double std,long *s)
{int i;
double x=0.0,y=0.0;
�
for(i=0;i<12;i++)
{x=uniform(0.0,1.0,s)+x;}
x=x-6.0;
y=mean+std*x;
return y;
}
void main()
{double mean=0.0,std=1.0,y1,y2,y;
int i,j;
long s1=56789,s2=12345;
scanf("%lf",&std);
FILE *fp=fopen("c:\\data1.txt","w");
for(j=0;j<5000;j++)
{y1=gauss(mean,std,&s1);
y2=gauss(mean,std,&s2);
y=sqrt(y1*y1+y2*y2);
printf("%13.7f",y);
fprintf(fp,"%13.7f",y);
}
fclose(fp);
}
说明:以上代码可进行瑞利概率密度的仿真模拟实现。本程序中需先通过
uniform函数产生0—1均匀分布的随机随机数,再通过guass函数模拟出符合高斯
概率分布的高斯数,最后利用上一步得出的高斯数计算得出瑞利分布数,并且重
复模拟5000次,以达到尽量与理论的瑞利分布近似。
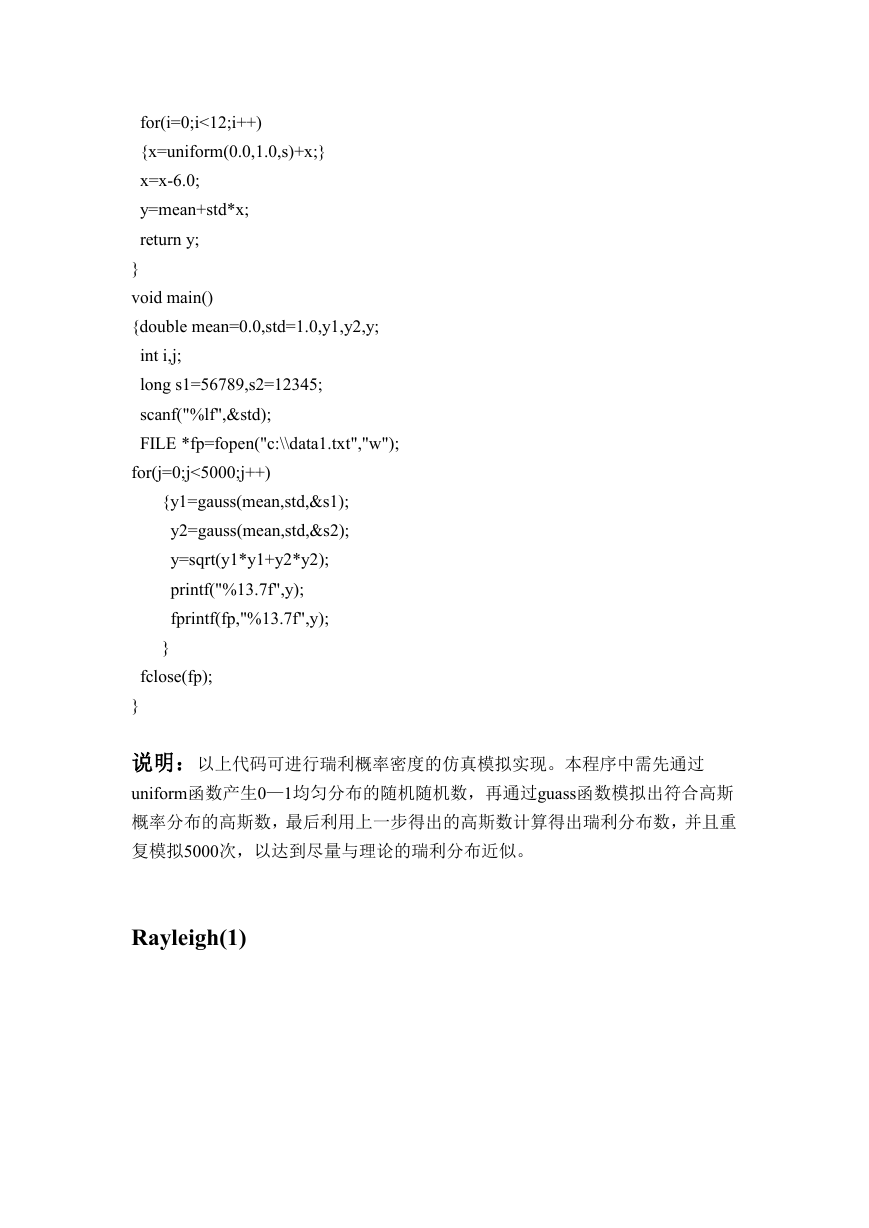
Rayleigh(1)
�
45
40
35
30
25
20
15
10
5
0
-1
0
1
2
3
4
5
6
图(4)Rayleigh(1)分布
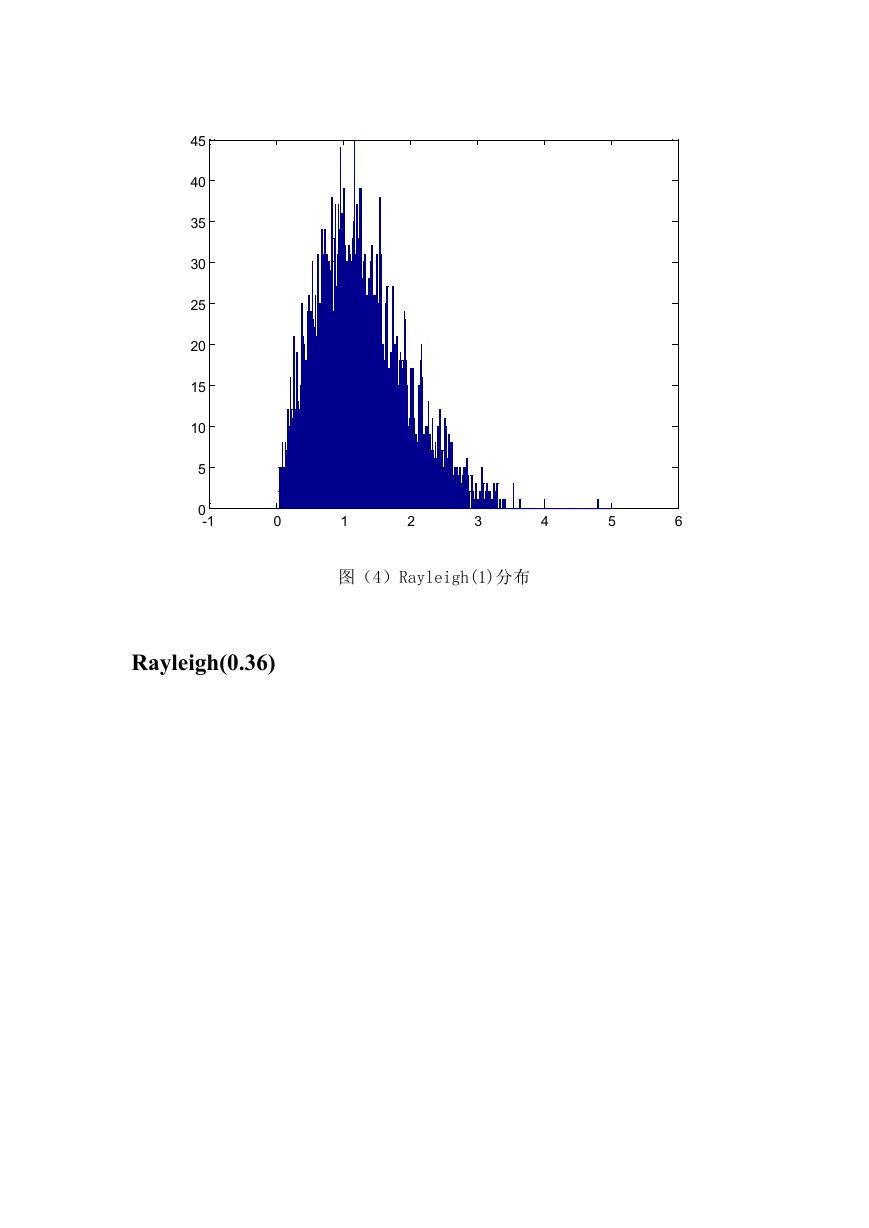
Rayleigh(0.36)
�
100
90
80
70
60
50
40
30
20
10
0
-0.5
Rayleigh(3.4)
0
0.5
1
1.5
2
2.5
图(5)Rayleigh(0.36)分布
�


 2023年江西萍乡中考道德与法治真题及答案.doc
 2012年重庆南川中考生物真题及答案.doc
 2013年江西师范大学地理学综合及文艺理论基础考研真题.doc
 2020年四川甘孜小升初语文真题及答案I卷.doc
 2020年注册岩土工程师专业基础考试真题及答案.doc
 2023-2024学年福建省厦门市九年级上学期数学月考试题及答案.doc
 2021-2022学年辽宁省沈阳市大东区九年级上学期语文期末试题及答案.doc
 2022-2023学年北京东城区初三第一学期物理期末试卷及答案.doc
 2018上半年江西教师资格初中地理学科知识与教学能力真题及答案.doc
 2012年河北国家公务员申论考试真题及答案-省级.doc
 2020-2021学年江苏省扬州市江都区邵樊片九年级上学期数学第一次质量检测试题及答案.doc
 2022下半年黑龙江教师资格证中学综合素质真题及答案.doc