Physica A 415 (2014) 240–250
Contents lists available at ScienceDirect
Physica A
journal homepage: www.elsevier.com/locate/physa
Reconstruction of multiphase microstructure based on
statistical descriptors
Dongdong Chen, Xiaohai He∗, Qizhi Teng, Zhi Xu, Zhengji Li
College of Electronics and Information Engineering, Sichuan University, Chengdu, 610065, China
h i g h l i g h t s
• We describe the two-point correlation function of multiphase microstructure.
• We discuss the lineal-path function of multiphase microstructure.
• The procedure of simulated annealing for multiphase microstructure is discussed.
• We show that the reconstructions can capture the main property of the original image.
• Different sections of the 3D generation reflect the similarity and variability in real sandstone.
a r t i c l e
i n f o
a b s t r a c t
Article history:
Received 17 January 2014
Received in revised form 26 June 2014
Available online 30 July 2014
Keywords:
Multiphase reconstruction
Two-point probability function
Lineal-path function
Two-point cluster function
Simulated annealing
The microscopic structural features of porous media directly affect their macroscopic
properties (e.g., mechanical, electromagnetic, capillary, and transport properties). As for
sandstone, the distributions of the clay and the pore in three-dimensional (3D) space have
important effects on its electrical conductivity and transport property. In this paper, the
experiment of the two-dimensional (2D) and 3D reconstructions of multiphase microstruc-
ture (pore, grain, and clay) based on 2D images was carried out. In the reconstruction proce-
dure of simulated annealing for multiphase microstructure, three independent two-point
correlation functions and two lineal-path functions are chosen as the morphological infor-
mation descriptors. Another important morphological descriptor of microstructure is the
two-point cluster function, which is used to validate the reconstruction results. From the
result of the 2D reconstruction, it is found that the 2D generation is similar with the origi-
nal 2D image in morphological information and their correlation functions match very well,
which illustrate that the presented method has the ability to generate the 2D microstruc-
ture from the original 2D image for multiphase microstructure. In the case of 3D reconstruc-
tion, the two-point correlation functions and lineal-path functions of the 3D generation are
in excellent agreement with that of the original 2D image, and comparison of the two-point
cluster functions from the slices of the 3D generation with the original image reflects the
similarity and the variability of the slices in real sandstone, which illustrate that the pre-
sented methodology is effective and proper for the reconstruction of 3D microstructure
based on the 2D image.
© 2014 Elsevier B.V. All rights reserved.
1. Introduction
Porous media, which is commonly existence in natural and man-made materials, is composed of solid material skeletons
and many crowded tiny pores created by the partition of material skeletons [1–8]. In porous media, the effective properties
∗ Corresponding author.
E-mail address: hxh@scu.edu.cn (X. He).
http://dx.doi.org/10.1016/j.physa.2014.07.066
0378-4371/© 2014 Elsevier B.V. All rights reserved.
�
D. Chen et al. / Physica A 415 (2014) 240–250
241
(e.g., mechanical, electromagnetic, capillary, and transport properties) are determined by their complex microstructures
(e.g., the volume fraction, morphology, and spatial distribution of components). To quantitatively understand the mi-
crostructure – property relationship in porous media, there is a need to obtain the real three-dimensional (3D) structure
of porous media. In many cases, it is difficult to obtain the real 3D structure of porous media [9]; only a two-dimensional
(2D) image is available. In this case, reconstructing 3D microstructure based on a 2D image is the fundamental method of
reproducing the geometry and spatial distribution of components. An effective reconstruction procedure enables one to gen-
erate accurate structures and subsequent analysis can be performed on the 3D structure to obtain the desired macroscopic
properties of the media.
There are numbers of approaches that have been taken to reconstruct the random media [10–24]. A widely adopted
reconstruction method is based on the statistical feature functions, which is also called statistical correlation functions
[15–24]. Two general approaches based on statistical reconstruction have been actively pursued in recent years. The
first method is based on the conditioning and truncation of Gaussian random fields: successively passing a normalized
uncorrelated random Gaussian field through a linear and then a nonlinear filter to yield the discrete values representing
the phases of the structure [15–19]. This approach is mathematically elegant and computationally very efficient but model
dependent, as it cannot impose constraints other than the volume fraction and the two-point probability function in the
reconstruction process. This is a serious drawback.
Another popular approach of statistical reconstruction is the simulated annealing (SA) algorithm [20–31]. This approach
is model independent and, in principle, it can include any type and number of statistical correlation functions as constraints
to reproduce the morphological information. Moreover, this method is applicable to multidimensional and multiphase
media. This method was first introduced by Torquato and Yeong in 1998 [13], which starts with a given, arbitrarily chosen,
initial configuration of a random medium and a set of target functions. The target functions describe the desirable statistical
properties of the porous media of interest, which can be various correlation functions. This method can be seen as finding
a realization (configuration) making the discrepancies between the statistical properties of the realization and that of the
original 2D structure minimized. By interchanging the phases of pixels in the digitized system, the target functions are
gradually approaching the minimization, which illustrates that the reconstruction owns the similar distribution with the
original structure.
The microstructure of porous media contains complex spatial structure information, which can be characterized by
different types of statistical descriptors. Different statistical functions contain distinctive morphological information. In
general, a single lower-order function cannot fully represent a structure. To overcome the weaknesses of individual statistic
functions and to make use of the useful information included in each statistic function, an arbitrary number of different
correlation functions can be accommodated in the reconstruction process. Reservoir sandstone is commonly composed
of multiple components (phases) and the distributions of the clay and the pore in 3D space have important effects on
its electrical conductivity and transport property. To clarify and quantify the relationships between the microstructure
and macroscopic properties, reconstructing the 3D microstructure based on 2D image is needed. Some researchers have
conducted some research on this problem [32–39]. In this paper, the SA method was chosen to reconstruct multiphase
microstructure. In the reconstruction process, multiple statistic functions (both two-point correlation function (TPCF) and
lineal-path function (LPF)) are used as constraints to reproduce the complex spatial structure information.
The outline of the rest of the paper is as follows: In Section 2, the basic distribution functions as the morphological
information of multiphase porous media are described. In Section 3, the reconstruction method for digitized media, which
utilizes both TPCFs and LPFs as statistical descriptors, is briefly outlined. In Section 4, the reconstruction of multiphase
microstructure is discussed. It is noted that the presented method can capture the salient properties of the original structure,
which can be used to analyze its macroscopic properties [40–42]. Finally, the concluding remarks are made in Section 5.
2. The description of the morphological information
2.1. Two-point correlation function
TPCF is calculated by throwing a number of random vectors on the microstructure [3], depending on the likelihood of
the beginning and end of each vector (⃗r) lying in a particular phase and examining the number fraction of the sets (vectors)
which satisfy the different phases (Fig. 1(a)). For a two-phase microstructure, there are only two phases, phase 1 and phase
2, with the volume fraction of each phase defined as
= vk,
k ∈ [1, 2],
Vk
Vtotal
(1)
where V1 and V2 are the volumes of the two phases, respectively, and v1 and v2 are their corresponding volume fractions.
Clearly,
Vk = Vtot
and
vk = 1.
(2)
2
k=1
2
k=1
�
242
D. Chen et al. / Physica A 415 (2014) 240–250
Fig. 1. The microstructure of reservoir sandstone. (a) Two-phase microstructure (black, grain; white, void). (b) Three-phase microstructure (black, grain;
gray, clay; white, void).
If N number of random points are thrown into a given microstructure and the number of points in phase k is Nk, then the
one-point probability function (Pk) can define the volume fraction through the following relation, as N (the total number)
is increased to infinity:
Now, assign a vector starting at each of the random points in a two-phase microstructure as shown in Fig. 1(a). Depending
on whether the head and the tail of these vectors fall within phase 1 or phase 2, there will be four different probabilities
(P11, P12, P21, P22) defined as follows:
⃗r = ⃗rl − ⃗rk,⃗rl ∈ φl
∩⃗rk ∈ φk
,
where Nkl is the number of vectors with the head in phase k (φk) and the tail in phase l (φl). Eq. (4) defines a joint probability
distribution function for the occurrence of events constructed by two points as the head and tail of a vector when it is
randomly inserted in a microstructure N number of times. The two-point probability function can be defined based on two
other probability functions such that
(5)
The first term on the right-hand side of Eq. (5) is a conditional probability function. Note that, at very large distances⃗r → ∞,
the probability of occurrence of the beginning point does not affect the end point and the two points become uncorrelated
or statistically independent and the conditional probability function reduces to a one-point function:
Pkl
⃗r = P{(⃗rl ∈ φl)|(⃗rk ∈ φk)}P(⃗rk ∈ φk).
P(⃗rk ∈ φk) = P⃗r → ∞ ,⃗rk ∈ φk
|⃗rl ∈ φl
⃗r = P(⃗rl ∈ φl)P(⃗rk ∈ φk)
Pkl
.
The two-point correlation function will then be reduced to
or
For a three-phase microstructure, as shown in Fig. 1(b), the indices (k, l) in the probability function representation extend
to three, and, as a result, we have nine probabilities (P11, P12, P13, P21, P22, P23, P31, P31, P33). Due to normality conditions,
the following equations are satisfied:
Pk = Nk
N
= vk.
N→∞
N→∞
⃗r = Nkl
N
Pkl
⃗r = 1,
Pkl (∞) = vkvl.
⃗r = vk,
⃗r = vl.
l=1,2,3
Pkl
k=1,2,3
l=1,2,3
Pkl
Pkl
k=1,2,3
(3)
(4)
(6)
(7)
(8)
(9)
(10)
(11)
�
D. Chen et al. / Physica A 415 (2014) 240–250
243
Satisfying all three conditions for a three-phase microstructure (k, l ∈ (1, 2, 3)) and knowing that the probability functions
are symmetric (Pkl = Plk), three nonlinear correlation equations can be obtained as follows:
P11 + P12 + P13 = v1,
P21 + P22 + P23 = v2,
P31 + P32 + P33 = v3,
(12)
(13)
(14)
and the nine probability functions will be reduced to six independent functions (P11, P12, P13, P22, P23, P33), resulting in the
important conclusion that only three of the nine probabilities should be considered as independent variables. For instance,
P11, P12, and P22 can be chosen as the three probability parameters. The other probability functions can be obtained through
Eqs. (12), (13), and (14).
2.2. Lineal-path function
Another important morphological descriptor is the LPF Lk(r) expressed as follows [3]:
Lk (r) = lk(r)
N
.
(15)
In Eq. (15), Lk(r) represents the probability that a line segment of length r lies wholly in phase k when it is randomly thrown
into the sample N number of times; lk(r) represents the entire line of length r lying in phase k. The LPF is a monotonically
decreasing function of r, as the space available in phase k to a line segment of length r decreases with increasing r. At the
extreme values of Lk(r), we have that
Lk(0) = vk,
Lk(∞) = 0,
(16)
where vk is the volume fraction of phase k. Fig. 1(a) shows an event that contributes to the LPF. This function contains
some connectedness information, at least along a lineal path, and hence reflects certain long-range information about the
system [3]. The LPF can distinguish between different phases of a medium, in the sense that the LPF for a particular phase
cannot be uniquely determined by simply knowing that of the complementary phases. For a three-phase microstructure, the
three LPFs (L1 (r) , L2 (r) , L3 (r)) are independent. There is no linear relation between the three LPFs. Therefore, to efficiently
reconstruct the microstructure using LPFs, it is important to point out which phases in the medium are the target phases of
interest to be reconstructed. In the reconstruction process of three-phase microstructure using LPFs, phase 1 and phase 2 are
our interested phases and are chosen as the target phases to be reconstructed. In an isotropic medium, the LPF relies only
on the distance r between the two end points. In all reconstructed systems, we assume the isotropy of the evolving system
and the sampling is therefore performed only along orthogonal directions. It is observed that this sampling procedure can
be more accurate than that by random sampling (throwing random line segments into the system), because the former
exhaustively incorporates information from every pixel in the entire system.
3. SA reconstruction
The reconstruction methodology employed here is a variation of the SA method introduced by Rintoul and Torquato
(1997) to reconstruct dispersions of particles [43]. In the reconstruction process, some morphological descriptors are
needed. Different morphological information descriptors reflect different information of the microstructure; generally, a
single morphological information descriptor cannot fully characterize a structure. The LPF Lk(r) contains lineal ‘‘clustering’’
or ‘‘connectedness’’ information that is absent in the two-point correlation function. However, it does not contain
morphological information for length scales larger than the maximum cluster size in the system. In addition, the two-point
correlation function provides short-range information about different clusters. To overcome the weaknesses of individual
correlations and to exploit the useful information contained in each correlation function, one can accommodate an arbitrary
number of different correlation functions in the reconstruction process. In this paper, the multiple correlation functions
(Pij(r) and Lk(r)) are used. As discussed in Section. 2, the energy for a three-phase system which is defined based on three
independent two-point correlation functions and two LPFs is listed as follows:
(P22)orig − (P22)rec
2
E =
(P11)orig − (P11)rec
+
(L1)orig − (L1)rec
2 +
2 +
r
2 +
(P12)orig − (P12)rec
2 ,
(L2)orig − (L2)rec
r
r
r
r
where the correlation functions of ((Pkl)orig , (Lk)orig ) and ((Pkl)rec , (Lk)rec ) are, respectively, the relevant values from the
original and reconstructed microstructure in three orthogonal directions. To make the energy difference minimized between
the reconstruction and the reference 2D image, the procedure of the 3D reconstruction is described as follows: firstly,
a candidate 3D image is randomly created with a volume fraction equal to the original microstructure and its energy is
calculated with Eq. (17) as initial energy E. Secondly, a new trial state is obtained by interchanging two arbitrarily selected
(17)
�
244
D. Chen et al. / Physica A 415 (2014) 240–250
pixels of different phases. The interchanged procedure of different phases has the nice property of automatically preserving
the volume fraction of both phases during the reconstruction process. After a new trial state is obtained, the energy of the
trial state E′ is determined by Eq. (17) and the energy difference ∆E = E′ − E between the initial and the trial states of the
system can be calculated. The previous microstructure is replaced by the new one with the accepted probability p(∆E) via
the Metropolis method as
1, ∆E ≤ 0
− ∆E
exp
p(∆E) =
T
, ∆E > 0,
(18)
where the parameter T is the ‘‘temperature.’’ The iterative process of pixel selection, phase interchange, energy difference,
and accepted probability calculation are continued until a termination condition is met when the energy E (given by Eq. (17))
is less than some small tolerance value or when the number of consecutive unsuccessful phase interchanges is greater than a
large number. This process makes the statistical properties of the reconstructed microstructure (Pkl)rec and (Lk)rec gradually
converged to that of the original structure (Pkl)orig and (Lk)orig. Like in an annealing process, as the iterative procedure
is continued, the parameter T decreases gradually. The decreased rate of T is controlled by a cooling schedule which is
chosen to control the system to evolve to the desired state as quickly as possible, without falling into any local energy
minima. For the initial temperature T, we adopt the suggestion that its value is determined by the initial acceptance rate
which is equal to 0.5 [44]. To quantitatively ascertain the success of the reconstruction, other statistical descriptors of the
media [21] should be measured and compared. The two-point cluster function is a superior microstructural descriptor over
other correlation functions, which has been demonstrated quantitatively by Jiao et al. [21]. From their work, it is noted that
the hybrid reconstruction involving the two-point cluster function more accurately yields the well-defined inclusions of the
same size, in contrast to the two-point correlation function reconstruction and the hybrid reconstruction of the two-point
correlation function and the pore-size function, which overestimate the clustering of the inclusion phase. The accuracy of
the reconstruction is quantified by comparing the unconstrained LPF of the target system with that of the reconstructed
media. The result also indicates that the two-point cluster function is superior to other statistical descriptors. In this article,
the unconstrained two-point cluster functions C2(r) associated with the inclusion phases are computed and compared to
illustrate the reconstruction.
4. Discussion and results
The description of the morphological information for multiphase microstructure has been stated in Section 2. In Section 3,
the reconstruction method for multiphase microstructure is introduced. Now, the reconstruction method is applied to
reconstruct multiphase reservoir sandstone samples using the two-point correlation functions and LPFs as constraints. In
the reconstruction process, the gray phase is named as phase 1; the white phase and the black phase are named as phase 2
and phase 3, respectively.
4.1. 2D reconstruction of three-phase reservoir sandstone
Reservoir sandstone is an important porous medium, which is one of the main types of oil and gas reservoirs. In this
section, the presented method is applied to study the reconstruction of multiphase reservoir sandstone. A back-scattered
electron (BSE) image and a tomographic image of reservoir sandstone are segmented into three different phases: grain,
clay, and void, which are displayed, respectively, in Figs. 2(a) and (b). The two images are digitized into 260 × 260 and
512 × 512 pixel arrays. The phases in Fig. 2 are defined as follows: the gray color is the clay named phase 1, and the white
and black colors are the void named phase 2 and the grain named phase 3, respectively. In addition, their volume fractions
are v1 = 0.176, v2 = 0.066, and v3 = 0.758 for Fig. 2(a) and v1 = 0.133, v2 = 0.218, and v3 = 0.649 for Fig. 2(b).
To effectively reconstruct the reservoir sandstone (the two-point correlation functions and LPFs as constraints), it needs
three independent two-point correlation functions and two LPFs. As stated in Section 2, P11, P12, P22, L1, and L2 are chosen
as the constraints. These structural functions of the original sandstone are obtained by the sampling techniques described
in Section 2. The simulations start from random initial configurations (the randomly generated phase 1, phase 2, and phase
3 with fixed volume fractions v1 = 0.176, v2 = 0.066, and v3 = 0.758 for Fig. 2(a) and v1 = 0.133, v2 = 0.218, and
v3 = 0.649 for Fig. 2(b)), at some initial temperature T0.
After generating an initial microstructure, two arbitrary pixels of different phases are selected and are interchanged
forming a new microstructure. The energy difference between the initial and the new state of the system decides the
accepted probability of the new state. After interchanging the phases of the pixels sufficiently, the energy difference between
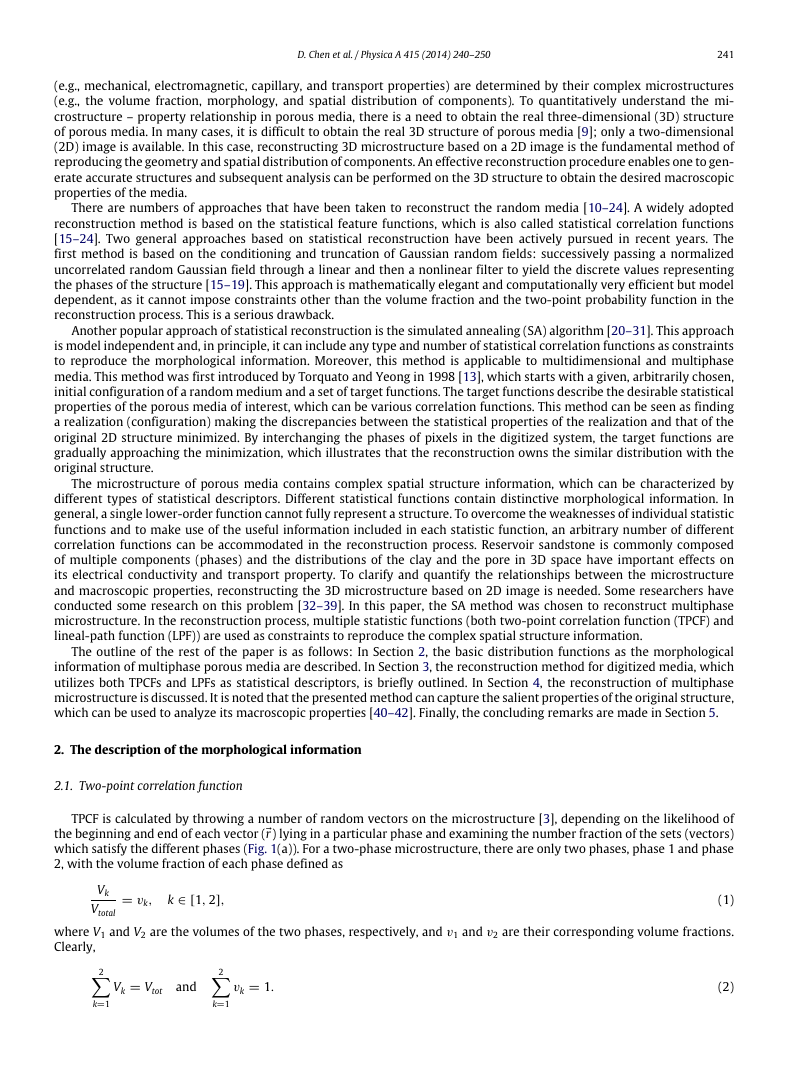
the original image and the reconstruction is close to the minimum. The reconstructions for the images of Figs. 2(a), (b),
respectively, spend about 17 and 32 min. The reconstructed image shown in Fig. 2(c) has similar morphological information
to that of the original image, except that the void and clay regions typically are more rounded in shape. For the reconstructed
image in Fig. 2(d), the degree of clustering of the pore phase is reduced, compared to the original image in Fig. 2(b). This
is due to the fact that the target functions Lk(r) only contain partial clustering information. The comparisons of statistic
�
D. Chen et al. / Physica A 415 (2014) 240–250
245
Fig. 2.
microstructures of the reconstructions.
(a) and (b) are the original 2D images of the three-phase reservoir sandstone microstructure; (c) and (d) are the corresponding three-phase
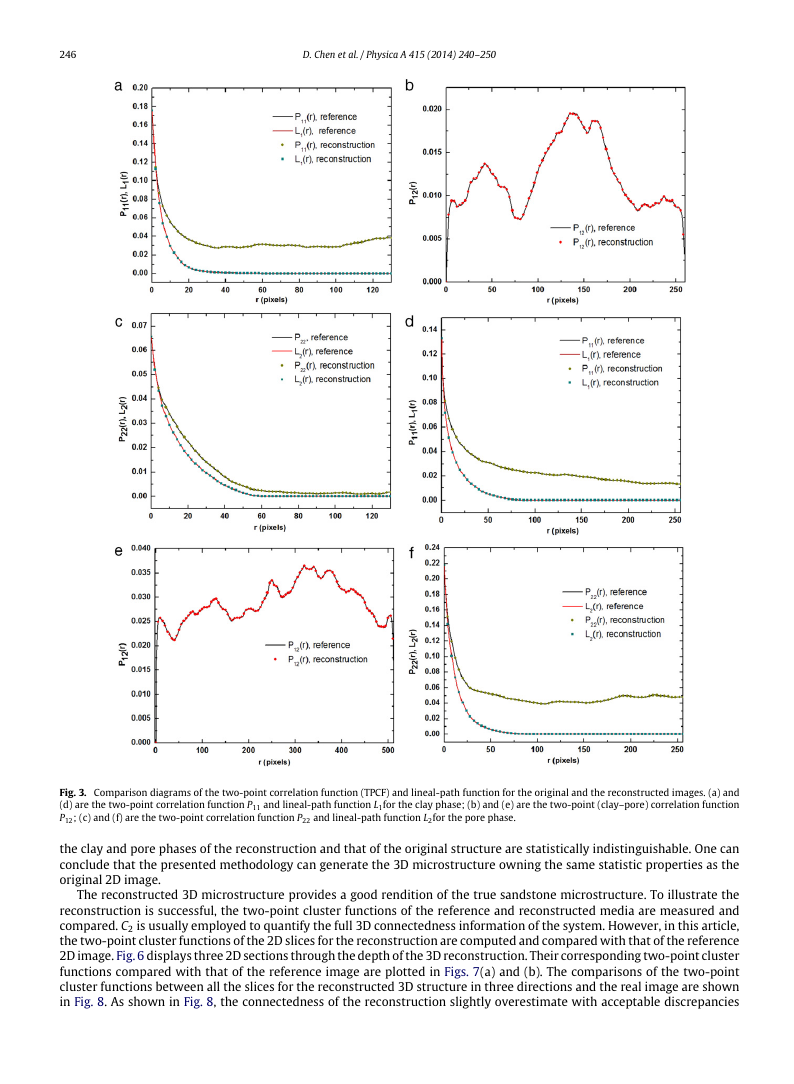
functions between the reconstructions and the real images are, respectively, plotted in Figs. 3(a)–(c) and Figs. 3(d)–(f). It is
noted that their statistic functions are statistically indistinguishable. The results shown in Figs. 2 and 3 illustrate that the
realizations based on the methodologies described here have similar morphological information to the original images and
their correlation statistics match fairly well.
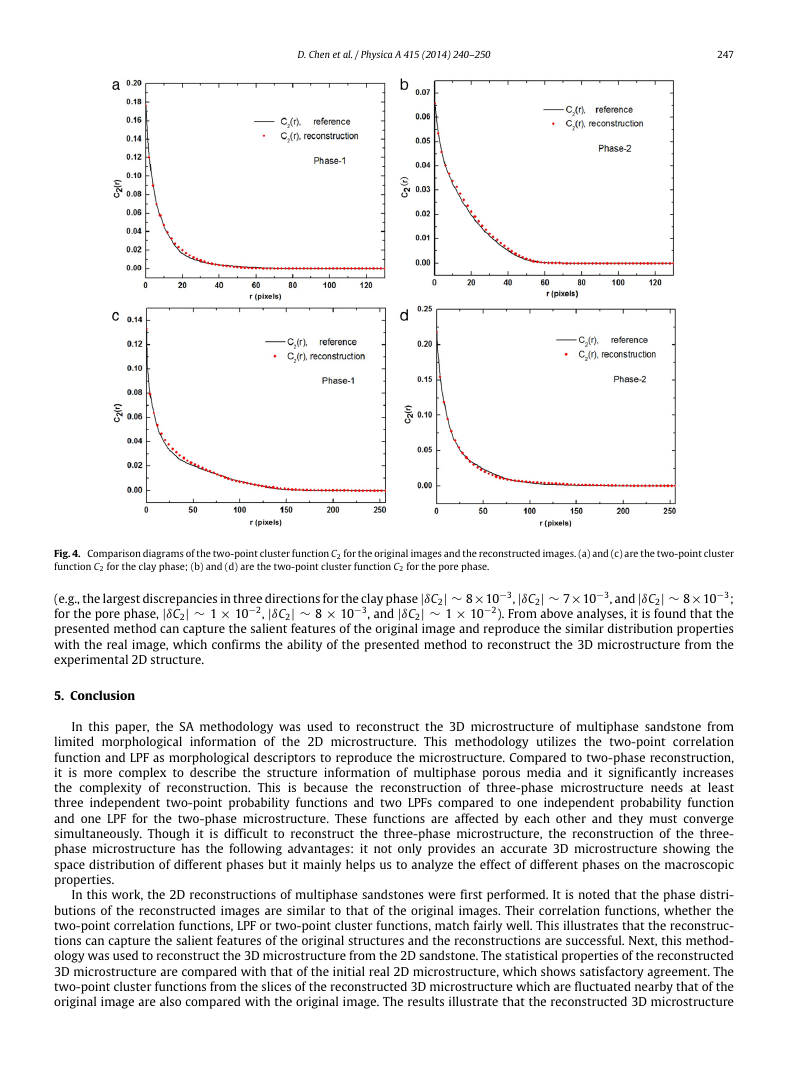
As stated earlier, to ascertain whether the reconstruction is quantitatively successful, two-point cluster functions of
the original and the generated media are compared. The measured C2 for the pore and clay phases of the references and
reconstructions are shown in Fig. 4. It is noted that C2 of the generated medium is closely similar to that of the target
medium, which illustrates that the reconstructions are successful. However, they still have some deviation with acceptable
discrepancies (e.g., the largest discrepancies for the clay phase and the pore phase between Figs. 2(a) and (c)|δC2| ∼ 3×10⁻³
and |δC2| ∼ 2 × 10⁻³, and between Figs. 2(b) and (d) |δC2| ∼ 4 × 10⁻³ and |δC2| ∼ 3 × 10⁻³). This non-uniqueness is due
to the fact that the low-order statistic functions generally do not contain complete morphological information.
4.2. 3D reconstruction of three-phase reservoir sandstone
Two cases of the 2D reconstruction of three-phase microstructure have been performed, which demonstrates that the
presented method can capture the main structural information of the reference microstructure. The reconstruction of 3D
microstructure based on 2D image is something we are more interested in. Applying the methodologies introduced above,
a three-phase microstructure of 2D sandstone is considered for reconstructing its corresponding 3D structure [13]. A tomo-
graphic image of the reservoir sandstone shown in Fig. 5(a), which is chosen as the reference image, is composed of three
constituents (clay, void, and grain). In the reconstruction process, three independent two-point correction functions and two
LPFs as constraints are extracted from the reference image. The reconstructed structure has system sizes of 128×128×128
pixels.
As an illustration of the presented methodology, Fig. 5(b) shows the phase distribution for a computer-generated
three-phase microstructure (black, grain; white, pore; gray, clay) with a 62.62% volume fraction of grain, 21.27% of pore,
and 16.11% of clay. This microstructure is simulated to examine the reproducibility of the details of the microstructure
represented by the two-point correlation functions and LPFs. This is accomplished by using the clay and pore phases in this
trial realization. The reconstruction spends about 3.5 h. The results for the two-point correlation functions (P11 for clay–clay,
P12 for clay–pore, and P22 for pore–pore) and LPFs (L1 for clay and L2 for pore) in Figs. 5(c)–(e) show that the distribution of
�
246
D. Chen et al. / Physica A 415 (2014) 240–250
Fig. 3. Comparison diagrams of the two-point correlation function (TPCF) and lineal-path function for the original and the reconstructed images. (a) and
(d) are the two-point correlation function P11 and lineal-path function L1for the clay phase; (b) and (e) are the two-point (clay–pore) correlation function
P12; (c) and (f) are the two-point correlation function P22 and lineal-path function L2for the pore phase.
the clay and pore phases of the reconstruction and that of the original structure are statistically indistinguishable. One can
conclude that the presented methodology can generate the 3D microstructure owning the same statistic properties as the
original 2D image.
The reconstructed 3D microstructure provides a good rendition of the true sandstone microstructure. To illustrate the
reconstruction is successful, the two-point cluster functions of the reference and reconstructed media are measured and
compared. C2 is usually employed to quantify the full 3D connectedness information of the system. However, in this article,
the two-point cluster functions of the 2D slices for the reconstruction are computed and compared with that of the reference
2D image. Fig. 6 displays three 2D sections through the depth of the 3D reconstruction. Their corresponding two-point cluster
functions compared with that of the reference image are plotted in Figs. 7(a) and (b). The comparisons of the two-point
cluster functions between all the slices for the reconstructed 3D structure in three directions and the real image are shown
in Fig. 8. As shown in Fig. 8, the connectedness of the reconstruction slightly overestimate with acceptable discrepancies
�
D. Chen et al. / Physica A 415 (2014) 240–250
247
Fig. 4. Comparison diagrams of the two-point cluster function C2 for the original images and the reconstructed images. (a) and (c) are the two-point cluster
function C2 for the clay phase; (b) and (d) are the two-point cluster function C2 for the pore phase.
(e.g., the largest discrepancies in three directions for the clay phase|δC2| ∼ 8×10⁻³,|δC2| ∼ 7×10⁻³, and|δC2| ∼ 8×10⁻³;
for the pore phase, |δC2| ∼ 1 × 10⁻², |δC2| ∼ 8 × 10⁻³, and |δC2| ∼ 1 × 10⁻²). From above analyses, it is found that the
presented method can capture the salient features of the original image and reproduce the similar distribution properties
with the real image, which confirms the ability of the presented method to reconstruct the 3D microstructure from the
experimental 2D structure.
5. Conclusion
In this paper, the SA methodology was used to reconstruct the 3D microstructure of multiphase sandstone from
limited morphological
information of the 2D microstructure. This methodology utilizes the two-point correlation
function and LPF as morphological descriptors to reproduce the microstructure. Compared to two-phase reconstruction,
it is more complex to describe the structure information of multiphase porous media and it significantly increases
the complexity of reconstruction. This is because the reconstruction of three-phase microstructure needs at least
three independent two-point probability functions and two LPFs compared to one independent probability function
and one LPF for the two-phase microstructure. These functions are affected by each other and they must converge
simultaneously. Though it is difficult to reconstruct the three-phase microstructure, the reconstruction of the three-
phase microstructure has the following advantages: it not only provides an accurate 3D microstructure showing the
space distribution of different phases but it mainly helps us to analyze the effect of different phases on the macroscopic
properties.
In this work, the 2D reconstructions of multiphase sandstones were first performed. It is noted that the phase distri-
butions of the reconstructed images are similar to that of the original images. Their correlation functions, whether the
two-point correlation functions, LPF or two-point cluster functions, match fairly well. This illustrates that the reconstruc-
tions can capture the salient features of the original structures and the reconstructions are successful. Next, this method-
ology was used to reconstruct the 3D microstructure from the 2D sandstone. The statistical properties of the reconstructed
3D microstructure are compared with that of the initial real 2D microstructure, which shows satisfactory agreement. The
two-point cluster functions from the slices of the reconstructed 3D microstructure which are fluctuated nearby that of the
original image are also compared with the original image. The results illustrate that the reconstructed 3D microstructure
�




 2023年江西萍乡中考道德与法治真题及答案.doc
 2012年重庆南川中考生物真题及答案.doc
 2013年江西师范大学地理学综合及文艺理论基础考研真题.doc
 2020年四川甘孜小升初语文真题及答案I卷.doc
 2020年注册岩土工程师专业基础考试真题及答案.doc
 2023-2024学年福建省厦门市九年级上学期数学月考试题及答案.doc
 2021-2022学年辽宁省沈阳市大东区九年级上学期语文期末试题及答案.doc
 2022-2023学年北京东城区初三第一学期物理期末试卷及答案.doc
 2018上半年江西教师资格初中地理学科知识与教学能力真题及答案.doc
 2012年河北国家公务员申论考试真题及答案-省级.doc
 2020-2021学年江苏省扬州市江都区邵樊片九年级上学期数学第一次质量检测试题及答案.doc
 2022下半年黑龙江教师资格证中学综合素质真题及答案.doc