Quick Start Guide
Agilent Technologies
14565B Device
Characterization Software
for Windows 2000
and Windows XP
sA
�
Contents
Items Supplied......................................................................................... 3
System Requirements ............................................................................ 3
Description .............................................................................................. 4
Automation Interface .............................................................................. 4
Installing and Running the Software..................................................... 5
Configuring the I/O.................................................................................. 5
Performing Basic Operations ................................................................ 6
Display Area............................................................................................. 7
Making Triggered Measurements.......................................................... 8
Performing Measurements on Waveforms........................................... 9
Placing a Waveform on the Display .................................................... 10
Generating CCDF Graphs..................................................................... 11
Long Term Data Logging ..................................................................... 12
Saving and Printing Measurement Data ............................................. 14
Advanced Controls ............................................................................... 14
Sample Waveforms............................................................................... 18
Licensing ............................................................................................... 19
2
�
Items Supplied
Agilent 14565B Quick Start Guide
This guide provides a Quick overview of the operation of the 14565B
Device Characterization Software. For complete operating details, refer to
the on-line Help document that is included on the CD-ROM or can be
accessed from within the 14565B application.
Software Entitlement Certificate
This certificate is only provided with the full or upgrade version of the
14565B software.
One of the following CD-ROMs
Agilent 14565B Device Characterization Software
This is the full version of the software. A software license is required.
Agilent 14565U Device Characterization Software
This is the upgrade version of the software. It requires a previous
version (Agilent 14565A) of the software installed on the computer.
A software license is required.
Agilent 14565E Device Characterization Software
The evaluation version of the software. This version will only run for 30
days from when the software is first run. At the end of the evaluation
period the software will stop working. A software license is NOT
required.
System Requirements
Computer
Platforms
Interface
Cards and
Libraries
Supported
dc Source
Models
Pentium 233 MHz (minimum) with 64 Mbytes RAM
Windows 2000
Windows XP
Agilent 82350A and 82341C card with
Agilent IO Library version K.01.00 or later
or
National Instruments GPIB2 card with
National Instruments VISA Run-time Engine version 2.6
2Requires NI-488.2 (Win32) version 1.6 or later
Agilent 66309B/D3
Agilent 66311A/B/D3
Agilent 66312A/66332A3
Agilent 66319B/D; 66321B/D
3Does not support CCDF measurements and long term data logging.
3
�
Description
The Agilent Technologies 14565B Device Characterization Software is an easy-
to-use graphical user interface for the Agilent 66300-series dc sources. With it,
you can:
Control output and measurement functions from a single window.
View output measurements on an oscilloscope-like display.
Copy, save, or print captured waveforms.
Recall saved waveforms for on-screen comparison with live waveforms.
Adjust horizontal and vertical markers to perform measurements on a
selected section of the waveform.
Operate in either simulation mode (no hardware required), or in instrument
control mode.
Long-term voltage and current data logging.1
• Generate CCDF graphs of battery current drain.1
1Available on 66319B/D and 66321B/D dc sources with firmware version A.03.00 or later.
Firmware upgrade p/n = 5182-9091.Refer to the on-line help for firmware upgrade instructions.
NOTE: The Agilent 14565B Device Characterization Software does not control
instruments other than the supported Agilent dc sources. Drivers for
other GPIB instruments are not provided.
Automation Interface
The Agilent 14565B Automation Interface lets you automate, or control the
Agilent 14565B Device Characterization functions from another program. The
Agilent 14565B Automation Interface is supported by programming languages
or applications that can use COM components for communication.
The following programming environments are presently supported:
Agilent Wireless Test Manager (WTM).
Microsoft Excel.
National Instruments LabView.
Visual C++ using MFC.
Visual Basic 6.0
Visual C# .NET.
Visual Basic .NET
Visual Basic for Applications (VBA)
NOTE: Refer to the Agilent 14565B Automation Programming Guide for
complete information on using the Agilent 14565B Device
Characterization software within the listed programming environments.
4
�
Installing and Running the Software
NOTE: Before running the Agilent 14565B application, you must have installed
and connected the dc source to a computer with the appropriate interface
cable. You must also have the appropriate interface card installed and
configured. If you are using an Agilent interface card, you must have the
appropriate SICL or VISA library drivers installed.
1. Place the CD-ROM in the CD-ROM drive and run Agilent14565B install.
2. Follow the directions on the screen to install the software. The Readme.txt
file contains product updates or corrections that are not documented in the
on-line help file. Use any text editor to open and read this file.
3. To run the Agilent 14565B application from the Start menu, click:
Programs | Agilent 14565B
Additional information about the Agilent 14565B application is available in
the on-line help document that can be accessed from the application.
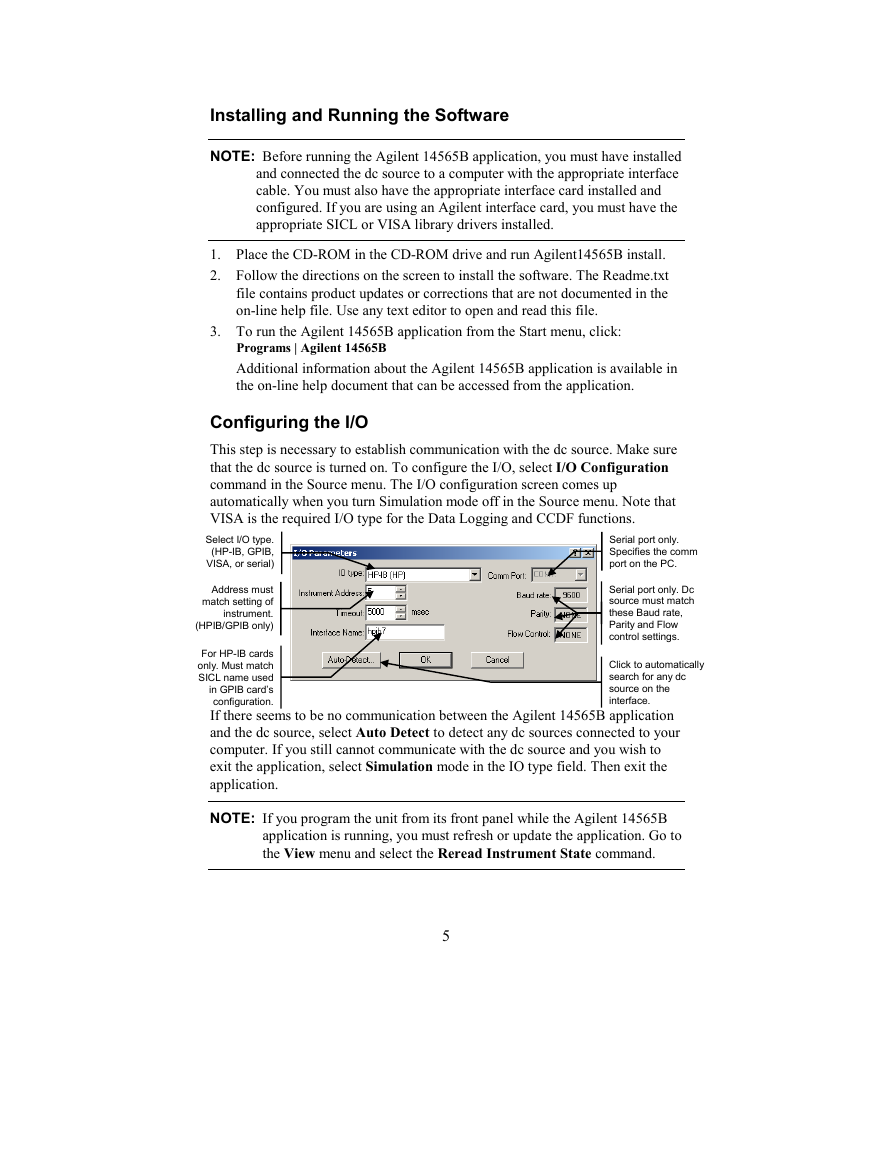
Configuring the I/O
This step is necessary to establish communication with the dc source. Make sure
that the dc source is turned on. To configure the I/O, select I/O Configuration
command in the Source menu. The I/O configuration screen comes up
automatically when you turn Simulation mode off in the Source menu. Note that
VISA is the required I/O type for the Data Logging and CCDF functions.
Select I/O type.
(HP-IB, GPIB,
VISA, or serial)
Serial port only.
Specifies the comm
port on the PC.
Address must
match setting of
instrument.
(HPIB/GPIB only)
Serial port only. Dc
source must match
these Baud rate,
Parity and Flow
control settings.
For HP-IB cards
only. Must match
SICL name used
in GPIB card’s
configuration.
If there seems to be no communication between the Agilent 14565B application
and the dc source, select Auto Detect to detect any dc sources connected to your
computer. If you still cannot communicate with the dc source and you wish to
exit the application, select Simulation mode in the IO type field. Then exit the
application.
Click to automatically
search for any dc
source on the
interface.
NOTE: If you program the unit from its front panel while the Agilent 14565B
application is running, you must refresh or update the application. Go to
the View menu and select the Reread Instrument State command.
5
�
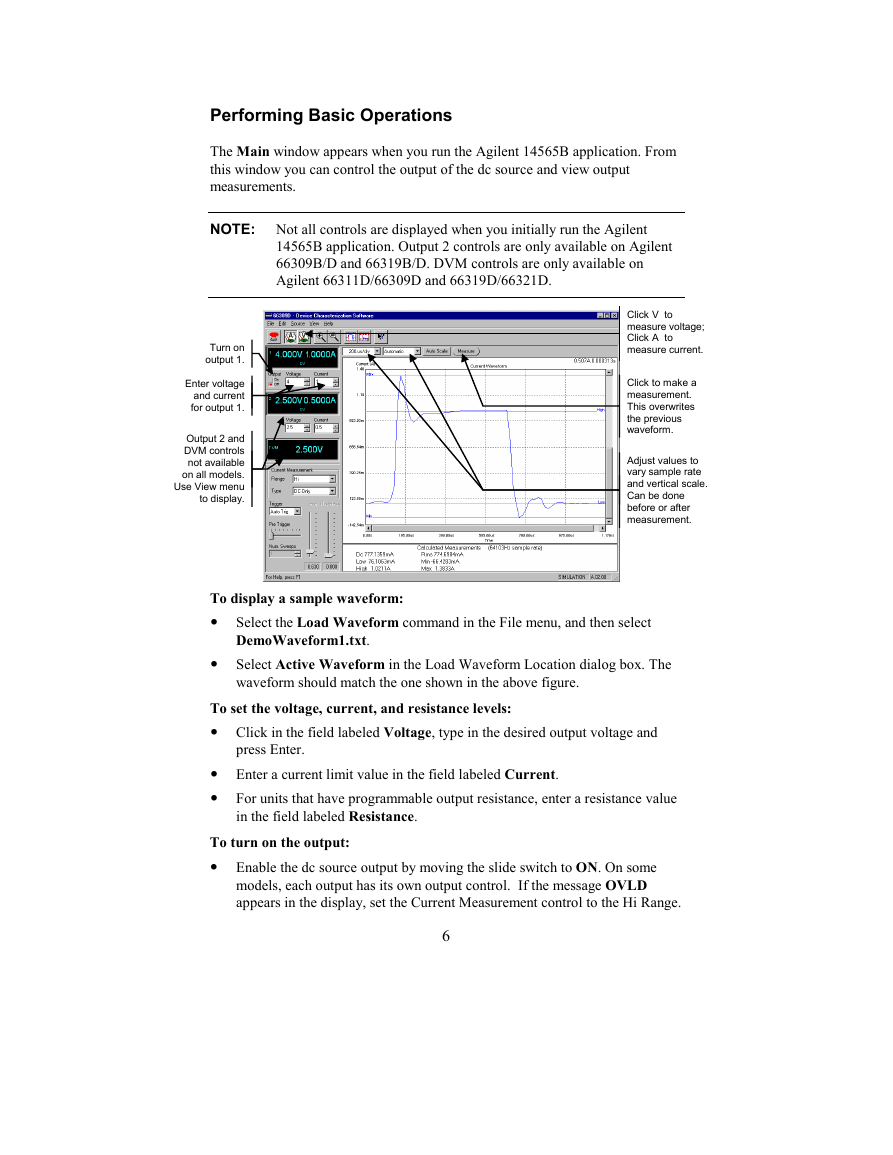
Performing Basic Operations
The Main window appears when you run the Agilent 14565B application. From
this window you can control the output of the dc source and view output
measurements.
NOTE: Not all controls are displayed when you initially run the Agilent
14565B application. Output 2 controls are only available on Agilent
66309B/D and 66319B/D. DVM controls are only available on
Agilent 66311D/66309D and 66319D/66321D.
Turn on
output 1.
Enter voltage
and current
for output 1.
Output 2 and
DVM controls
not available
on all models.
Use View menu
to display.
Click V to
measure voltage;
Click A to
measure current.
Click to make a
measurement.
This overwrites
the previous
waveform.
Adjust values to
vary sample rate
and vertical scale.
Can be done
before or after
measurement.
To display a sample waveform:
Select the Load Waveform command in the File menu, and then select
DemoWaveform1.txt.
Select Active Waveform in the Load Waveform Location dialog box. The
waveform should match the one shown in the above figure.
To set the voltage, current, and resistance levels:
Click in the field labeled Voltage, type in the desired output voltage and
press Enter.
Enter a current limit value in the field labeled Current.
For units that have programmable output resistance, enter a resistance value
in the field labeled Resistance.
To turn on the output:
Enable the dc source output by moving the slide switch to ON. On some
models, each output has its own output control. If the message OVLD
appears in the display, set the Current Measurement control to the Hi Range.
6
�
To make a measurement:
Click the A button to select current measurements; click the V button to
select voltage measurements.
Click the Measure button to make the measurement.
Adjust the time/div and amps/div fields to adjust the sample rate and vertical
scale. Click Auto Scale to fit the display to the acquired waveform.
To view the output 2 controls and the DVM display:
If your dc source has a second output or a DVM input, go to the View menu
and check the item that you wish to display.
✔ Second Output
✔ Digital Voltmeter
If the item is grayed out, your dc source does not have this feature.
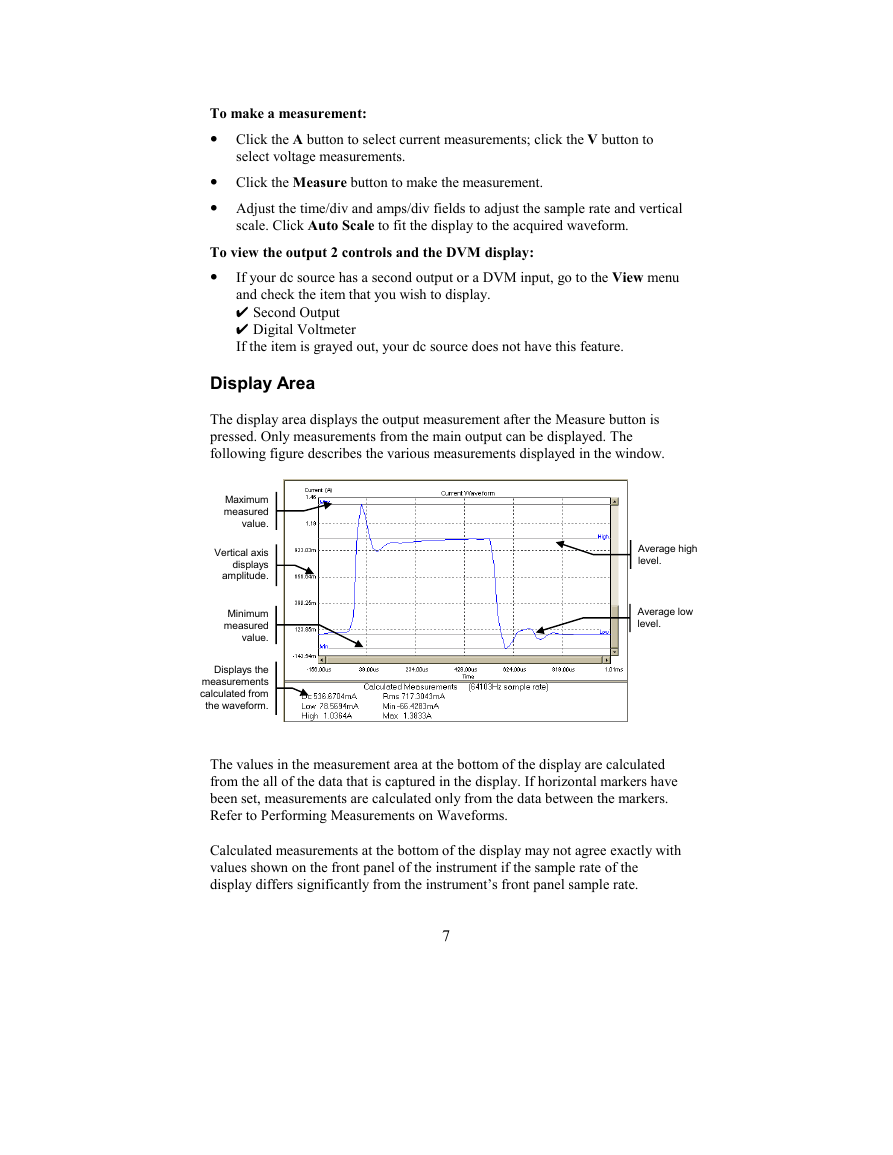
Display Area
The display area displays the output measurement after the Measure button is
pressed. Only measurements from the main output can be displayed. The
following figure describes the various measurements displayed in the window.
Maximum
measured
value.
Vertical axis
displays
amplitude.
Minimum
measured
value.
Displays the
measurements
calculated from
the waveform.
Average high
level.
Average low
level.
The values in the measurement area at the bottom of the display are calculated
from the all of the data that is captured in the display. If horizontal markers have
been set, measurements are calculated only from the data between the markers.
Refer to Performing Measurements on Waveforms.
Calculated measurements at the bottom of the display may not agree exactly with
values shown on the front panel of the instrument if the sample rate of the
display differs significantly from the instrument’s front panel sample rate.
7
�
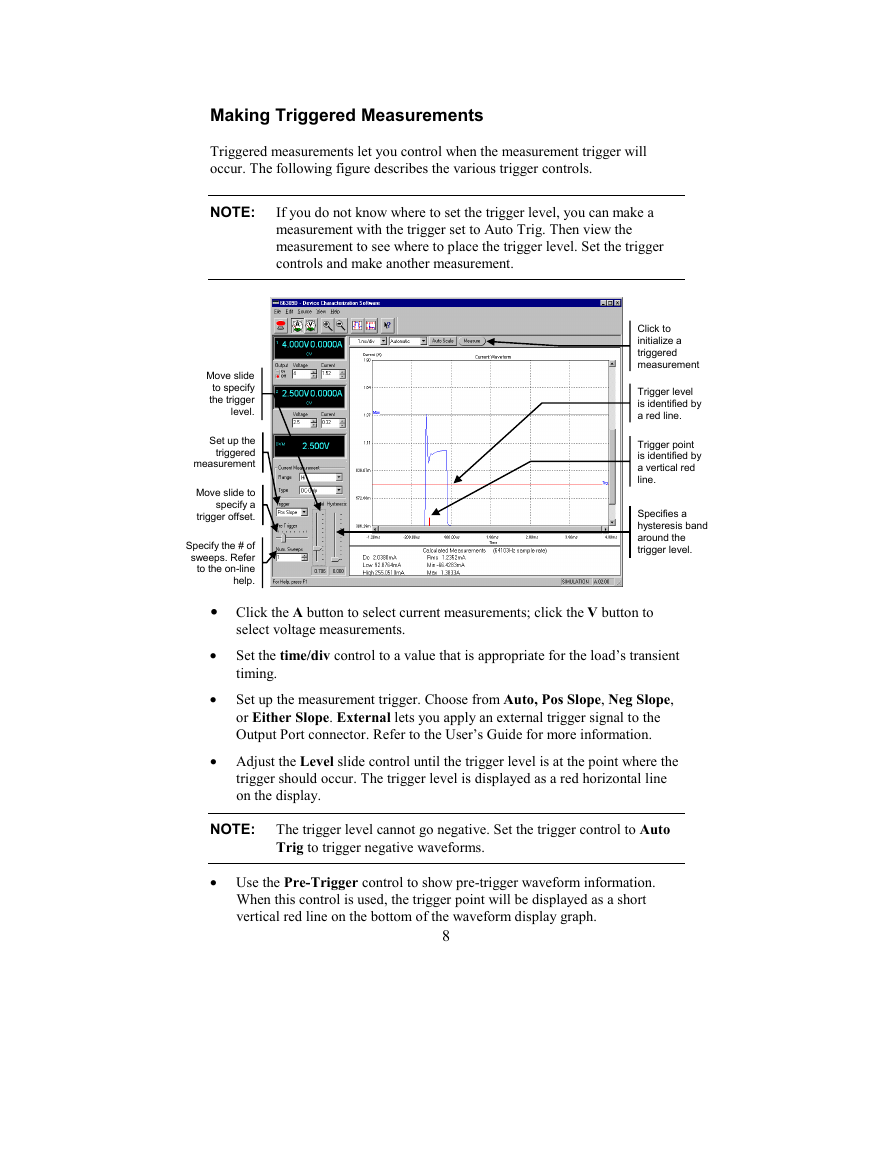
Making Triggered Measurements
Triggered measurements let you control when the measurement trigger will
occur. The following figure describes the various trigger controls.
NOTE:
If you do not know where to set the trigger level, you can make a
measurement with the trigger set to Auto Trig. Then view the
measurement to see where to place the trigger level. Set the trigger
controls and make another measurement.
Move slide
to specify
the trigger
level.
Set up the
triggered
measurement
Move slide to
specify a
trigger offset.
Specify the # of
sweeps. Refer
to the on-line
help.
Click to
initialize a
triggered
measurement
Trigger level
is identified by
a red line.
Trigger point
is identified by
a vertical red
line.
Specifies a
hysteresis band
around the
trigger level.
Click the A button to select current measurements; click the V button to
select voltage measurements.
• Set the time/div control to a value that is appropriate for the load’s transient
timing.
• Set up the measurement trigger. Choose from Auto, Pos Slope, Neg Slope,
or Either Slope. External lets you apply an external trigger signal to the
Output Port connector. Refer to the User’s Guide for more information.
• Adjust the Level slide control until the trigger level is at the point where the
trigger should occur. The trigger level is displayed as a red horizontal line
on the display.
NOTE: The trigger level cannot go negative. Set the trigger control to Auto
Trig to trigger negative waveforms.
• Use the Pre-Trigger control to show pre-trigger waveform information.
When this control is used, the trigger point will be displayed as a short
vertical red line on the bottom of the waveform display graph.
8
�


 2023年江西萍乡中考道德与法治真题及答案.doc
 2012年重庆南川中考生物真题及答案.doc
 2013年江西师范大学地理学综合及文艺理论基础考研真题.doc
 2020年四川甘孜小升初语文真题及答案I卷.doc
 2020年注册岩土工程师专业基础考试真题及答案.doc
 2023-2024学年福建省厦门市九年级上学期数学月考试题及答案.doc
 2021-2022学年辽宁省沈阳市大东区九年级上学期语文期末试题及答案.doc
 2022-2023学年北京东城区初三第一学期物理期末试卷及答案.doc
 2018上半年江西教师资格初中地理学科知识与教学能力真题及答案.doc
 2012年河北国家公务员申论考试真题及答案-省级.doc
 2020-2021学年江苏省扬州市江都区邵樊片九年级上学期数学第一次质量检测试题及答案.doc
 2022下半年黑龙江教师资格证中学综合素质真题及答案.doc