$FLA
Munich Personal RePEc Archive
Simplifying the estimation of difference
in differences treatment effects with
Stata
Juan M. Villa
Brooks World Poverty Institute, University of Manchester
November 2012
Online at https://mpra.ub.uni-muenchen.de/43943/
MPRA Paper No. 43943, posted 22. January 2013 22:59 UTC
�
Simplifying the Estimation of Difference in Differences Treatment Effects with Stata*
JuanM.Villa
BrooksWorldPovertyInstitute
UniversityofManchester
Manchester,UK.
juan.villalora@postgrad.manchester.ac.uk
***DRAFTVERSION***
1. Introduction
Abstract.ThispaperexplainstheinsightsoftheStata'suserwrittencommand difffor
theestimationofDifferenceinDifferencestreatmenteffects(DID).Theoptionsandthe
formulasaredetailedforthesingleDID,KernelPropensityScoreDID,QuantileDIDandthe
balancingproperties.Anexampleofthefeaturesof diffispresentedbyusingthedataset
fromCardandKrueger(1994).
Keywords:Differenceindifferences,causalinference,kernelpropensityscore,quantile
treatmenteffects,quasi-experiments.
DifferenceinDifferencestreatmenteffects(DID)havebeenwidelyusedwhenthe
evaluationofagiveninterventionentailsthecollectionofpaneldataorrepeatedcross
sections.DIDintegratestheadvancesofthefixedeffectsestimatorswiththecausal
inferenceanalysiswhenunobservedeventsorcharacteristicsconfoundtheinterpretations
(AngristandPischke,2008).
Despitetheexistenceofotherplausiblemethodsbasedontheavailabilityofobservational
dataforquasi-experimentalcausalinference-i.e.matchingmethods,instrumentalvariable,
regressiondiscontinuity-,DIDestimationsofferanalternativereachingthe
unconfoundednessbycontrollingforunobservedcharacteristicsandcombiningitwith
observedorcomplementaryinformation.Additionally,theDIDisaflexibleformofcausal
inferencebecauseitcanbecombinedwithsomeotherprocedures,suchastheKernel
*Apreviousversionofthispaperwaspresentedatthe2012UKStataUsersGroupMeetinginLondon,UK.
Thisversion:November,2012.
�
2. diff syntax and equations
ssc install diff, replace
PropensityScore(Heckmanetal.,1997,1998)andthequintileregression(Meyeretal.,
1995).
Inthispaper,theStata'scommand diffisexplainedandsomedetailsonits
implementationaregivenbyusingthedatasetsfromtheCardandKrueger(1994)article
ontheeffectsoftheincreaseintheminimumwage.Similarly,itisexplainhowthe
balancingpropertiescanbetestedwhenobservationaldataisprovided.
InthenextsectiontheequationsbehindtheestimationoftheDIDareexplainedalongwith
thefeaturesofthe diffcommand.Inthethirdsectionandexampleisprovidedand,inthe
fourthsection,thebalancingpropertiesaretestedwiththeoptionsthatcanbespecified
withthecommand.
diffcanbeinstalledorupdatedfromtheSSCarchivebyrunningthecommand:
The diffsyntaxisdetailedasfollows:
Thecommandrequeststhespecificationoftheoutcomevariable(outcome_var)and
allowstheuseofweights,exceptforsomeoptions.Theinitialrequiredoptionisthe
period(varname),whichcontainsadummyvariableindicatingthebaseline(period==0)
andafollow-up(period==1)periods.Additionally,theoption treated(varname),is
need,containingadummyvariablewiththeindicatorofthecontrol(treated==0)and
treated(treated==1)individuals.
Fortheindividual,thisinitialsettingperformsthefollowinglinearregression:
Theestimatedcoefficientshavethefollowinginterpretation:
:Isthemeanoutcomeforthecontrolgrouponthebaseline.
:Isthemeanoutcomeforthecontrolgroupinthefollow-up.
:Isthesingledifferencebetweentreatedandcontrolgroupsonthebaseline.
:Isthemeanoutcomeforthetreatedgrouponthebaseline.
:Isthemeanoutcomeforthetreatedgroupinthefollow-up.
diff outcome_var [if] [in] [weight] ,[ options]
�
:IstheDIDorimpact.
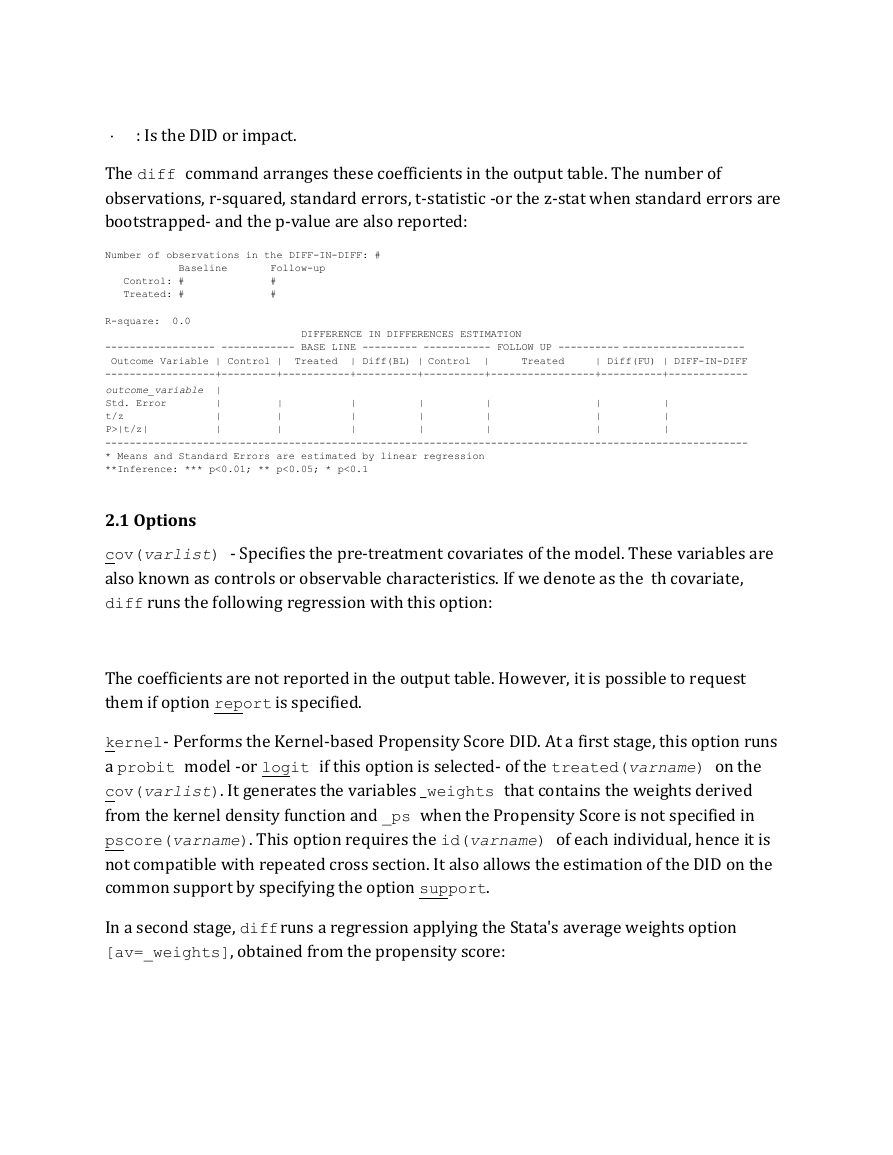
The diffcommandarrangesthesecoefficientsintheoutputtable.Thenumberof
observations,r-squared,standarderrors,t-statistic-orthez-statwhenstandarderrorsare
bootstrapped-andthep-valuearealsoreported:
Number of observations in the DIFF-IN-DIFF: #
Baseline
Control: #
Treated: #
R-square:
0.0
Follow-up
#
#
DIFFERENCE IN DIFFERENCES ESTIMATION
Treated
| Diff(BL) | Control
------------------ ------------ BASE LINE --------- ----------- FOLLOW UP ---------- --------------------
Outcome Variable | Control |
| Diff(FU) | DIFF-IN-DIFF
------------------+---------+-----------+----------+----------+-----------------+----------+-------------
outcome_variable
Std. Error
t/z
P>|t/z|
---------------------------------------------------------------------------------------------------------
* Means and Standard Errors are estimated by linear regression
**Inference: *** p<0.01; ** p<0.05; * p<0.1
Treated
|
|
|
|
|
|
|
|
|
|
|
|
|
|
|
|
|
|
|
|
|
|
|
2.1 Options
cov(varlist)-Specifiesthepre-treatmentcovariatesofthemodel.Thesevariablesare
alsoknownascontrolsorobservablecharacteristics.Ifwedenoteasthethcovariate,
diffrunsthefollowingregressionwiththisoption:
Thecoefficientsarenotreportedintheoutputtable.However,itispossibletorequest
themifoption reportisspecified.
kernel-PerformstheKernel-basedPropensityScoreDID.Atafirststage,thisoptionruns
a probitmodel-or logitifthisoptionisselected-ofthe treated(varname)onthe
cov(varlist).Itgeneratesthevariables_weightsthatcontainstheweightsderived
fromthekerneldensityfunctionand _pswhenthePropensityScoreisnotspecifiedin
pscore(varname).Thisoptionrequiresthe id(varname)ofeachindividual,henceitis
notcompatiblewithrepeatedcrosssection.ItalsoallowstheestimationoftheDIDonthe
commonsupportbyspecifyingtheoption support.
Inasecondstage, diffrunsaregressionapplyingtheStata'saverageweightsoption
[av=_weights],obtainedfromthepropensityscore:
�
Option kernelcanbecustomizedbyselectionthebandwidth, bw(#)andthekerneltype,
ktype(kernel),accordingtotheStata's kdensitychoices.Finally,thefirststageis
explicitlyshowedif reportisspecified.
qdid(quantile)-PerformstheQuantileDifferenceinDifferencesestimationatthe
specifiedquantilefrom0.1to0.9(quantile0.5performstheQDIDatthemedeian).Itmay
becombinedwith kerneland cov(varlist)options. qdid(quantile)doesnot
supportweightsnorrobuststandarderrors.ThisoptionusesStata's qreg and bsqreg
forbootstrappedstandarderrors.SeeAngristandPischke(2008)fordetailedinformation
onQuantileTreatmentEffectsandMeyeretal.(1995)foraillustrativeexample.
cluster(varname)-Calculatesclusteredstandarderrorsby varname.
robust-CalculatesrobustStd.Errors.
bs-PerformsaBootstrapestimationofcoefficientsandstandarderrors. reps(int)
specifiesthenumberofrepetitionswhenthebsisselected.Thedefaultare50repetitions.
nostar-Removestheinferencestarsfromthep-values.
test-Performsabalancingt-testofdifferenceinmeansofthespecifiedcovariates
betweenthecontrolandtreatedgroupsin period == 0.Theoptiontestcombinedwith
kernelperformsthebalancingt-testwiththeweightedcovariates.Stata's ttest
commandisusedtoestimatethet-statisticsandstandarderrors.
Foreachvariablein cov(varlist), testoptionrunsthecommand:
Whencombinedwith kernel,thedifferences,t-statisticsandstandarderrorsare
generatedwithlinearregression.
diffoffersanexamplewiththedatasetfromCardandKrueger(1994).Itcanbe
downloadedintotheworkingdirectorybyrunning net get diffandthen, use
cardkrueger1994,clear.Inthiscase,theauthorsstudytheimpactoftheincreaseinthe
minimumwageinthestateofNewJersey-thetreatedgroup-ontheemploymentlevelat
thefastfoodindustry.Theycomparethechangesinthenumberofemployeesatthe
restaurantsinthistreatedgrouptotheonesoftheneighborstate,Pennsylvania-the
controlgroup-.TheycollectabaselineinFebruary,1992,andafollow-upinNovember.
ttest cov(varname) if period == 0, by(treated)
2.2 Option: balancing test
3. Example
�
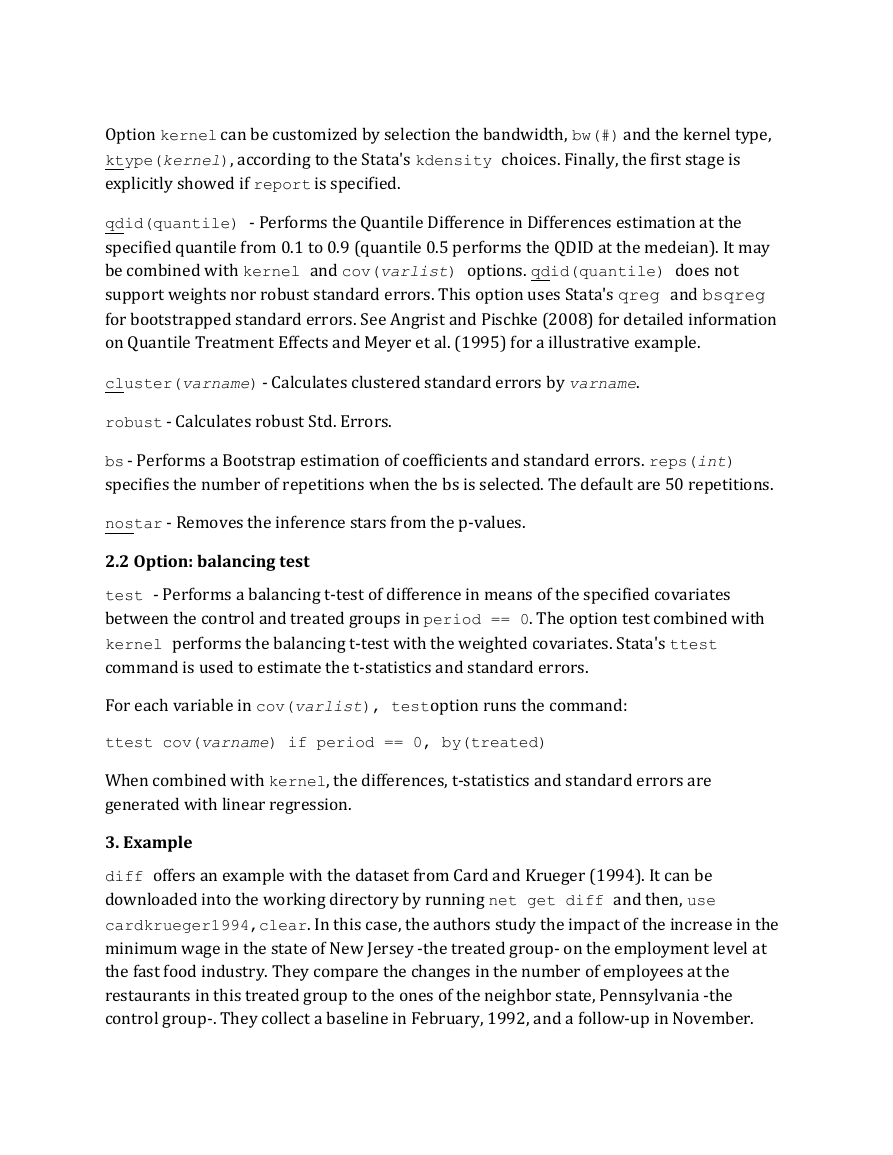
Thedescriptionofthevariablesinthedatasetareisthefollowing:
Contains data from cardkrueger1994.dta
label
value
type
820
8
format
treated
variable label
18,860 (99.9% of memory free)
Dataset from Card&Krueger (1994)
%8.0g
int
%8.0g
byte
long
%8.0g
float %9.0g
%8.0g
byte
byte
%8.0g
%8.0g
byte
byte
%8.0g
obs:
vars:
size:
-----------------------------------------------------------------------------------------------------------
storage display
variable name
-----------------------------------------------------------------------------------------------------------
id
t
treated
fte
bk
kfc
roys
wendys
-----------------------------------------------------------------------------------------------------------
Sorted by: id
Store ID
Feb. 1992 = 0; Nov. 1992 = 1
New Jersey = 1; Pennsylvania = 0
Output: Full Time Employment
Burger King == 1
Kentuky Fried Chiken == 1
Roy Rogers == 1
Wendy's == 1
With820observations,thenumberofindividualsorstoresare331and79inthetreated
andcontrolgroups,respectively.Theoutcomevariableisfte,whilesomecovariatesare
definedasdummyvariableindicatingwhethertheobservationbelongstoagivenfastfood
restaurant.Thebasicstatisticareshowasfollows:
Variable |
Std. Dev.
Min
Max
Obs
Mean
t
-------------+--------------------------------------------------------
522
1
1
80
1
1
1
1
-------------+--------------------------------------------------------
id |
t |
treated |
fte |
bk |
kfc |
roys |
wendys |
148.1413
.5003052
.3946469
9.022517
.4933761
.3965364
.4282318
.3536639
246.5073
.5
.8073171
17.59457
.4170732
.195122
.2414634
.1463415
820
820
820
801
820
820
820
820
1
0
0
0
0
0
0
0
3.1 DID with no covariates
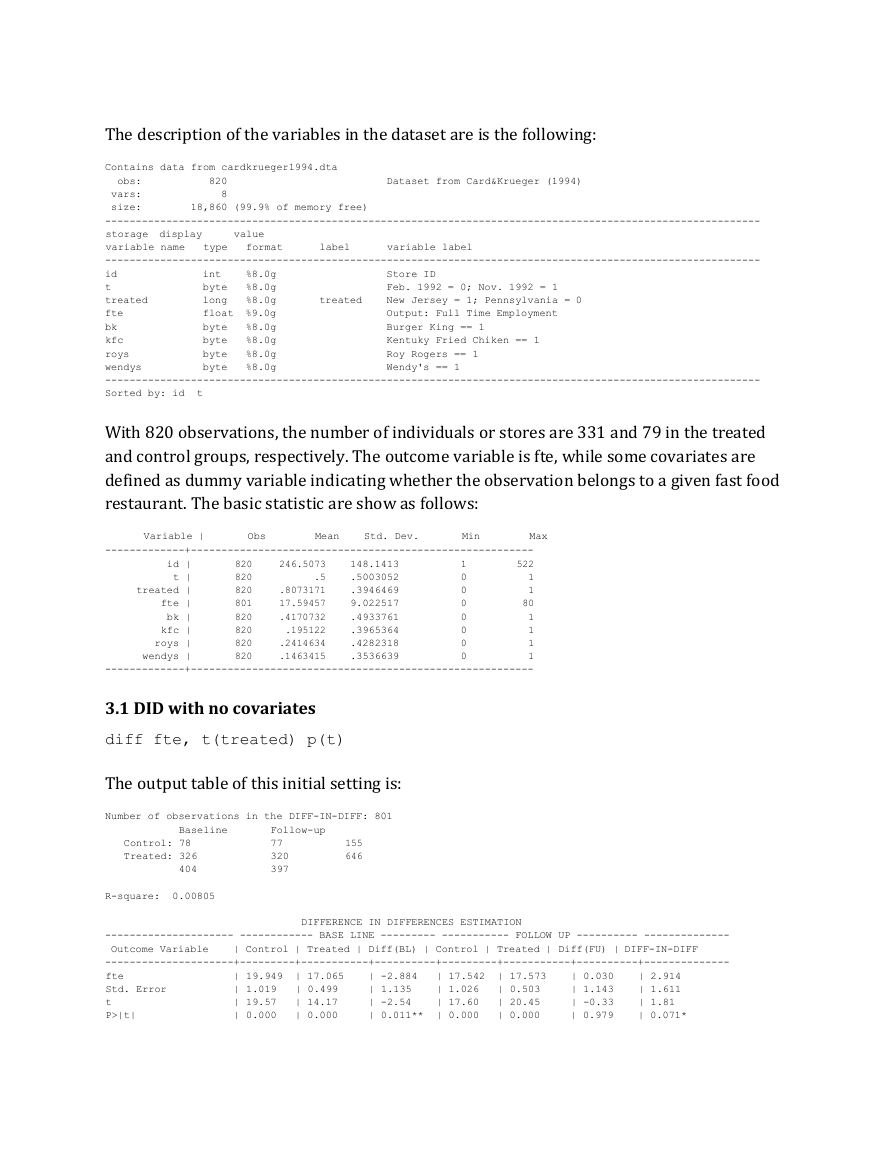
diff fte, t(treated) p(t)
Theoutputtableofthisinitialsettingis:
Number of observations in the DIFF-IN-DIFF: 801
Baseline
Control: 78
Treated: 326
404
Follow-up
77
320
397
155
646
R-square:
0.00805
DIFFERENCE IN DIFFERENCES ESTIMATION
| Control | Treated | Diff(BL) | Control | Treated | Diff(FU) | DIFF-IN-DIFF
--------------------- ------------ BASE LINE --------- ----------- FOLLOW UP ---------- --------------
Outcome Variable
---------------------+---------+-----------+----------+---------+-----------+----------+--------------
fte
Std. Error
t
P>|t|
| -2.884
| 1.135
| -2.54
| 0.011**
| 17.573
| 0.503
| 20.45
| 0.000
| 17.542
| 1.026
| 17.60
| 0.000
| 2.914
| 1.611
| 1.81
| 0.071*
| 19.949
| 1.019
| 19.57
| 0.000
| 17.065
| 0.499
| 14.17
| 0.000
| 0.030
| 1.143
| -0.33
| 0.979
�
------------------------------------------------------------------------------------------------------
* Means and Standard Errors are estimated by linear regression
**Inference: *** p<0.01; ** p<0.05; * p<0.1
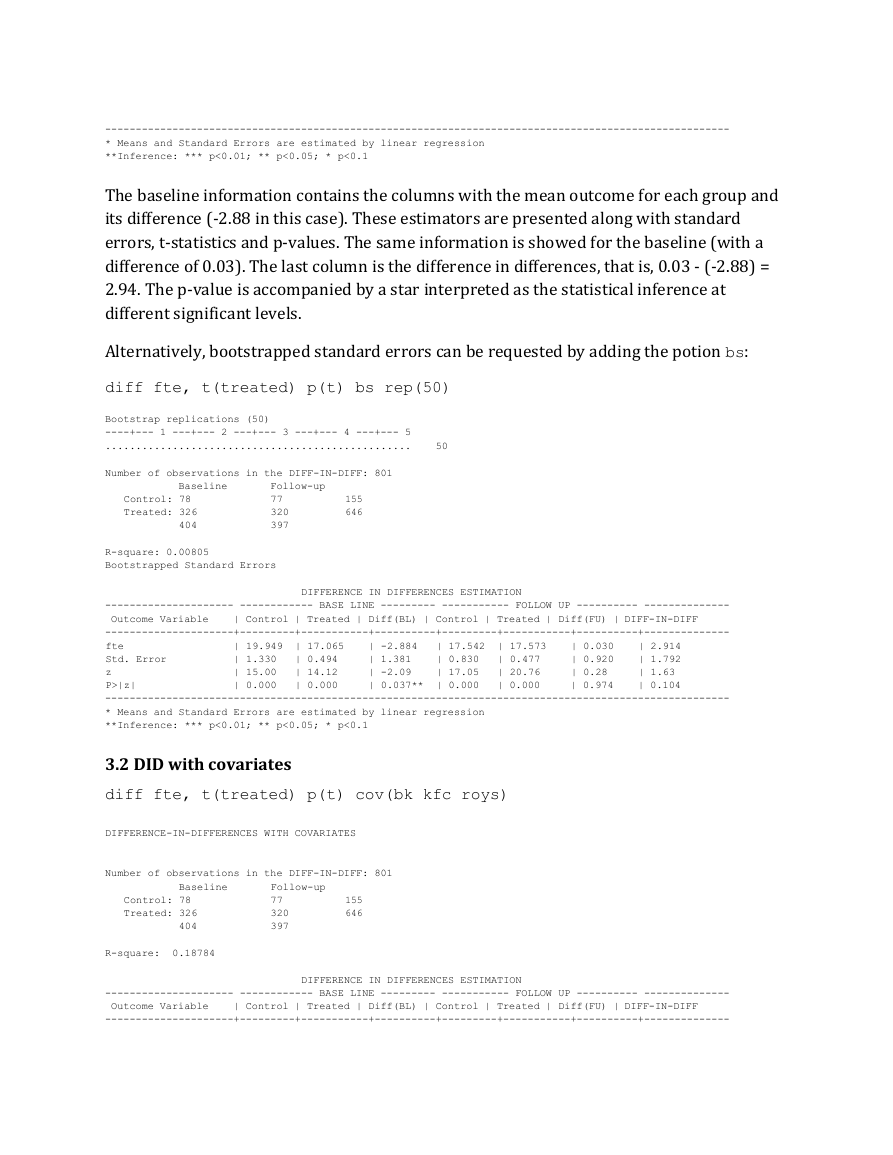
Thebaselineinformationcontainsthecolumnswiththemeanoutcomeforeachgroupand
itsdifference(-2.88inthiscase).Theseestimatorsarepresentedalongwithstandard
errors,t-statisticsandp-values.Thesameinformationisshowedforthebaseline(witha
differenceof0.03).Thelastcolumnisthedifferenceindifferences,thatis,0.03-(-2.88)=
2.94.Thep-valueisaccompaniedbyastarinterpretedasthestatisticalinferenceat
differentsignificantlevels.
Alternatively,bootstrappedstandarderrorscanberequestedbyaddingthepotion bs:
diff fte, t(treated) p(t) bs rep(50)
Bootstrap replications (50)
----+--- 1 ---+--- 2 ---+--- 3 ---+--- 4 ---+--- 5
..................................................
50
Number of observations in the DIFF-IN-DIFF: 801
Baseline
Control: 78
Treated: 326
404
Follow-up
77
320
397
155
646
R-square: 0.00805
Bootstrapped Standard Errors
DIFFERENCE IN DIFFERENCES ESTIMATION
| Control | Treated | Diff(BL) | Control | Treated | Diff(FU) | DIFF-IN-DIFF
--------------------- ------------ BASE LINE --------- ----------- FOLLOW UP ---------- --------------
Outcome Variable
---------------------+---------+-----------+----------+---------+-----------+----------+--------------
fte
Std. Error
z
P>|z|
------------------------------------------------------------------------------------------------------
* Means and Standard Errors are estimated by linear regression
**Inference: *** p<0.01; ** p<0.05; * p<0.1
| -2.884
| 1.381
| -2.09
| 0.037**
| 19.949
| 1.330
| 15.00
| 0.000
| 17.542
| 0.830
| 17.05
| 0.000
| 17.573
| 0.477
| 20.76
| 0.000
| 0.030
| 0.920
| 0.28
| 0.974
| 2.914
| 1.792
| 1.63
| 0.104
| 17.065
| 0.494
| 14.12
| 0.000
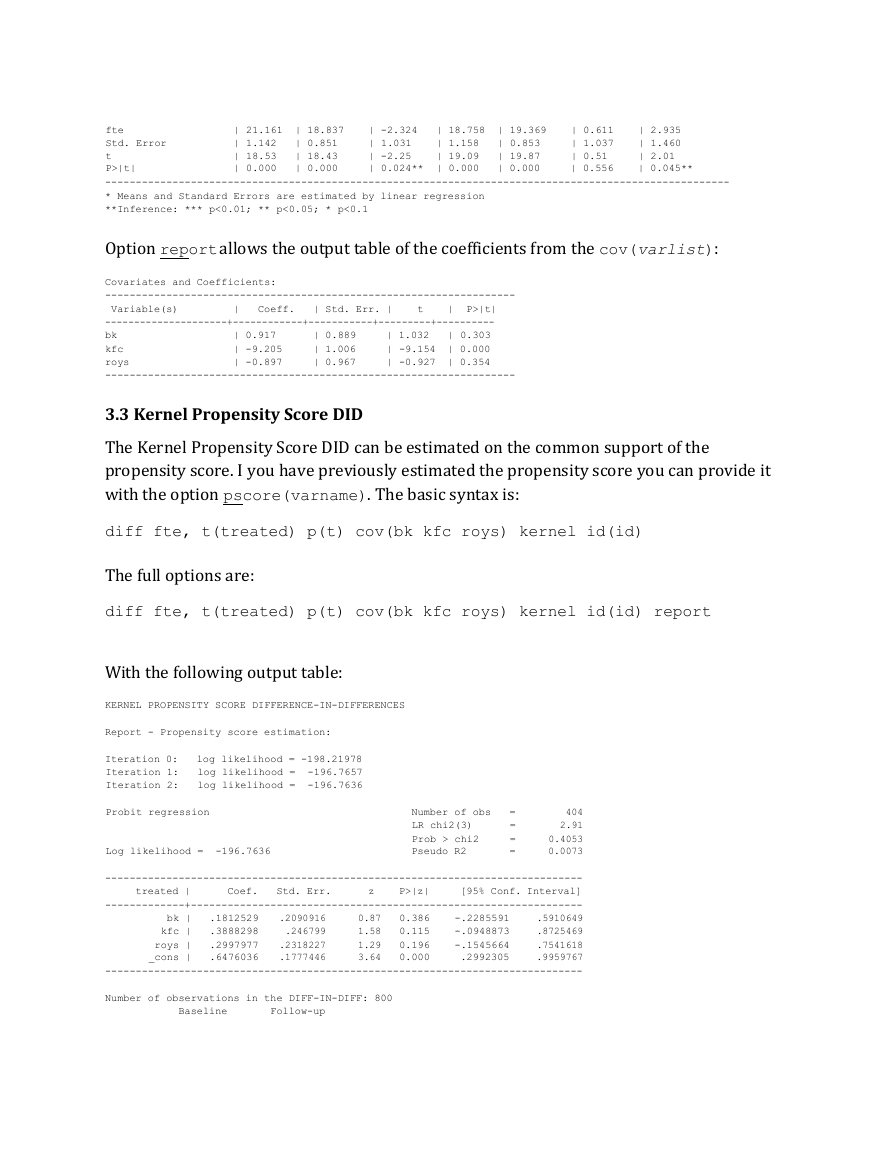
3.2 DID with covariates
diff fte, t(treated) p(t) cov(bk kfc roys)
DIFFERENCE-IN-DIFFERENCES WITH COVARIATES
Number of observations in the DIFF-IN-DIFF: 801
Baseline
Control: 78
Treated: 326
404
Follow-up
77
320
397
155
646
R-square:
0.18784
--------------------- ------------ BASE LINE --------- ----------- FOLLOW UP ---------- --------------
Outcome Variable
---------------------+---------+-----------+----------+---------+-----------+----------+--------------
| Control | Treated | Diff(BL) | Control | Treated | Diff(FU) | DIFF-IN-DIFF
DIFFERENCE IN DIFFERENCES ESTIMATION
�
| 18.837
| 0.851
| 18.43
| 0.000
| 21.161
| 1.142
| 18.53
| 0.000
| 18.758
| 1.158
| 19.09
| 0.000
| -2.324
| 1.031
| -2.25
| 0.024**
fte
Std. Error
t
P>|t|
------------------------------------------------------------------------------------------------------
* Means and Standard Errors are estimated by linear regression
**Inference: *** p<0.01; ** p<0.05; * p<0.1
Option reportallowstheoutputtableofthecoefficientsfromthe cov(varlist):
| 2.935
| 1.460
| 2.01
| 0.045**
| 19.369
| 0.853
| 19.87
| 0.000
| 0.611
| 1.037
| 0.51
| 0.556
Covariates and Coefficients:
-------------------------------------------------------------------
Variable(s)
P>|t|
---------------------+------------+-----------+---------+----------
bk
| 0.303
| 0.000
kfc
roys
| 0.354
-------------------------------------------------------------------
| 1.032
| -9.154
| -0.927
| 0.917
| -9.205
| -0.897
| 0.889
| 1.006
| 0.967
| Std. Err. |
Coeff.
t
|
|
3.3 Kernel Propensity Score DID
diff fte, t(treated) p(t) cov(bk kfc roys) kernel id(id)
TheKernelPropensityScoreDIDcanbeestimatedonthecommonsupportofthe
propensityscore.Iyouhavepreviouslyestimatedthepropensityscoreyoucanprovideit
withtheoption pscore(varname).Thebasicsyntaxis:
Thefulloptionsare:
Withthefollowingoutputtable:
diff fte, t(treated) p(t) cov(bk kfc roys) kernel id(id) report
KERNEL PROPENSITY SCORE DIFFERENCE-IN-DIFFERENCES
Report - Propensity score estimation:
Iteration 0:
Iteration 1:
Iteration 2:
log likelihood = -198.21978
log likelihood = -196.7657
log likelihood = -196.7636
Probit regression
Log likelihood = -196.7636
Number of obs
LR chi2(3)
Prob > chi2
Pseudo R2
=
=
=
=
404
2.91
0.4053
0.0073
Coef.
Std. Err.
treated |
------------------------------------------------------------------------------
[95% Conf. Interval]
-------------+----------------------------------------------------------------
.5910649
.8725469
.7541618
.9959767
------------------------------------------------------------------------------
-.2285591
-.0948873
-.1545664
.2992305
.1812529
.3888298
.2997977
.6476036
.2090916
.246799
.2318227
.1777446
bk |
kfc |
roys |
_cons |
0.386
0.115
0.196
0.000
0.87
1.58
1.29
3.64
P>|z|
z
Number of observations in the DIFF-IN-DIFF: 800
Baseline
Follow-up
�




 2023年江西萍乡中考道德与法治真题及答案.doc
 2012年重庆南川中考生物真题及答案.doc
 2013年江西师范大学地理学综合及文艺理论基础考研真题.doc
 2020年四川甘孜小升初语文真题及答案I卷.doc
 2020年注册岩土工程师专业基础考试真题及答案.doc
 2023-2024学年福建省厦门市九年级上学期数学月考试题及答案.doc
 2021-2022学年辽宁省沈阳市大东区九年级上学期语文期末试题及答案.doc
 2022-2023学年北京东城区初三第一学期物理期末试卷及答案.doc
 2018上半年江西教师资格初中地理学科知识与教学能力真题及答案.doc
 2012年河北国家公务员申论考试真题及答案-省级.doc
 2020-2021学年江苏省扬州市江都区邵樊片九年级上学期数学第一次质量检测试题及答案.doc
 2022下半年黑龙江教师资格证中学综合素质真题及答案.doc