HW2
Due Date: Dec. 8
Submission requirements:
Please submit your solutions to our class website. Only hand in what is required
below.
Part I: 书面作业:
1.
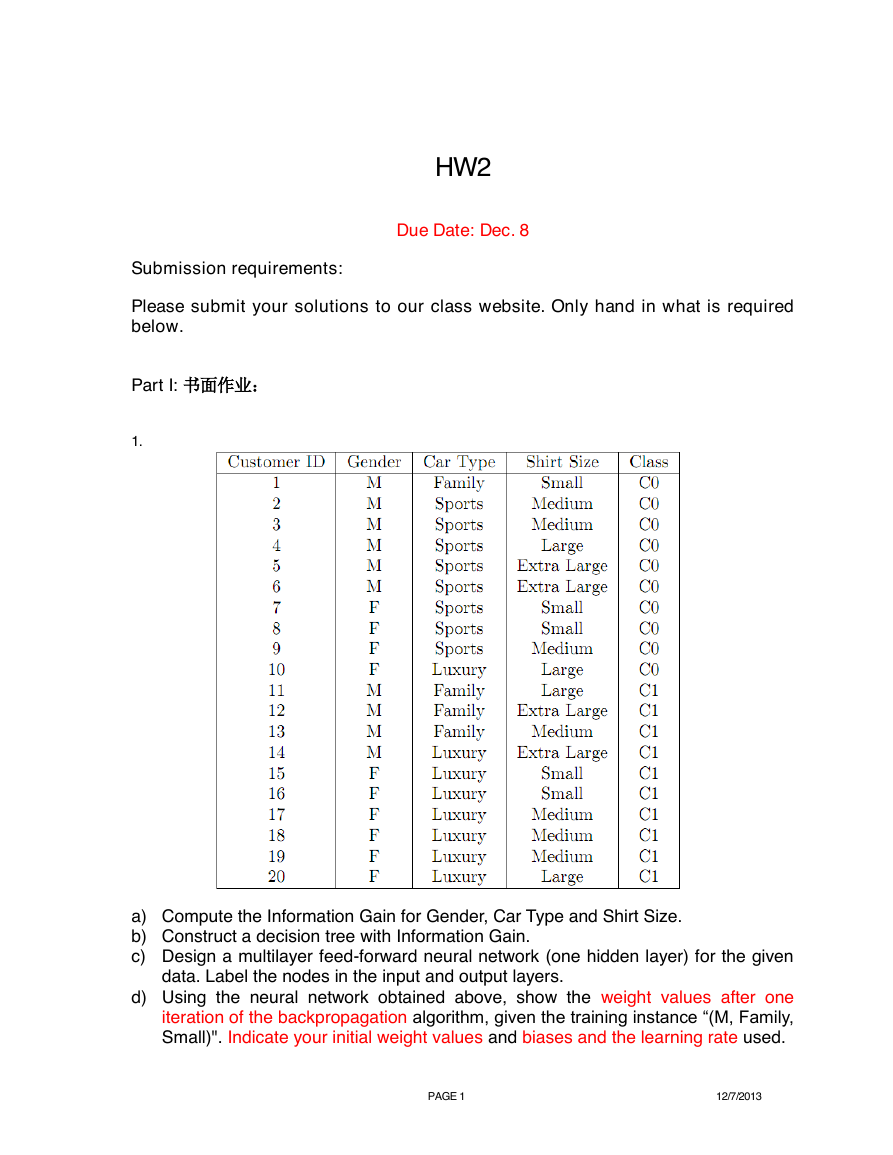
a) Compute the Information Gain for Gender, Car Type and Shirt Size.
b) Construct a decision tree with Information Gain.
c) Design a multilayer feed-forward neural network (one hidden layer) for the given
data. Label the nodes in the input and output layers.
d) Using the neural network obtained above, show the weight values after one
iteration of the backpropagation algorithm, given the training instance “(M, Family,
Small)". Indicate your initial weight values and biases and the learning rate used.
PAGE 1
12/7/2013
�
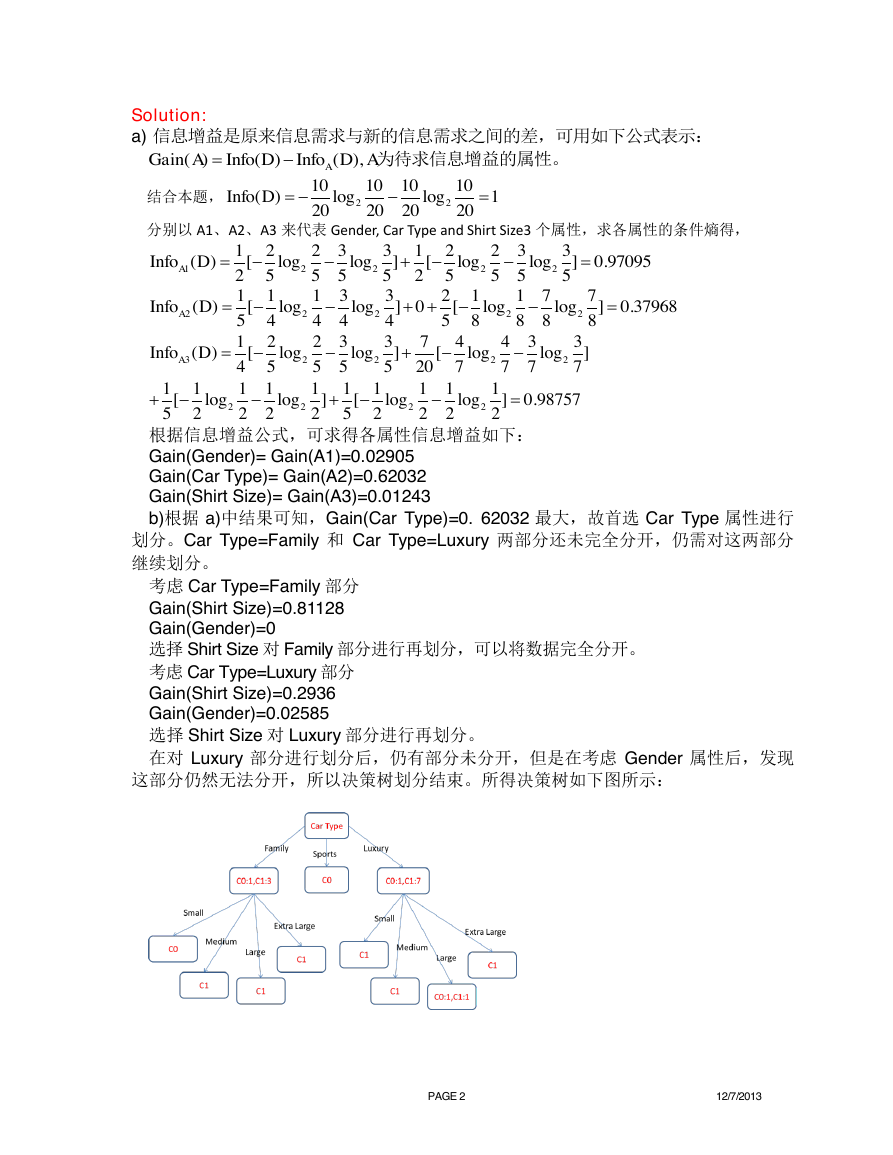
Solution:
a)
结合本题,
分别以 A1、A2、A3 来代表 Gender, Car Type and Shirt Size3 个属性,求各属性的条件熵得,
根据信息增益公式,可求得各属性信息增益如下:
Gain(Gender)= Gain(A1)=0.02905
Gain(Car Type)= Gain(A2)=0.62032
Gain(Shirt Size)= Gain(A3)=0.01243
b)根据 a)中结果可知,Gain(Car Type)=0. 62032 最大,故首选 Car Type 属性进行
划分。Car Type=Family 和 Car Type=Luxury 两部分还未完全分开,仍需对这两部分
继续划分。
考虑 Car Type=Family 部分
Gain(Shirt Size)=0.81128
Gain(Gender)=0
选择 Shirt Size 对 Family 部分进行再划分,可以将数据完全分开。
考虑 Car Type=Luxury 部分
Gain(Shirt Size)=0.2936
Gain(Gender)=0.02585
选择 Shirt Size 对 Luxury 部分进行再划分。
在对 Luxury 部分进行划分后,仍有部分未分开,但是在考虑 Gender 属性后,发现
这部分仍然无法分开,所以决策树划分结束。所得决策树如下图所示:
PAGE 2
12/7/2013
信息增益是原来信息需求与新的信息需求之间的差,可用如下公式表示:()()(),AGainAInfoDInfoDA为待求信息增益的属性。2210101010()loglog120202020InfoD122221223312233()[loglog][loglog]0.970952555525555AInfoD222221113321177()[loglog]0[loglog]0.379685444458888AInfoD3222222221223374433()[loglog][loglog]455552077771111111111[loglog][loglog]0.987575222252222AInfoD�
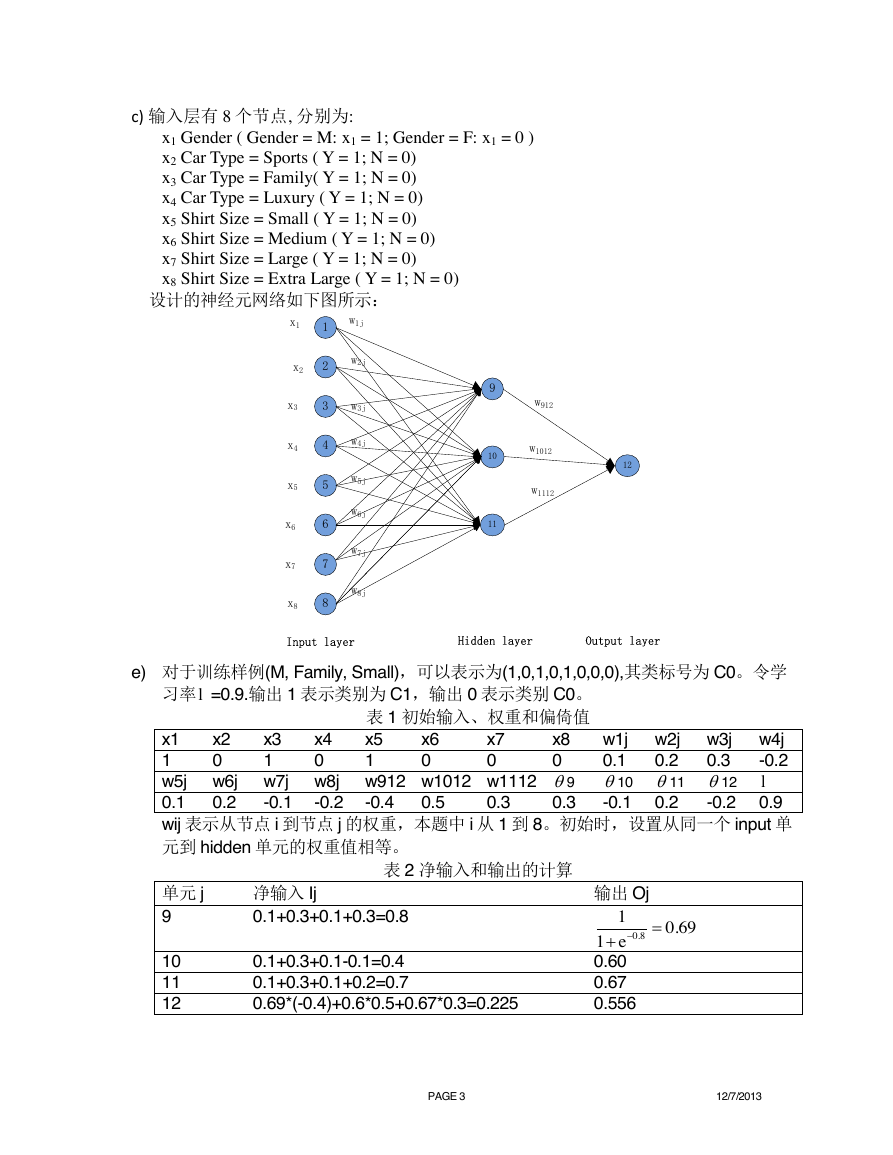
c) 输入层有 8 个节点, 分别为:
x1 Gender ( Gender = M: x1 = 1; Gender = F: x1 = 0 )
x2 Car Type = Sports ( Y = 1; N = 0)
x3 Car Type = Family( Y = 1; N = 0)
x4 Car Type = Luxury ( Y = 1; N = 0)
x5 Shirt Size = Small ( Y = 1; N = 0)
x6 Shirt Size = Medium ( Y = 1; N = 0)
x7 Shirt Size = Large ( Y = 1; N = 0)
x8 Shirt Size = Extra Large ( Y = 1; N = 0)
设计的神经元网络如下图所示:
e) 对于训练样例(M, Family, Small),可以表示为(1,0,1,0,1,0,0,0),其类标号为 C0。令学
习率 =0.9.输出 1 表示类别为 C1,输出 0 表示类别 C0。
表 1 初始输入、权重和偏倚值
x5
1
x6
0
x2
0
x4
0
x7
0
x3
1
x1
1
w5j w6j w7j w8j w912 w1012 w1112
0.1
-0.2 0.9
wij 表示从节点 i 到节点 j 的权重,本题中 i 从 1 到 8。初始时,设置从同一个 input 单
元到 hidden 单元的权重值相等。
w1j w2j w3j w4j
0.1
-0.2
10
0.2
11
-0.1 0.2
0.3
12
9
0.3
x8
0
-0.2
-0.4
0.5
0.2
-0.1
0.3
单元 j
9
净输入 Ij
0.1+0.3+0.1+0.3=0.8
表 2 净输入和输出的计算
10
11
12
0.1+0.3+0.1-0.1=0.4
0.1+0.3+0.1+0.2=0.7
0.69*(-0.4)+0.6*0.5+0.67*0.3=0.225
输出 Oj
0.60
0.67
0.556
PAGE 3
12/7/2013
21345678x1x2x3x4x5x6x7x891011w1jw2jw3jw4jw5jw6jw7jw8j12w912w1012w1112Input layerHidden layerOutput layerll0.810.691e�
单元 j
12
9
10
11
权重或偏倚
w19
w110
w111
w29
w210
w211
w39
w310
w311
w49
w410
w411
w59
w510
w511
w69
w610
w611
w79
w710
w711
w89
w810
w811
w912
w1012
w1112
9
10
11
12
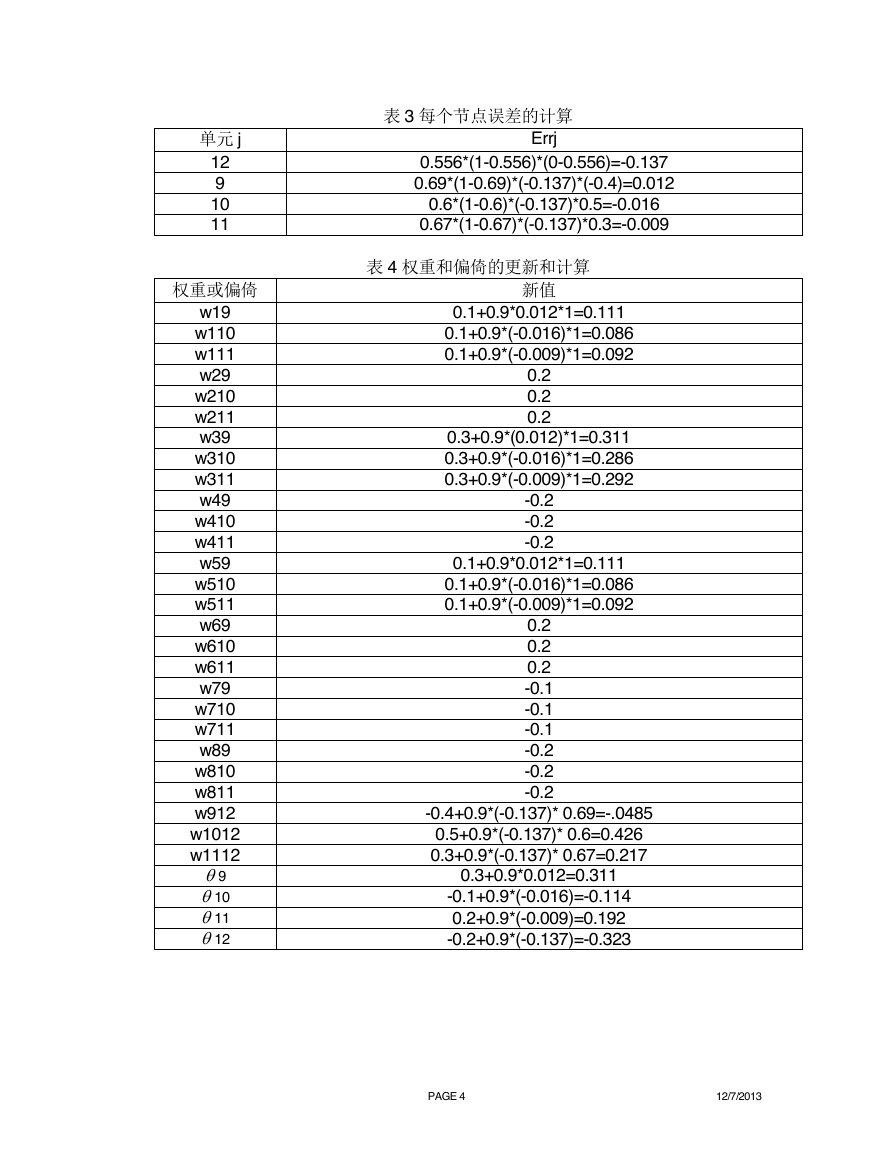
表 3 每个节点误差的计算
Errj
0.556*(1-0.556)*(0-0.556)=-0.137
0.69*(1-0.69)*(-0.137)*(-0.4)=0.012
0.6*(1-0.6)*(-0.137)*0.5=-0.016
0.67*(1-0.67)*(-0.137)*0.3=-0.009
表 4 权重和偏倚的更新和计算
新值
0.1+0.9*0.012*1=0.111
0.1+0.9*(-0.016)*1=0.086
0.1+0.9*(-0.009)*1=0.092
0.2
0.2
0.2
0.3+0.9*(0.012)*1=0.311
0.3+0.9*(-0.016)*1=0.286
0.3+0.9*(-0.009)*1=0.292
-0.2
-0.2
-0.2
0.1+0.9*0.012*1=0.111
0.1+0.9*(-0.016)*1=0.086
0.1+0.9*(-0.009)*1=0.092
0.2
0.2
0.2
-0.1
-0.1
-0.1
-0.2
-0.2
-0.2
-0.4+0.9*(-0.137)* 0.69=-.0485
0.5+0.9*(-0.137)* 0.6=0.426
0.3+0.9*(-0.137)* 0.67=0.217
0.3+0.9*0.012=0.311
-0.1+0.9*(-0.016)=-0.114
0.2+0.9*(-0.009)=0.192
-0.2+0.9*(-0.137)=-0.323
PAGE 4
12/7/2013
�
2.
a) Suppose the fraction of undergraduate students who smoke is 15% and the
fraction of graduate students who smoke is 23%. If one-fifth of the college
students are graduate students and the rest are undergraduates, what is the
probability that a student who smokes is a graduate student?
b) Given the information in part (a), is a randomly chosen college student more likely
to be a graduate or undergraduate student?
c) Suppose 30% of the graduate students live in a dorm but only 10% of the
undergraduate students live in a dorm. If a student smokes and lives in the dorm,
is he or she more likely to be a graduate or undergraduate student? You can
assume independence between students who live in a dorm and those who
smoke.
Solution
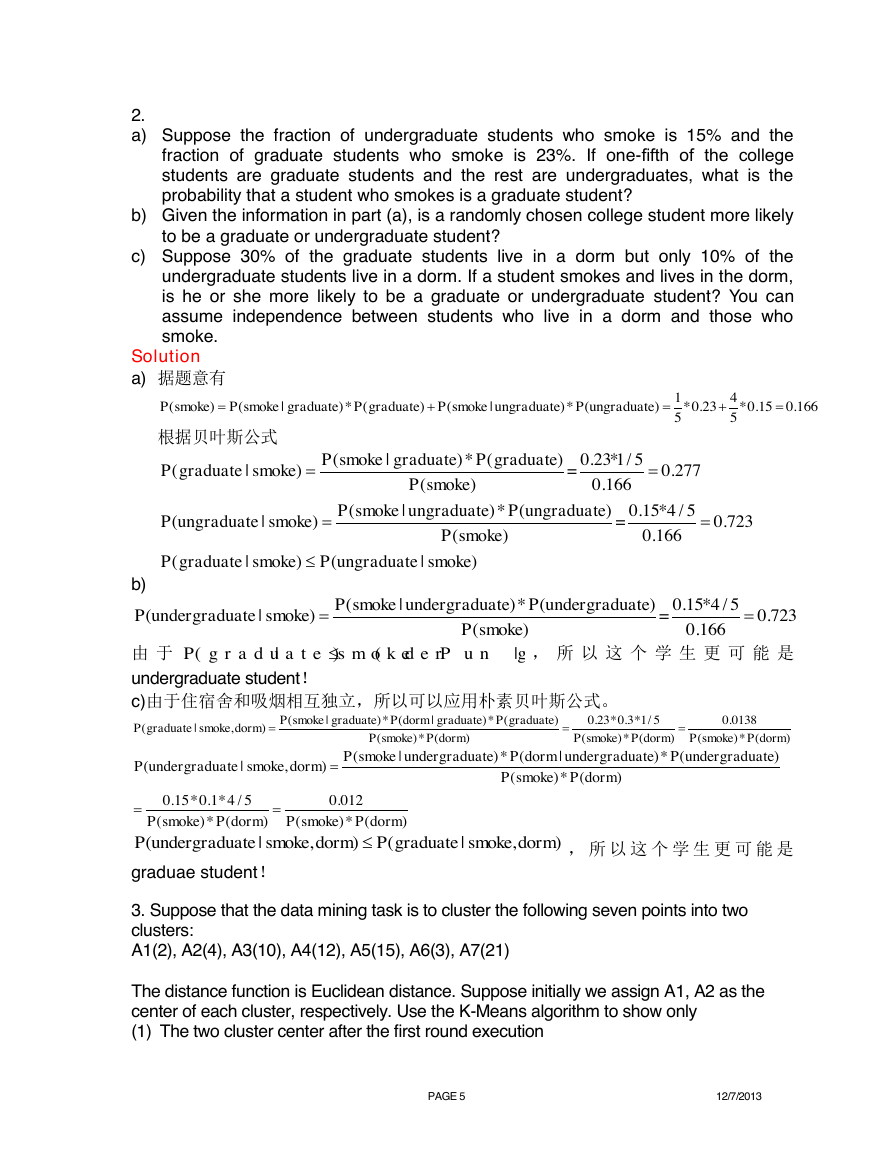
a) 据题意有
根据贝叶斯公式
b)
由 于
undergraduate student!
c)由于住宿舍和吸烟相互独立,所以可以应用朴素贝叶斯公式。
, 所 以 这 个 学 生 更 可 能 是
, 所 以 这 个 学 生 更 可 能 是
graduae student!
3. Suppose that the data mining task is to cluster the following seven points into two
clusters:
A1(2), A2(4), A3(10), A4(12), A5(15), A6(3), A7(21)
The distance function is Euclidean distance. Suppose initially we assign A1, A2 as the
center of each cluster, respectively. Use the K-Means algorithm to show only
(1) The two cluster center after the first round execution
PAGE 5
12/7/2013
14()(|)*()(|)*()*0.23*0.150.16655PsmokePsmokegraduatePgraduatePsmokeungraduatePungraduate(|)*()0.23*1/5(|)=0.277()0.166(|)*()0.15*4/5(|)=0.723()0.166(|)(|)PsmokegraduatePgraduatePgraduatesmokePsmokePsmokeungraduatePungraduatePungraduatesmokePsmokePgraduatesmokePungraduatesmoke(|)*()0.15*4/5(|)=0.723()0.166PsmokeundergraduatePundergraduatePundergraduatesmokePsmoke(|)(der|)PgraduatesmokePungraduatesmoke(|)*(|)*()0.23*0.3*1/50.0138(|,)()*()()*()()*()PsmokegraduatePdormgraduatePgraduatePgraduatesmokedormPsmokePdormPsmokePdormPsmokePdorm(|)*(|)*()(|,)()*()0.15*0.1*4/50.012()*()()*()PsmokeundergraduatePdormundergraduatePundergraduatePundergraduatesmokedormPsmokePdormPsmokePdormPsmokePdorm(|,)(|,)PundergraduatesmokedormPgraduatesmokedorm�
(2) The final two clusters
Solution
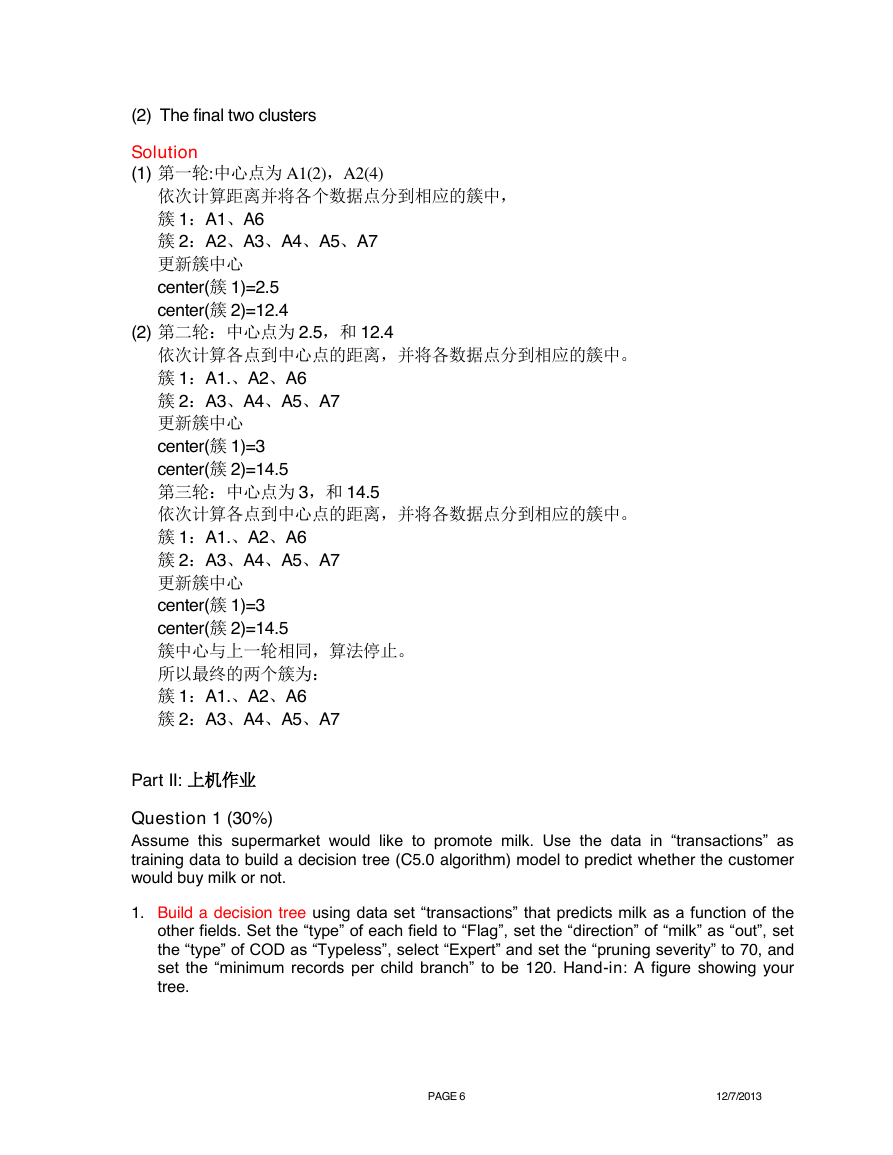
(1) 第一轮:中心点为 A1(2),A2(4)
依次计算距离并将各个数据点分到相应的簇中,
簇 1:A1、A6
簇 2:A2、A3、A4、A5、A7
更新簇中心
center(簇 1)=2.5
center(簇 2)=12.4
(2) 第二轮:中心点为 2.5,和 12.4
依次计算各点到中心点的距离,并将各数据点分到相应的簇中。
簇 1:A1.、A2、A6
簇 2:A3、A4、A5、A7
更新簇中心
center(簇 1)=3
center(簇 2)=14.5
第三轮:中心点为 3,和 14.5
依次计算各点到中心点的距离,并将各数据点分到相应的簇中。
簇 1:A1.、A2、A6
簇 2:A3、A4、A5、A7
更新簇中心
center(簇 1)=3
center(簇 2)=14.5
簇中心与上一轮相同,算法停止。
所以最终的两个簇为:
簇 1:A1.、A2、A6
簇 2:A3、A4、A5、A7
Part II: 上机作业
Question 1 (30%)
Assume this supermarket would like to promote milk. Use the data in “transactions” as
training data to build a decision tree (C5.0 algorithm) model to predict whether the customer
would buy milk or not.
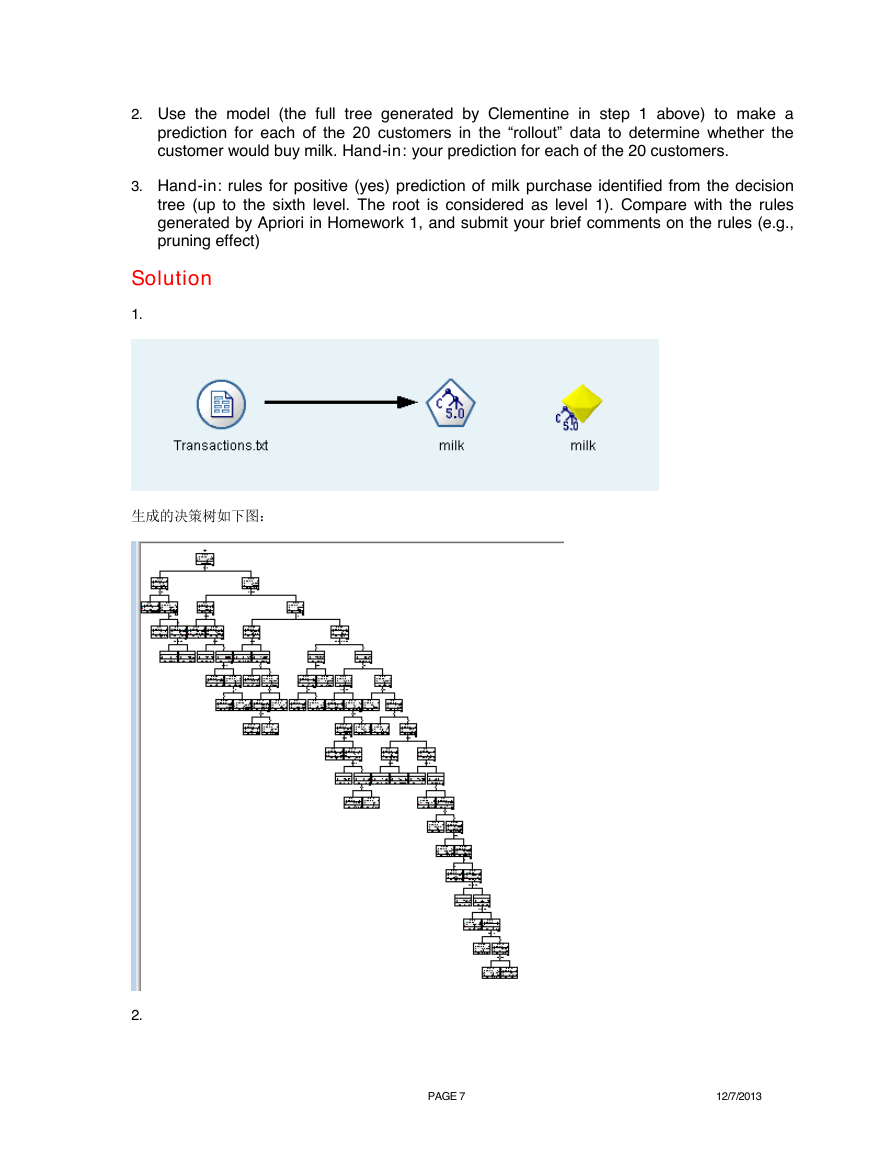
1. Build a decision tree using data set “transactions” that predicts milk as a function of the
other fields. Set the “type” of each field to “Flag”, set the “direction” of “milk” as “out”, set
the “type” of COD as “Typeless”, select “Expert” and set the “pruning severity” to 70, and
set the “minimum records per child branch” to be 120. Hand-in: A figure showing your
tree.
PAGE 6
12/7/2013
�
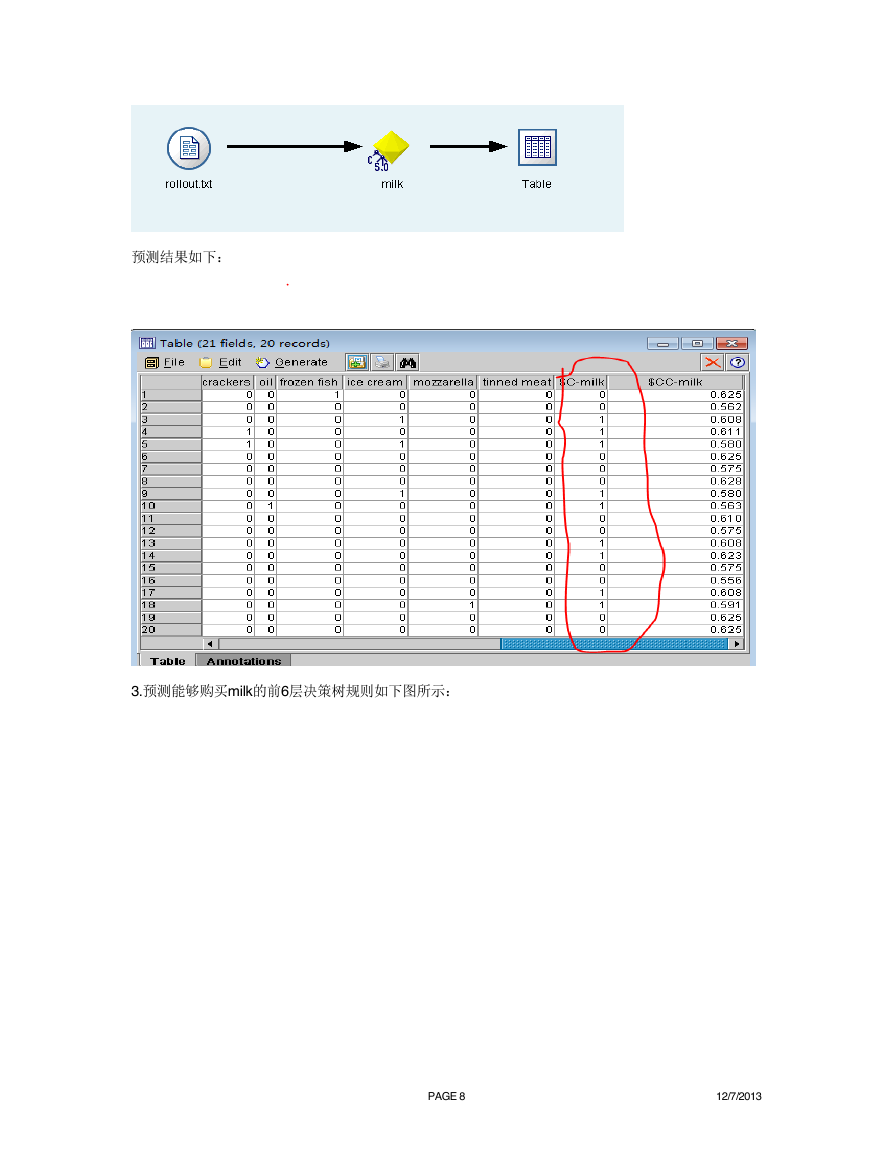
2. Use the model (the full tree generated by Clementine in step 1 above) to make a
prediction for each of the 20 customers in the “rollout” data to determine whether the
customer would buy milk. Hand-in: your prediction for each of the 20 customers.
3. Hand-in: rules for positive (yes) prediction of milk purchase identified from the decision
tree (up to the sixth level. The root is considered as level 1). Compare with the rules
generated by Apriori in Homework 1, and submit your brief comments on the rules (e.g.,
pruning effect)
Solution
1.
生成的决策树如下图:
2.
PAGE 7
12/7/2013
�
预测结果如下:
3.预测能够购买milk的前6层决策树规则如下图所示:
PAGE 8
12/7/2013
�


 2023年江西萍乡中考道德与法治真题及答案.doc
 2012年重庆南川中考生物真题及答案.doc
 2013年江西师范大学地理学综合及文艺理论基础考研真题.doc
 2020年四川甘孜小升初语文真题及答案I卷.doc
 2020年注册岩土工程师专业基础考试真题及答案.doc
 2023-2024学年福建省厦门市九年级上学期数学月考试题及答案.doc
 2021-2022学年辽宁省沈阳市大东区九年级上学期语文期末试题及答案.doc
 2022-2023学年北京东城区初三第一学期物理期末试卷及答案.doc
 2018上半年江西教师资格初中地理学科知识与教学能力真题及答案.doc
 2012年河北国家公务员申论考试真题及答案-省级.doc
 2020-2021学年江苏省扬州市江都区邵樊片九年级上学期数学第一次质量检测试题及答案.doc
 2022下半年黑龙江教师资格证中学综合素质真题及答案.doc