VOSviewer Manual
Nees Jan van Eck and Ludo Waltman
16 February 2018
Manual for VOSviewer version 1.6.7
�
Table of contents
1
2
3
Introduction ........................................................................................... 3
Terminology ........................................................................................... 4
User interface ........................................................................................ 6
3.1
Main panel ...................................................................................... 7
3.1.1
Network visualization ................................................................. 8
3.1.2
Overlay visualization .................................................................. 8
3.1.3
Density visualization .................................................................. 9
3.1.4
Zooming and scrolling .............................................................. 11
3.2
Options panel ................................................................................ 12
3.3
Information panel .......................................................................... 16
3.4
Overview panel .............................................................................. 16
3.5
Action panel .................................................................................. 17
3.5.1
File tab .................................................................................. 17
3.5.2
Items tab ............................................................................... 19
3.5.3
Analysis tab ............................................................................ 19
3.5.4
Create Map wizard ................................................................... 23
4
File types............................................................................................. 34
4.1
Map and network files .................................................................... 34
4.1.1
Map files ................................................................................ 34
4.1.2
Network files .......................................................................... 36
4.2
Corpus and scores files ................................................................... 37
4.2.1
Corpus files ............................................................................ 37
4.2.2
Scores files ............................................................................. 37
4.3
Thesaurus files .............................................................................. 38
4.4
Cluster colors, overlay colors, and density colors files ......................... 38
4.4.1
Cluster colors files ................................................................... 38
4.4.2
Overlay colors files .................................................................. 39
1
�
4.4.3
Density colors files .................................................................. 39
5
Advanced topics ................................................................................... 40
5.1
Using command line parameters ...................................................... 40
5.2
Making a map available online ......................................................... 45
5.3
Increasing the availability of memory ............................................... 45
References ................................................................................................. 47
2
�
1 Introduction
VOSviewer is a software tool for creating maps based on network data and for
visualizing and exploring these maps. The functionality of VOSviewer can be
summarized as follows:
Creating maps based on network data. A map can be created based on a
network that is already available, but it is also possible to first construct a
network. VOSviewer can be used to construct networks of scientific publications,
scientific journals, researchers, research organizations, countries, keywords, or
terms. Items in these networks can be connected by co-authorship, co-
occurrence, citation, bibliographic coupling, or co-citation links. To construct a
network, data from Web of Science, Scopus, PubMed, RIS, or Crossref JSON
files can be used.
Visualizing and exploring maps. VOSviewer provides three visualizations of a
map: The network visualization, the overlay visualization, and the density
visualization. Zooming and scrolling functionality allows a map to be explored in
full detail, which is essential when working with large maps containing
thousands of items.
Although VOSviewer is intended primarily for analyzing bibliometric networks, it
can in fact be used to create, visualize, and explore maps based on any type of
network data.
VOSviewer has been developed in the Java programming language. Because Java
is platform-independent, VOSviewer runs on most hardware and operating system
platforms. VOSviewer can be downloaded from www.vosviewer.com. It can be
used freely for any purpose.
This manual pertains to version 1.6.7 of VOSviewer. The manual is organized as
follows. We first introduce some terminology in Chapter 2. We then discuss the
user interface of VOSviewer in Chapter 3, and we explain the file types used by
VOSviewer in Chapter 4. Finally, we consider a number of advanced topics in
Chapter 5.
For additional information about VOSviewer, we refer to a paper that we have
written (Van Eck & Waltman, 2010). This paper provides a general introduction to
VOSviewer. It also discusses in considerable detail the technical implementation of
specific elements of the software. Similar information, including a step-by-step
tutorial, can also be found in a more recent book chapter (Van Eck & Waltman,
2014).
3
�
2 Terminology
When working with VOSviewer, it is important to understand the terminology used
by the software. We now introduce this terminology.
Maps created, visualized, and explored using VOSviewer include items. Items are
the objects of interest. Items may for example be publications, researchers, or
terms. A map normally includes only one type of item. It is for example uncommon
to have a map that includes both publications and terms. Between any pair of
items there can be a link. A link is a connection or a relation between two items.
Examples of links are bibliographic coupling links between publications, co-
authorship links between researchers, and co-occurrence links between terms. A
map normally includes only one type of link. Also, between any pair of items, there
can be no more than one link. Each link has a strength, represented by a positive
numerical value. The higher this value, the stronger the link. The strength of a link
may for example indicate the number of cited references two publications have in
common (in the case of bibliographic coupling links), the number of publications
two researchers have co-authored (in the case of co-authorship links), or the
number of publications in which two terms occur together (in the case of co-
occurrence links). Sometimes the links between items all have a strength of one.
VOSviewer then does not show the strength of a link. Items and links together
constitute a network. Hence, a network is a set of items together with the links
between the items.1
Items may be grouped into clusters. A cluster is a set of items included in a map.2
Clusters are non-overlapping in VOSviewer. In other words, an item may belong to
only one cluster. Clusters do not need to exhaustively cover all items in a map.
Hence, there may be items that do not belong to any cluster. Clusters are labeled
using cluster numbers. If there is only one cluster, this cluster usually has cluster
number 1, if there are two clusters, these clusters usually have cluster numbers 1
and 2, and so on.
1 In the literature, a network is sometimes referred to as a graph. Likewise, an item is sometimes called
a node or a vertex, a link is sometimes called an edge, and the strength of a link is sometimes called an
edge weight. These terms are not used by VOSviewer, but they may be used by other software tools for
network analysis and network visualization.
2 In the literature, a cluster is sometimes referred to as a community, but this term is not used by
VOSviewer.
4
�
Items may have various attributes in VOSviewer. If items have been assigned to
clusters, cluster numbers are an example of an attribute. Of special importance are
the weight and score attributes. These attributes are represented by numerical
values. Weight attributes are restricted to non-negative values. Score attributes do
not have this restriction. A weight of an item should in some way indicate the
importance of the item. An item with a higher weight is regarded as more
important than an item with a lower weight.3 In the visualization of a map, items
with a higher weight are shown more prominently than items with a lower weight.
A score attribute may indicate any numerical property of items.4 However, since
weight attributes are already used to indicate the importance of items, it is
recommended to use score attributes to indicate other properties. Score attributes
are considered only in the overlay visualization of a map (see Subsection 3.1.2),
not in the network visualization and the density visualization. Items may have
multiple weight and multiple score attributes. The weight and score attributes that
are used in the visualization of a map can then be selected in the options panel of
VOSviewer (see Section 3.2).
There are two standard weight attributes, referred to as the Links attribute and the
Total link strength attribute. For a given item, the Links and Total link strength
attributes indicate, respectively, the number of links of an item with other items
and the total strength of the links of an item with other items. For example, in the
case of co-authorship links between researchers, the Links attribute indicates the
number of co-authorship links of a given researcher with other researchers. The
Total link strength attribute indicates the total strength of the co-authorship links
of a given researcher with other researchers.
In addition to the standard Links and Total link strength attributes, items may also
have custom weight attributes. Custom weight attributes are discussed in
Subsection 3.5.4.
3 More precisely, VOSviewer assumes weight attributes to have a ratio scale. In other words, if an item
has a weight that is twice as high as the weight of another item, the former item is regarded as twice as
important as the latter item.
4 Unlike weight attributes, score attributes are not assumed to have a ratio scale. Score attributes may
also have an interval or an ordinal scale. In other words, the minimum requirement for score attributes
is that it makes sense to compare two items based on whether one item has a higher score than the
other item.
5
�
3 User interface
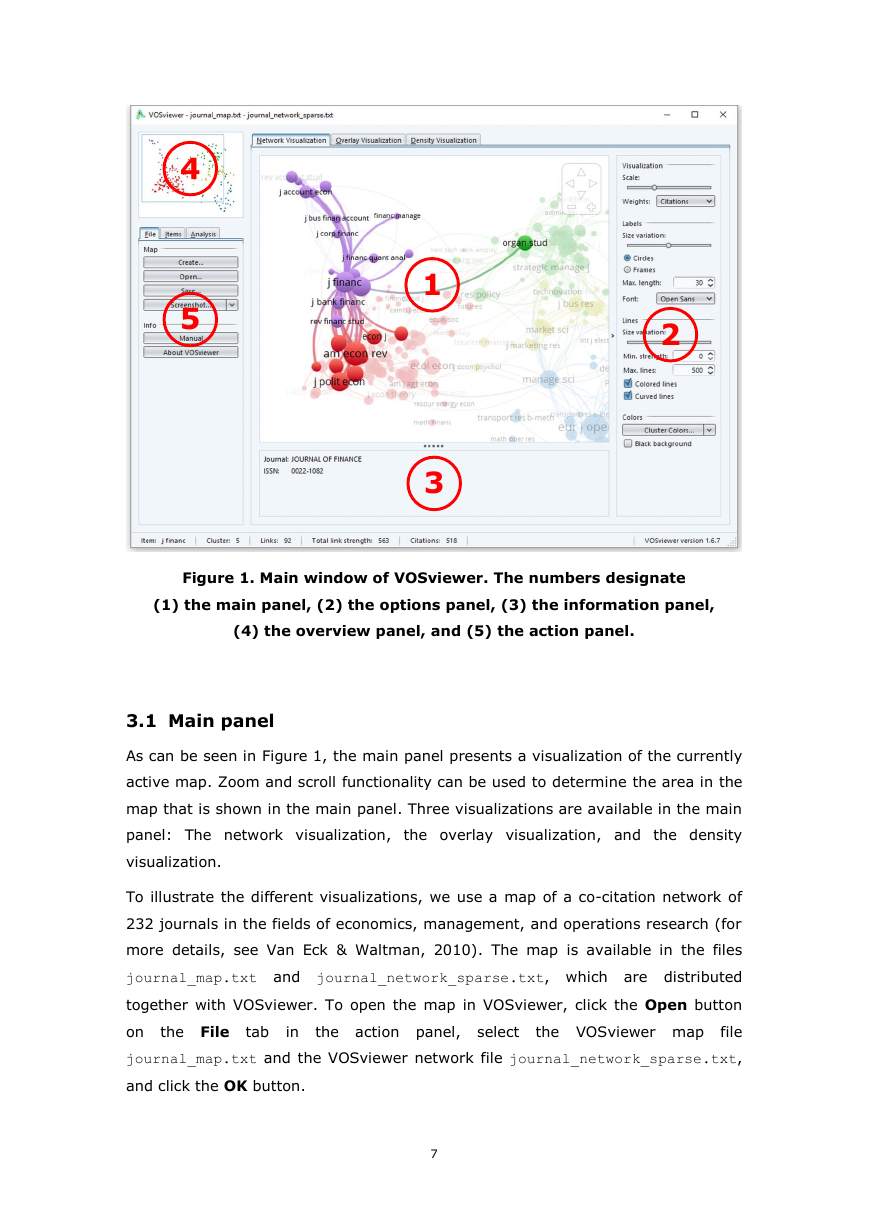
The main window of VOSviewer is shown in Figure 1. It consists of the following
five panels:
Main panel. This panel presents a visualization of the currently active map.
Zoom and scroll functionality can be used to explore the map in full detail.
Options panel. This panel can be used to make adjustments to the visualization
of the currently active map presented in the main panel.
Information panel. This panel presents descriptions of items in the currently
active map.
Overview panel. This panel presents an overview of the currently active map. A
rectangular frame indicates the area in the map that is shown in the main panel.
Action panel. This panel can be used to perform different kinds of actions, such
as creating a new map, opening or saving an existing map, making a
screenshot, and updating the layout or the clustering of a map.
VOSviewer provides three visualizations, referred to as the network visualization,
the overlay visualization, and the density visualization. As can be seen in Figure 1,
the Network Visualization, Overlay Visualization, and Density Visualization
tabs in the main window of VOSviewer can be used to switch between the
visualizations.
A status bar is available at the bottom of the main window of VOSviewer. The
status bar provides information about the currently active map. It shows the
number of items in the map, the number of clusters to which the items have been
assigned, the number of links between the items, and the total strength of the
links. Moreover, when the mouse pointer is moved over an item in the main panel,
the status bar provides information about this item. Likewise, when the mouse
pointer is moved over a link between two items, the status bar provides
information about this link.
In the next sections, the five panels in the main window of VOSviewer are
discussed in more detail.
6
�
4
5
1
3
2
Figure 1. Main window of VOSviewer. The numbers designate
(1) the main panel, (2) the options panel, (3) the information panel,
(4) the overview panel, and (5) the action panel.
3.1 Main panel
As can be seen in Figure 1, the main panel presents a visualization of the currently
active map. Zoom and scroll functionality can be used to determine the area in the
map that is shown in the main panel. Three visualizations are available in the main
panel: The network visualization, the overlay visualization, and the density
visualization.
To illustrate the different visualizations, we use a map of a co-citation network of
232 journals in the fields of economics, management, and operations research (for
more details, see Van Eck & Waltman, 2010). The map is available in the files
journal_map.txt and journal_network_sparse.txt, which are distributed
together with VOSviewer. To open the map in VOSviewer, click the Open button
on the File tab
in the action panel, select the VOSviewer map
file
journal_map.txt and the VOSviewer network file journal_network_sparse.txt,
and click the OK button.
7
�



 2023年江西萍乡中考道德与法治真题及答案.doc
 2012年重庆南川中考生物真题及答案.doc
 2013年江西师范大学地理学综合及文艺理论基础考研真题.doc
 2020年四川甘孜小升初语文真题及答案I卷.doc
 2020年注册岩土工程师专业基础考试真题及答案.doc
 2023-2024学年福建省厦门市九年级上学期数学月考试题及答案.doc
 2021-2022学年辽宁省沈阳市大东区九年级上学期语文期末试题及答案.doc
 2022-2023学年北京东城区初三第一学期物理期末试卷及答案.doc
 2018上半年江西教师资格初中地理学科知识与教学能力真题及答案.doc
 2012年河北国家公务员申论考试真题及答案-省级.doc
 2020-2021学年江苏省扬州市江都区邵樊片九年级上学期数学第一次质量检测试题及答案.doc
 2022下半年黑龙江教师资格证中学综合素质真题及答案.doc