Computer Networks 50 (2006) 1488–1512
www.elsevier.com/locate/comnet
A framework for mining evolving trends in Web data
streams using dynamic learning and retrospective validation
Olfa Nasraoui a,*, Carlos Rojas a, Cesar Cardona b,1
a Department of Computer Engineering and Computer Science, University of Louisville, Louisville, KY 40292, United States
b Magnify Inc., Chicago, United States
Available online 27 December 2005
Abstract
The expanding and dynamic nature of the Web poses enormous challenges to most data mining techniques that try to
extract patterns from Web data, such as Web usage and Web content. While scalable data mining methods are expected to
cope with the size challenge, coping with evolving trends in noisy data in a continuous fashion, and without any unnec-
essary stoppages and reconfigurations is still an open challenge. This dynamic and single pass setting can be cast within the
framework of mining evolving data streams. The harsh restrictions imposed by the ‘‘you only get to see it once’’ constraint
on stream data calls for different computational models that may furthermore bring some interesting surprises when it
comes to the behavior of some well known similarity measures during clustering, and even validation. In this paper, we
study the effect of similarity measures on the mining process and on the interpretation of the mined patterns in the harsh
single pass requirement scenario. We propose a simple similarity measure that has the advantage of explicitly coupling the
precision and coverage criteria to the early learning stages. Even though the cosine similarity, and its close relative such as
the Jaccard measure, have been prevalent in the majority of Web data clustering approaches, they may fail to explicitly
seek profiles that achieve high coverage and high precision simultaneously. We also formulate a validation strategy and
adapt several metrics rooted in information retrieval to the challenging task of validating a learned stream synopsis in
dynamic environments. Our experiments confirm that the performance of the MinPC similarity is generally better than
the cosine similarity, and that this outperformance can be expected to be more pronounced for data sets that are more
challenging in terms of the amount of noise and/or overlap, and in terms of the level of change in the underlying pro-
files/topics (known sub-categories of the input data) as the input stream unravels. In our simulations, we study the task
of mining and tracking trends and profiles in evolving text and Web usage data streams in a single pass, and under different
trend sequencing scenarios.
Ó 2005 Elsevier B.V. All rights reserved.
Keywords: Mining evolving data streams; Web clickstreams; Web mining; Text mining; User profiles
* Corresponding author.
E-mail addresses: olfa.nasraoui@louisville.edu (O. Nasraoui),
c.rojas@louisville.edu (C. Rojas), ccardona@magnify.com (C.
Cardona).
1 This research was done while C. Cardona was at
the
University of Memphis.
‘‘You cannot step twice into the same stream.
For as you are stepping in, other waters are ever
flowing on to you’’ HERACLITUS, c.535–475
BC, quoted by Plato.
1. Introduction
1389-1286/$ - see front matter Ó 2005 Elsevier B.V. All rights reserved.
doi:10.1016/j.comnet.2005.10.021
�
O. Nasraoui et al. / Computer Networks 50 (2006) 1488–1512
1489
The Web has been a relentless generator of data
that comes in a variety of forms, ranging from Web
content data that forms the substance of most Web
documents, to the daily trails left by visitors as they
surf through a Website, also known as Web usage
data. Hidden in this data, often lurk interesting
knowledge or patterns such as Web user access
trends or profiles that can be used to achieve various
objectives, including supporting customer relation-
ship management, and personalization of the user’s
experience on a Website.
Recently, data mining techniques have been
applied to extract usage patterns from Web log data
[3,6,18–21,24–26,29,30]. Most of these efforts have
proposed using various data mining or machine
learning techniques to model and understand Web
user activity. In [29], clustering was used to segment
user sessions into clusters or profiles that can later
form the basis for personalization. In [21], the
notion of an adaptive Website was proposed, where
the user’s access pattern can be used to automati-
cally synthesize index pages. The work in [6] is based
on using association rule discovery as the basis for
modeling Web user activity, while the approach
proposed in [3] used Markov Random Fields to
model Web navigation patterns for the purpose of
prediction. The work in [30] proposed building data
cubes from Web log data, and later applying online
analytical processing (OLAP) and data mining on
the cube model. [25] presents a complete Web Usage
Mining (WUM) system that extracts patterns from
Web log data with a variety of data mining tech-
niques. New relational clustering techniques with
robustness to noise were used to discover user pro-
files that can overlap in [20,19], while a density-
based evolutionary clustering technique is proposed
to discover multi-resolution and robust user profiles
in [18]. The K Means algorithm was used in [24] to
segment user sequences into different clusters. An
extensive survey of different approaches to Web
usage mining can be found in [26]. It is interesting
to note that an incremental way to update a Web
usage mining model was proposed in [3]. In this
approach, the user navigation records are modeled
by a hypertext probabilistic grammar (HPG) whose
higher probability generated strings correspond to
the user’s preferred trails. The model had the advan-
tages of being self-contained (i.e., has all statistics
needed to mine all the data accumulated), as well
as compact (the model was in the form of a tree
whose size depends on the number of items instead
of the number of users, which enhances scalability).
The HPG model was incremental, in the sense that
when more log data became available, it could be
incorporated in the model without the need of
rebuilding the grammar from scratch.
Unfortunately, with the exception of [3] (which
provided a scalable way to model Web user naviga-
tion, but did not explicitly address the change/
evolvability aspect of this data), all the aforemen-
tioned methods assume that the entire pre-processed
Web session data could reside in main memory.
This can be a disadvantage for systems with limited
main memory in case of huge Web session data,
since the I/O operations would have to be extensive
to shuffle chunks of data in and out, and thus com-
promise scalability. Today’s Websites are a source
of an exploding amount of clickstream data that
can put the scalability of any data mining technique
into question.
Moreover, the Web access patterns on a Website
are very dynamic in nature, due not only to the
dynamics of Website content and structure, but also
to changes in the users’ interests, and thus their nav-
igation patterns. The access patterns
can be
observed to change depending on the time of day,
day of week, and according to seasonal patterns
or other external events. As an alternative to locking
the state of the Web access patterns in a frozen state
depending on when the Web log data was collected,
an intelligent Web usage mining system should be
able to continuously learn in the presence of such
conditions without ungraceful stoppages, reconfigu-
rations, or restarting from scratch. For all these rea-
sons, Web usage data should be considered as a
reflection of a dynamic environment which there-
fore requires dynamic learning of the user access
patterns. This dynamic setting can be cast within
the framework of mining evolving data streams.
Data streams are massive data sets that arrive with
a throughput so high that the data can only be ana-
lyzed sequentially and in a single pass. The discov-
ery of useful patterns from data streams is referred
to as stream data mining. In particular, a recent
explosion of applications generating and analyzing
data streams has added new unprecedented chal-
lenges for clustering algorithms if they are to be able
to track changing clusters in streams using only the
new data points because storing past data is not
even an option [1,2,5,10]. Because most data
streams unleash data points or measurements in a
non-arbitrary order, they are inherently attached
to a temporal aspect, meaning that the patterns that
could be discovered from them follow dynamic
�
1490
O. Nasraoui et al. / Computer Networks 50 (2006) 1488–1512
stream data,
that may depart
trends, and hence they are different from traditional
static data sets that are very large. Such data streams
are referred to as evolving data streams. For these
reasons, even techniques that are scalable for huge
data sets may not be the answer for mining evolving
data streams, because these techniques always strive
to work on the entire data set without making any
distinction between new data and old data, and
hence cannot be expected to handle the notion of
emerging and obsolete patterns. The harsh restric-
tions imposed by the ‘‘you only get to see it once’’
constraint on stream data calls for different compu-
tational models and different validation methodolo-
gies
from the ones used in
traditional data mining. In [16], we proposed a new
immune system inspired approach for clustering
noisy multi-dimensional
called
TECNO-STREAMS (tracking evolving clusters in
noisy streams), that has the advantages of scalability,
robustness and automatic scale estimation. TECNO-
STREAMS is a scalable clustering methodology that
gleams inspiration from the natural immune system
to be able to continuously learn and adapt to new
incoming patterns by detecting an unknown number
of clusters in evolving noisy data in a single pass.
Data is presented in a stream, and is processed
sequentially as it arrives, in a single pass over the
data stream. A stream synopsis is learned in a con-
tinuous fashion. The stream synopsis consists of a
set of synopsis nodes or cluster representatives with
additional properties, such as spatial scale and age,
that offer a summary of the data stream that is con-
cise, and yet accurate. Because the data stream is a
dynamic source of data, the stream synopsis itself
is dynamic, and will change to reflect the status of
the current data stream. The stream synopsis is con-
strained so that its size does not exceed a maximal
limit that is predefined depending on the application,
and preference will be given to newer parts of the
data stream in occupying synopsis nodes that repre-
sent them. Obsolete parts of the summary that corre-
spond to older parts of the data stream are gradually
purged from the synopsis, and delegated to second-
ary storage memory.
1.1. Contributions of this paper
Within the context of mining evolving Web click-
streams, we apply the mechanics of TECNO-
STREAMS to continuously discover an evolving
profile synopsis, consisting of synopsis nodes. Each
synopsis node is an entity summarizing a basic Web
usage trend, also referred to as profile, that is char-
acterized by the following descriptors: typical repre-
sentative user session summary (a bag of URL
indices), spatial scale or dispersion in the usage pat-
tern around this representative (this is the amount
of variance in the distance from compatible data
stream input sessions and this node: it is also a mea-
sure of error or variance that reflects the accuracy of
the synopsis node as a representative of the input
data stream), and age (time since the profile’s birth).
In this paper, we study the task of tracking
emerging topics/clusters in noisy and evolving text
data sets (text mining), and in mining evolving user
profiles from Web clickstream data (Web usage
mining) in a single pass, and under different trend
sequencing scenarios. A trend sequencing scenario
corresponds to a specific way to order the Web ses-
sions or the text documents as they are presented as
input to the stream mining algorithm. If the user
sessions or the text documents are known to belong
to certain profiles or classes/document categories,
also heretoforth called trends, then one particular
sequencing scenario may be obtained by presenting
the sessions or documents according to a particular
sequence of the trends, such as first the sessions/doc-
uments from the first trend, then the sessions/docu-
ments from the second trend, and so on. Reversing
the order of the trends will naturally result in a dif-
ferent sequence. Similarly, the sessions/documents
can be presented in the same order as they were
received in the original data stream. In this case,
we refer to the sequencing scenario as ‘‘regular
order’’, ‘‘chronological order’’, or ‘‘natural chrono-
logical order’’.
We propose a validation methodology and several
validation metrics that are rooted in information
retrieval, and that are useful to assess the quality of
the stream synopsis as a summary of an input data
stream from the points of view of precision, coverage
(or recall), and adaptability to the evolution of the
stream. Coverage or recall of a synopsis node mea-
sures the proportion of items matching the input data
in its vicinity. High coverage means that the node
covers most of the items in the input. On the other
hand, high precision means that the synopsis node
covers only the correct items in the input data, and
not any additional superfluous items due to noise or
other artifacts. Coverage and precision generally
work in contradicting ways. or example, the best cov-
erage is obtained when a single synopsis node con-
tains all the items in the data, but then its precision
will be very low. And vice versa, a node that consists
�
O. Nasraoui et al. / Computer Networks 50 (2006) 1488–1512
1491
of only one of the correct items will have 100% preci-
sion, but its coverage will suffer. Our validation pro-
cedure is useful within the framework of mining
evolving Web data streams. Unlike existing frame-
works which study mostly static data sets, our
adopted validation strategy is based on taking into
account both the content and the changing nature
(hence the temporal aspect) of the stream data mining
task, so that the synopsis discovered by data mining,
is evaluated from the perspectives of precision and
coverage throughout the entire temporal span of the
experiment, and not just at one specific time, such as
the end of the stream. This philosophy of validation
gives rise to interesting retrospective validation mea-
sures that are rooted in some classical information
retrieval metrics, but that evaluate the learned synop-
sis according to two different dimensions: (i) the tem-
poral dimension which corresponds to the order in
which the input data stream arrives, and (ii) the
ground-truth content categories from which the
input data is known to originate. In the case of
Web user sessions/clickstreams, the categories corre-
spond to user trends, profile, or classes; while in the
case of text documents, the categories correspond
to known document class labels. Since, the emphasis
is on learning an accurate synopsis of an arbitrary
and unlabeled dynamic data stream, these categories
are only used during the final validation phase, and
not in the actual learning/data mining.
Our previous discussion emphasized the impor-
tance of both precision and coverage for assessing
the quality of the learned synopsis. This is not sur-
prising since these measures have always been the
main validation metrics used in information retrie-
val. However, this also led us to the ask the follow-
ing question: If these metrics are so critical
in
assessing quality, then why not use ‘‘them’’ to guide
the search for a better synopsis. Since each synopsis
node is evaluated based on the density of similar
data inputs in its vicinity, this led us to adapting
the similarity measure to take into account the pre-
cision and coverage metrics of a candidate synopsis
node. For all these reasons, we investigate a simple
similarity measure that has the advantage of explic-
itly coupling the precision and coverage criteria to
the early learning stages, hence requiring that the
learned profiles are simultaneously precise and com-
plete, with no compromises. A diagram showing the
different components of the stream mining frame-
work is shown in Fig. 1.
1.2. Organization of this paper
The rest of this paper is organized as follows. We
start by reviewing the TECNO-STREAMS algo-
rithm in Section 2. In Section 3, we describe how
we can use TECNO-STREAMS to track evolving
clusters in Web usage data. Then, we present our
validation methodology and metrics for the evolv-
ing stream mining framework. In Section 4 we apply
our validation strategy to the task of mining real
evolving Web clickstream data and for tracking
evolving topic trends in textual stream data, while
studying the effect of the choice of different similar-
ity measures. Finally, in Section 5, we summarize
our findings and present our conclusions.
Fig. 1. Mining and validation of evolving data streams.
�
1492
O. Nasraoui et al. / Computer Networks 50 (2006) 1488–1512
2. Tecno-streams (tracking evolving clusters in noisy
streams)
In particular,
In this section we present the main features of
TECNO-STREAMS that are relevant to this paper,
leaving most of the detail in [16]. The immune sys-
tem (lymphocyte elements) can behave as an alter-
native biological model of intelligent machines, in
contrast to the conventional model of the neural
system (neurons).
the artificial
immune network (AIN) model is based on Jerne’s
Immune Network theory [11,27]. The system con-
sists of a network of artificial B cell lymphocytes,
XB, that summarize the learned model, hence play-
ing the role of synopsis nodes. In addition to the B
Cells, the immune network consists of stimulating
and suppressing links between these cells. Learning
takes as input a set of input data (external antigenic
agents), Xa, and tries to learn an optimal immune
network consisting of linked B Cells based on clon-
ing operations. Each B Cell represents a learned pat-
tern that could be matched to a data point or
another B Cell in the network. A link between two
B Cells gets stronger if they are more similar. This
results
in co-stimulation between similar cells.
Because an excess of co-stimulation between similar
B Cells can cause an explosive growth of the B Cell
population in a small local neighborhood (by clon-
ing), there is another phenomenon, known as co-
suppression, which acts to balance the influence of
close B Cells. In addition to controlling population
growth and enabling memory in the learned
immune network, co-stimulation and co-suppres-
sion define implicit pathways of communication
between the different elements (synopsis nodes) of
the immune network which act like an adaptive
and distributed set of agents that track the distribu-
tion of the input data stream. Without this collabo-
rative or cooperative component in the learning,
every synopsis node will act as an isolated element
with no visibility of the neighboring cells. It has
lately been recognized that a richer and higher level
of intelligence can emerge from collaborative behav-
ior between even the simplest agents. This phenom-
enon is frequently referred to as emergence, where
complex and organized global behavior can arise
from the interaction of simple local rules. Examples
can be found in ant colonies, bee swarms and bird
flocks [8,9,22]. In this specific context, this kind of
collaborative behavior is expected to enhance mem-
ory in a distributed manner, while affecting the
dynamics of learning. These crucial characteristics
may well be essential to learning and adaptation
in a single-pass setting, just as they are crucial to
the survival of natural organisms in dynamic envi-
ronments. Data from the input stream is matched
against a B Cell or synopsis node based on a prop-
erly chosen similarity measure. This affects the syn-
opsis node’s stimulation level, which in turn affects
both its outlook for survival, as well as the number
of clones that it produces. Because clones are similar
to their spawning parent, they together form a net-
work of co-stimulated cells that can sustain them-
selves even long after the disappearance of data
that has initiated the cloning. However, this net-
work of synopsis nodes will slowly wither and die
if it is no longer stimulated by the data for which
it has specialized, hence gradually forgetting old
encounters. This forgetting is the reason why the
immune system needs periodical reminders in the
form of re-vaccination. The combined recall and
forgetting behavior in the face of external antigenic
agents forms the fundamental principle behind the
concept of emerging or dynamic memory in the
immune system. This is specifically the reason why
the immune system metaphor offers a very compet-
itive model within the evolving data stream frame-
work. In the following description, we present a
more formal treatment of the intuitive concepts
explained above.
We will use TECNO-STREAMS to continuously
and dynamically learn evolving patterns
from
dynamic Web data. To summarize our approach:
(1) The input data can be extracted from Web log
data (a Web log is a record of all files/URLs
accessed by users on a Web site), or from a collec-
tion of text documents, (2) the data is pre-processed
(e.g., via cookies or IP address and time out window
for Web logs) to produce session lists: A session list
st for user number t is a list of indices of the URLs
that were visited by the same user, represented as a
binary vector (1 if the URL was visited during this
session, and 0 otherwise). Each session will repre-
sent a data record from the input stream. In the case
of
representation is
obtained by replacing the notion of a URL by a
keyword or term and a session by a document or
Web page content. Hence a data object would cor-
respond to one document represented as a list of
terms; (3) the ith B Cell plays the role of a synopsis
node that represents the ith candidate profile psi and
encodes relevant URLs (or keywords for text data),
which are the attributes in this case, as well as the
additional measures of scale (r2
i;J ) and age (tsi) at
text documents, a similar
�
O. Nasraoui et al. / Computer Networks 50 (2006) 1488–1512
1493
any point J (after J inputs have been processed) in
the stream sequence.
In a dynamic environment, the objects xt from a
data stream X are presented to the immune network
one at a time, with the stimulation and scale mea-
sures updated incrementally with each new data
object. It is more convenient to think of the data
index, t, as monotonically increasing with time.
That is, the NX data points are presented in the fol-
lowing chronological order: x1; x2; . . . ; xN X . Each
synopsis node represents an influence zone over the
input data space. However, since data is dynamic
in nature, and has a temporal aspect, data that is
more current will have higher influence compared
to data that is less current. Quantitatively, the influ-
ence zone is defined in terms of a weight function
that decreases not only with distance from the data
location to the synopsis node prototype, but also
with the time since the data has been presented to
the immune network. It is convenient to think of
time as an additional dimension that is added to
the synopsis node compared to the classical static
B Cell, traditionally defined in the data space only
[17].
Robust weight/activation function: For the ith
synopsis node, psi, i ¼ 1; . . . ; N P s , we define the acti-
vation caused by the tth data point (received at
sequential order or time t), after a total of J inputs
have been received from the data stream as
�
ð1Þ
wit ¼ wi d 2
where s is a forgetting time constant that controls the
time decay rate of the contribution from old data
points, and hence how much emphasis is placed
on the currency of the stream synopsis compared
to the sequence of data points encountered so far.
d 2
it is the distance from data xt (which is the tth data
encountered by the stream synopsis) to synopsis
node, psi . r2
i;J is a scale parameter that controls the
decay rate of the weights along the spatial dimen-
sions, and hence defines the size of an influence zone
around a cluster prototype. Data samples falling far
from this zone are considered outliers. The weight
functions decrease exponentially with the order of
presentation of a data point, t, and therefore, will
favor more current data in the learning process.
�
� d2
it
2r2
i;J
¼ e
�
þðJ�tÞ
s
�
it
;
Influence zone: The ith synopsis node represents a
soft influence zone, IZi, that can be interpreted as a
robust zone of influence.
IZi ¼ fxt 2 Xjwit P wming.
ð2Þ
Each synopsis node is allowed to have is own
zone of influence with radial size proportional to
r2
i;J , that is dynamically estimated. Hence, outliers
are easily detected as data points falling outside
the influence zone of all synopsis nodes or through
their weak activations (wit < wmin, "i).
Stimulation/optimization criterion: The stimula-
tion level, after J data points have been presented
to synopsis node psi, is defined as the density of
the data population around psi (i.e., an estimate of
the spatial density at the synopsis node as measured
by the number of points in the influence zone,
divided by the radius of this influence zone):
P
di;J ¼
J
t¼1wit
r2
i;J
.
ð3Þ
2.1. Cloning in the dynamic immune system
P
The synopsis nodes are cloned in proportion to
their stimulation levels relative to the average net-
work stimulation by creating N clonesi clones or dupli-
cates of the ith node, where N clonesi ¼ K clone
.
When the synopsis node population size (N P sðtÞ) at
any time t exceeds a pre-specified maximum (N P max ),
the synopsis nodes are sorted in ascending order of
their stimulation levels, and the top (N P sðtÞ � N P max )
synopsis nodes (with lowest stimulation) are killed
or archived in long term secondary storage in case
of low stimulation cells that are mature or old.
di;J
NPs
k¼1
dk;J
2.2. Learning new data and relation to emerging trend
detection
Somatic hyper-mutation is a powerful natural
exploration mechanism in the immune system, that
allows it to learn how to respond to new data that
has never been seen before. However, from a compu-
tational point of view, this is a very costly and ineffi-
cient operation since its complexity is exponential in
the number of features. Therefore, we model this
operation in the artificial immune system model by
an instant data duplication whenever a data point is
encountered that fails to activate the entire stream
synopsis. A new data, xt is said to activate the ith syn-
opsis node, if it falls within its influence zone, IZi,
essentially meaning that its activation of this synopsis
node, wit exceeds a minimum threshold wmin.
Potential outlier: A Potential outlier is a data
point that fails to activate the entire synopsis, i.e.,
wit < wmin, 8i ¼ 1; . . . ; N P s . The outlier is termed
�
1494
O. Nasraoui et al. / Computer Networks 50 (2006) 1488–1512
potential because, initially, it may either be an out-
lier or a new emerging pattern. It is only through
the continuous learning process that lies ahead, that
the fate of this outlier will be decided. If it is indeed
a true outlier, then it will form no mature nodes in
the stream synopsis.
2.3. Tecno-streams: tracking evolving clusters in
noisy data streams with a scalable immune system
learning model
The following algorithm is only an intuitive list of
steps for learning a dynamic synopsis from an evolv-
ing input data stream. More details can be found in
[16].
TECNO-STREAMS algorithm: (optional steps
are enclosed in [])
INPUT: data stream xt
OUTPUT: up to a maximum of N P max syn-
opsis nodes psi in the stream synopsis
Fix the maximal population size or number of
synopsis nodes, N P max ;
Initialize
population
i ¼ rinit using the first N P max input data;
r2
Compress stream synopsis into K subnet-
works, with centroid, Ck, k = 1,. . .,K, using
2 iterations of K Means;
Repeat for each incoming data xt {
synopsis
node
and
k incrementally;
Present data to each subnetwork centroid,
Ck, k = 1,. . .,K in network : Compute dis-
tance, activation weight, wkt and update
subnetwork’s scale r2
Determine the most activated subnetwork
(the one with maximum wkt);
IF All synopsis nodes in most activated
subnetwork have wit < wmin (data does
subnetwork)
not
THEN{
sufficiently
activate
Create by duplication a new synopsis
node = psnew ¼ xt and r2
new ¼ rinit;
}
ELSE {
Repeat for each synopsis node psi
most activated subnetwork {
in
IF wit > wmin (i.e., data activates
synopsis node psi) THEN
Refresh age (tsi ¼ 0) for synopsis
node psi ;
ELSE
Increment age (tsi) for synopsis
node psi ;
Compute distance from data xj to
synopsis node psi;
Compute synopsis node psi ’s stimula-
tion level;
Update synopsis node psi ’s scale r2
i ;
}
}
Clone and mutate synopsis nodes;
IF synopsis size N P sðtÞ > N P max Then {
IF (Age of ithsynopsis node tsi < tminÞ
THEN
Temporarily scale synopsis node’s
stimulation level to the network aver-
age stimulation;
Sort synopsis nodes in ascending order
of their stimulation level;
Kill worst excess (top (N P sðtÞ � N P maxÞ
according to previous sorting) synopsis
nodes;
[or move oldest/mature synopsis nodes
to secondary (long term) storage];
}
Compress
stream synopsis periodically
(after every T data points), into K subnet-
works using 2 iterations of K Means with
the previous centroids as initial centroids;
}
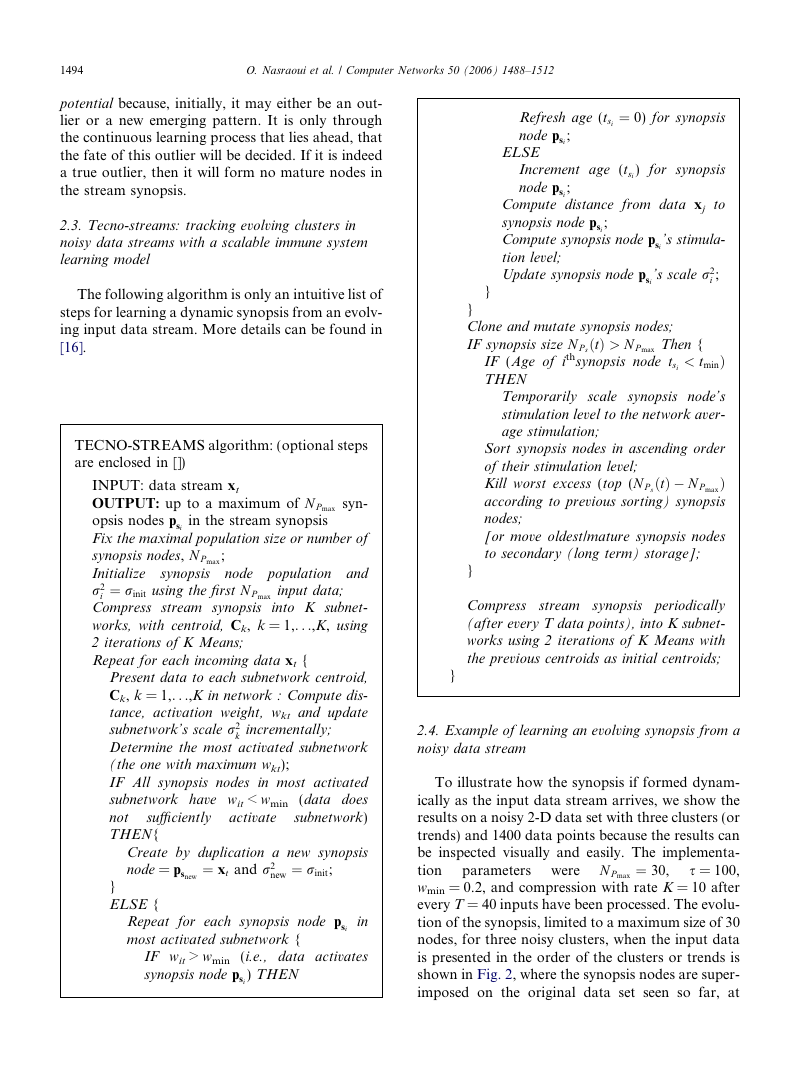
2.4. Example of learning an evolving synopsis from a
noisy data stream
parameters were
To illustrate how the synopsis if formed dynam-
ically as the input data stream arrives, we show the
results on a noisy 2-D data set with three clusters (or
trends) and 1400 data points because the results can
be inspected visually and easily. The implementa-
s = 100,
tion
wmin = 0.2, and compression with rate K = 10 after
every T = 40 inputs have been processed. The evolu-
tion of the synopsis, limited to a maximum size of 30
nodes, for three noisy clusters, when the input data
is presented in the order of the clusters or trends is
shown in Fig. 2, where the synopsis nodes are super-
imposed on the original data set seen so far, at
N P max ¼ 30,
�
O. Nasraoui et al. / Computer Networks 50 (2006) 1488–1512
1495
1
0.8
0.6
0.4
0.2
1
0.8
0.6
0.4
0.2
1
0.8
0.6
0.4
0.2
0
0
0.2
0.4
(a)
0.6
0.8
1
0
0
0.2
0.4
(b)
0.6
0.8
1
0
0
0.2
0.4
0.6
0.8
1
(c)
Fig. 2. Single pass results on a noisy data stream presented one input at a time in the same order as the trends/clusters: location of synopsis
nodes and estimated scales for a noisy stream with three clusters after processing (a) 250 samples, (b) 500 samples, and (c) all 1134 samples.
zone,
influence
this node’s
different snapshots corresponding to distinct mile-
stones within the data stream. The three milestones
approximate the instant following the presentation
of the inputs from the first cluster, then the second
cluster, and finally the third cluster. Each pair of
crossing vertical and horizontal
lines is centered
on a node location, and their length represents the
diameter of
IZ,
(� 3rsi). This trend sequencing scenario is the most
difficult (worst) case for single-pass learning, as it
truly tests the ability of the system to memorize
the old patterns, adapt to new patterns, and still
work within the constraints of a small synopsis.
We emphasize that the final results after all inputs
have been processed is equivalent to a single pass,
resulting in a small synopsis size of only 30 nodes,
that evolves together with the original input data
stream to form a dynamic summary of its distribu-
tion. Note how the noise is ignored after a sufficient
number of inputs, except for the last snapshot that
shows the synopsis capturing a few noise points that
have just been received as input. Hence they are
expected to be removed like all the previous noise
points if the stream were continued.
3. Mining evolving user profiles from noisy Web
clickstream data
3.1. Similarity measures used in the learning phase of
single-pass mining of clusters in Web data
For many data mining applications such as clus-
tering text documents and other high dimensional
data sets, the Euclidean distance measure is not
appropriate. This is due mainly to the high dimen-
sionality of the problem, and the fact that two docu-
ments may not be considered similar if keywords are
missing in both documents. More appropriate for
this application, is a distance based on the cosine sim-
ilarity measure between data item xt and a learned
synopsis node profile psi, which in the simplest
case, can both be defined as binary vectors of length
NI, the total number of items (URLs or keywords),
[12],
Scosði; tÞ ¼
:
ð4Þ
q
P
ffiffiffiffiffiffiffiffiffiffiffiffiffiffiffiffiffiffiffiffiffiffiffiffiffiffiffiffiffiffiffiffiffiffiffi
P
k¼1xt;k � psi;k
N I
N I
k¼1psi;k
k¼1xt;k
P
N I
q
ffiffiffiffiffiffiffiffiffiffiffiffiffiffiffiffiffiffiffiffiffiffiffiffiffi
i;tCovgL
PrecL
i;t
It is easy to show that the cosine similarity is
related to the well known information retrieval
measures of precision and coverage as follows:
Scosði; tÞ ¼
where the precision in the learning phase, PrecL
i;t de-
scribes the accuracy of the learned synopsis node pro-
files psi in representing the data xt, or the ratio of the
number of matching items (URLs or terms) between
the learned profile and the data (session or document)
to the number of items in the learned profile:
ð5Þ
;
P
PrecL
i;t ¼
N I
P
k¼1xt;k � psi;k
N I
k¼1psi;k
;
ð6Þ
while the coverage (also known as recall) in the
learning phase, CovgL
ij describes the completeness
of the learned synopsis node profiles psi in represent-
ing the stream data point xt, or the ratio of the num-
ber of matching items (URLs or terms) between the
learned profile and the data (session or document)
to the number of items in the data:
P
CovgL
i;t ¼
.
ð7Þ
P
k¼1xt;k � psi;k
N I
N I
k¼1xt;k
In light of (5), we can see that using the cosine
similarity as a basis for the distance used to compute
the density around each synopsis node, given by the
�




 2023年江西萍乡中考道德与法治真题及答案.doc
 2012年重庆南川中考生物真题及答案.doc
 2013年江西师范大学地理学综合及文艺理论基础考研真题.doc
 2020年四川甘孜小升初语文真题及答案I卷.doc
 2020年注册岩土工程师专业基础考试真题及答案.doc
 2023-2024学年福建省厦门市九年级上学期数学月考试题及答案.doc
 2021-2022学年辽宁省沈阳市大东区九年级上学期语文期末试题及答案.doc
 2022-2023学年北京东城区初三第一学期物理期末试卷及答案.doc
 2018上半年江西教师资格初中地理学科知识与教学能力真题及答案.doc
 2012年河北国家公务员申论考试真题及答案-省级.doc
 2020-2021学年江苏省扬州市江都区邵樊片九年级上学期数学第一次质量检测试题及答案.doc
 2022下半年黑龙江教师资格证中学综合素质真题及答案.doc