Application of Machine Learning To Epileptic Seizure Detection
Ali Shoeb
ashoeb@mit.edu
John Guttag
Massachusetts Institute of Technology, 77 Massachusetts Avenue, Cambridge, Massachusetts, 02139
guttag@mit.edu
Abstract
seizures.
We present and evaluate a machine learn-
ing approach to constructing patient-specific
classifiers that detect the onset of an epileptic
seizure through analysis of the scalp EEG, a
non-invasive measure of the brain’s electrical
activity. This problem is challenging because
the brain’s electrical activity is composed of
numerous classes with overlapping character-
istics. The key steps involved in realizing a
high performance algorithm included shap-
ing the problem into an appropriate machine
learning framework, and identifying the fea-
tures critical to separating seizure from other
types of brain activity. When trained on 2
or more seizures per patient and tested on
916 hours of continuous EEG from 24 pa-
tients, our algorithm detected 96% of 173 test
seizures with a median detection delay of 3
seconds and a median false detection rate of
2 false detections per 24 hour period. We also
provide information about how to download
the CHB-MIT database, which contains the
data used in this study.
The most common way to infer the onset of a seizure
before it becomes clinically manifest is through anal-
ysis of the scalp electroencephalogram (EEG), a non-
invasive, multi-channel recording of the brain’s electri-
cal activity. The characteristics of EEG vary signifi-
cantly across patients. In fact, EEG associated with
seizure onset in one patient may closely resemble a be-
nign pattern within the EEG of another patient. This
cross-patient variability in seizure and non-seizure ac-
tivity causes patient non-specific classifiers to exhibit
poor accuracy or long delays in declaring the onset of a
seizure (Wilson et al., 2004). In some cases, however,
patient non-specific classifiers can exhibit impressive
performance when restricted to analyzing seizure types
that vary little across patients (Meier et al., 2008).
This paper is about using machine learning to con-
struct patient-specific detectors capable of detecting
seizure onsets quickly and with high accuracy. Unlike
previous efforts, which focused on adult EEG, we eval-
uate our patient-specific detectors on pediatric scalp
EEG because it exhibits greater variability in seizure
and non-seizure activity. Patient-specific seizure onset
detection remains a challenge because
1. Introduction
Seizures are transient aberrations in the brain’s elec-
trical activity. People with epilepsy, a central ner-
vous system disorder, suffer from recurrent seizures
that occur at unpredictable times and usually without
warning. Seizures can result in a lapse of attention or
a whole-body convulsion. Frequent seizures increase
an individual’s risk of sustaining physical injuries and
may even result in death. A device capable of quickly
detecting and reacting to a seizure by delivering ther-
apy or notifying a caregiver could ease the burden of
• Patients with epilepsy have considerable overlap
in the EEG associated with seizure and non-
seizure states. This forces algorithm designers to
confront a steep tradeoff between detector sensi-
tivity and specificity.
• The EEG of epilepsy patients constantly tran-
sitions between regimes both within the seizure
and non-seizure states, and is therefore a non-
stationary process. Characterizing the short-term
evolution of EEG activity can be critical to infer-
ring the brain’s underlying state.
Appearing in Proceedings of the 27 th International Confer-
ence on Machine Learning, Haifa, Israel, 2010. Copyright
2010 by the author(s)/owner(s).
• Numerous medical applications require seizure on-
sets to be detected quickly, i.e., a detector needs
to ascertain that the brain has transitioned into
�
Application of Machine Learning To Epileptic Seizure Detection
a seizure state using few samples from that state.
This forces algorithm designers to confront an-
other steep tradeoff, between detector latency and
specificity.
• Since seizures are rare events, algorithm designers
must craft methods that work with a paucity of
seizure training data.
Since the goal of seizure detection is to segment the
brain’s electrical activity in real-time into seizure and
non-seizure periods, one could consider using an on-
line, unsupervised time-series segmentation algorithm.
Unfortunately, the many regimes of seizure and non-
seizure EEG (Agarwal et al., 1998) cause such al-
gorithms to return numerous segmentations beyond
those demarcating seizure and non-seizure periods.
A seizure detector needs to be taught which signal
regimes and transitions are relevant. For this reason,
we elect to solve the seizure detection problem within
a supervised, discriminative framework.
Within the discriminative framework we choose to
solve a binary classification problem, despite the fact
that the underlying physiological activity is multi-
class. We do so because it is neither easy nor practical
for an expert to identify and label the subclasses of the
seizure and non-seizure states. In contrast, asking an
expert to divide a record of the brain’s electrical ac-
tivity into two encompassing classes, seizure and non-
seizure, is consistent with standard clinical practice.
The key to our classifier’s high accuracy is a completely
automated process for constructing a feature vector
that unifies in a single feature space the time-evolution
of spectral and spatial properties of the brain’s elec-
trical activity. Previous patient-specific algorithms
(Qu & Gotman, 1997; Shoeb et al., 2004; Haas et al.,
2007) classified temporal, spectral, and spatial features
separately, and required an individual skilled in inter-
preting the brain’s electrical activity to specify how
such features should be combined. Furthermore, our
feature vector can be extended with information ex-
tracted from other physiologic signals. This is useful
for detecting seizures associated with subtle changes in
the EEG, but less subtle influence on other observable
physiologic processes.
It is important to distinguish our work from previous
investigations concerned with using machine-learning
to detect (Grewal & Gotman, 2005; Gardner et al.,
2006) seizures using intracranial EEG. Algorithms
that process intracranial EEG rely on features that
cannot be observed within the scalp EEG because of
the spatial averaging effect of the dura and skull. Fur-
thermore, intracranial EEG is immune to corruption
by artifacts (e.g. scalp muscle contractions) that can
mask the onset of seizure activity within the scalp
EEG.
Finally, in evaluating our approach to seizure detec-
tion, we avoided testing methodology that might re-
In (Gardner et al.,
sult in overly optimistic results.
2006), seizures of a single type were used (temporal
lobe seizures); data was hand-selected by an expert to
be free of artifacts; and only 29 seizure and 41 non-
seizure epochs each of 15-minute duration were tested
(for a total of 17 hours of test data that included 29
seizures).
In contrast, our dataset contains numer-
ous seizure types as well as 916 hours and 173 test
seizures.
In (Mirowski et al., 2009), high specificity
was achieved because test non-seizure feature vectors
(33% of data) were not separated in time from train-
ing non-seizure feature vectors (66% of data). This
creates testing and training sets that are highly corre-
lated, since EEG exhibits significant temporal correla-
tion. To evaluate our detector’s specificity, we create
test sets by removing hour-long records from a cor-
pus of EEG data as opposed to removing second-long
epochs.
In Section 2 we
This paper is organized as follows.
review properties of the scalp Electroencephalogram
(EEG). In Section 3 we discuss both the feature ex-
traction and classification stages of our binary classi-
fier. Our detector’s performance is analyzed in Section
5. Finally, in Section 7, we illustrate how seizure detec-
tion can be enhanced through the addition of features
extracted from another physiologic process.
2. The Scalp Electroencephalogram
EEG measures the electrical activity of the brain us-
ing electrodes that are uniformly arrayed on the scalp.
An EEG channel is formed by taking the difference
between potentials measured at two electrodes, and
captures the summed potential of millions of neurons.
Following the onset of most seizures, a set of EEG
channels develops rhythmic activity that is typically
composed of multiple frequency components. The
identity of the EEG channels involved and the struc-
ture of the rhythmic activity differs across individuals.
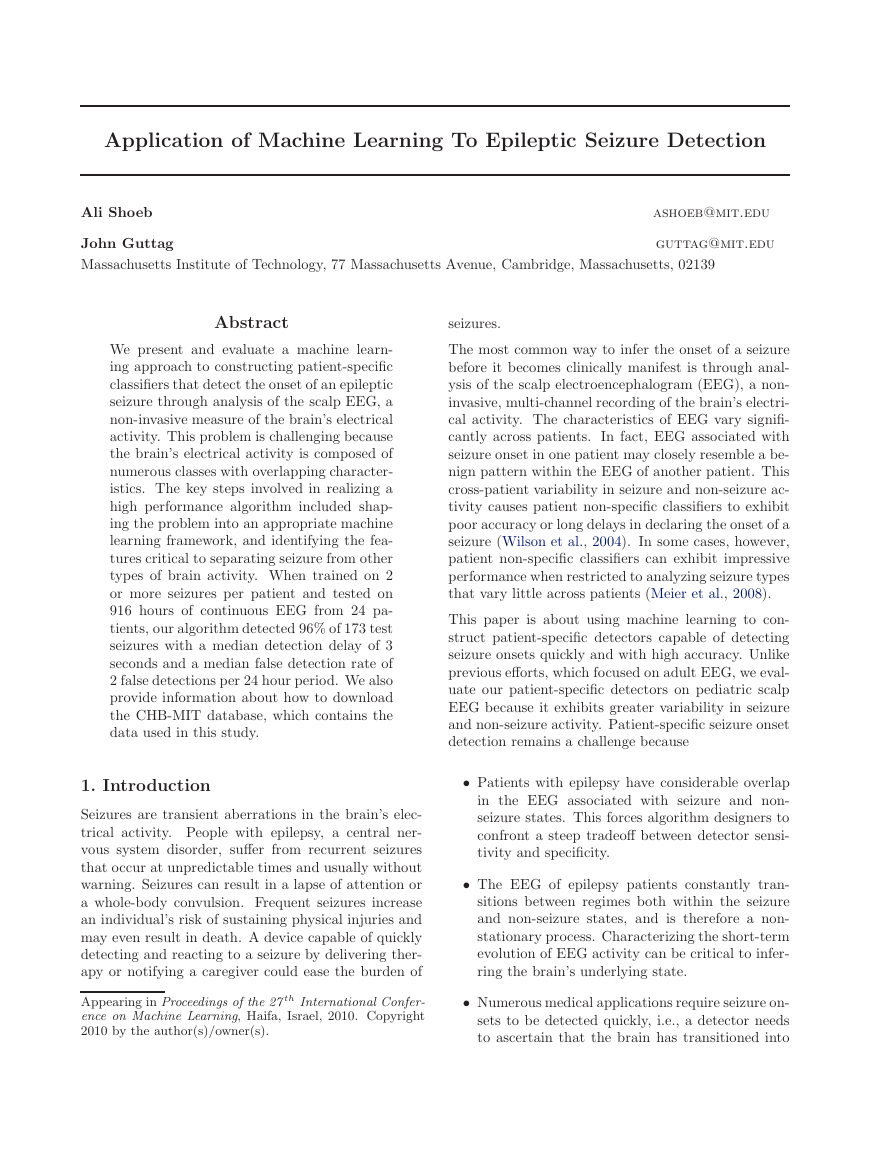
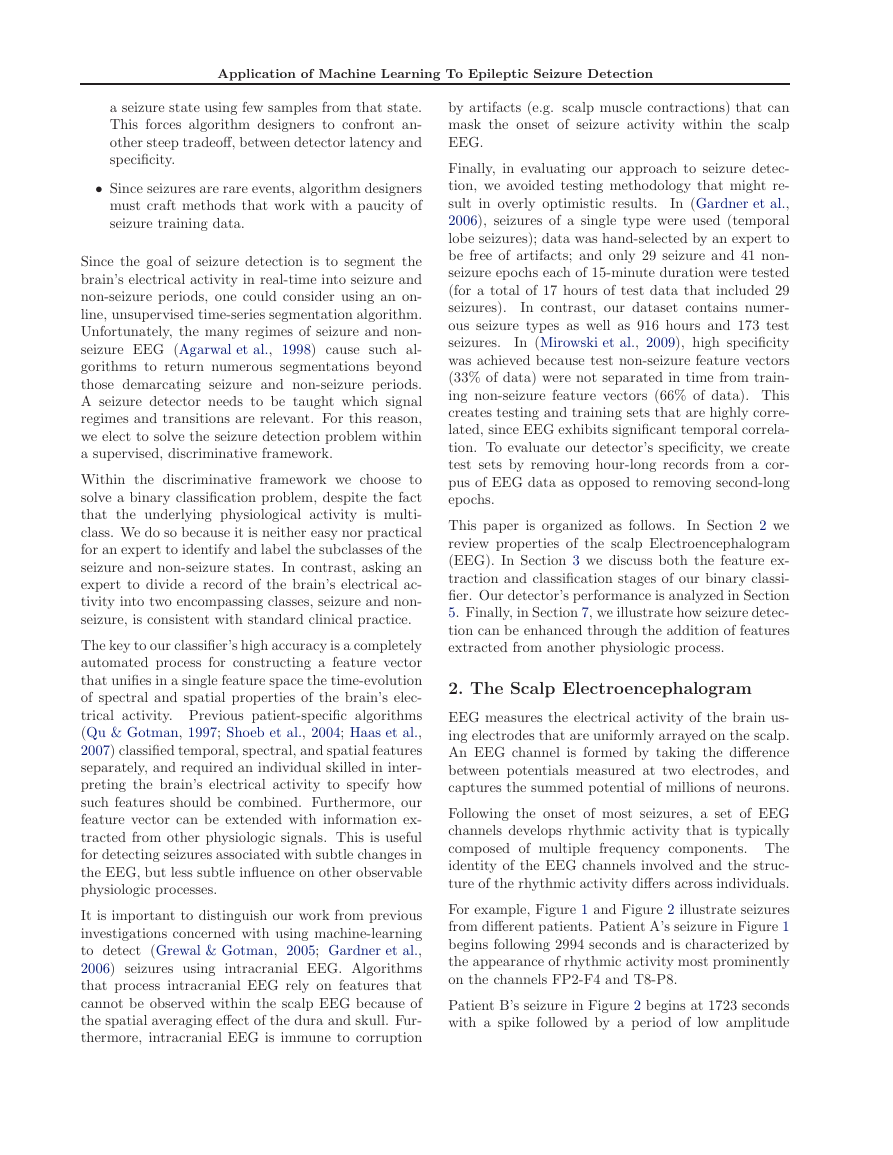
For example, Figure 1 and Figure 2 illustrate seizures
from different patients. Patient A’s seizure in Figure 1
begins following 2994 seconds and is characterized by
the appearance of rhythmic activity most prominently
on the channels FP2-F4 and T8-P8.
Patient B’s seizure in Figure 2 begins at 1723 seconds
with a spike followed by a period of low amplitude
�
Application of Machine Learning To Epileptic Seizure Detection
types of rhythmic activity are normal while others are
abnormal but not associated with seizures. For exam-
ple, the rhythmic activity observed between 2989-2992
seconds in Figure 1 is a normal feature of sleep EEG
known as a spindle, and should not be confused with
the seizure activity seen later in the same figure.
2989
2990
2991
2992
2993
2994
2995
2996
2997
Classification
3. Seizure Detection as Binary
FP1−F7
F7−T7
T7−P7
P7−O1
FP1−F3
F3−C3
C3−P3
P3−O1
FP2−F4
F4−C4
C4−P4
P4−O2
FP2−F8
F8−T8
T8−P8
P8−O2
FZ−CZ
CZ−PZ
Figure 1. A seizure within the scalp EEG of Patient A.
EEG. Next, rhythmic activity develops most promi-
nently on the channel F3-C3, and, over the period of
a few seconds, increases in amplitude and decreases in
frequency. This seizure illustrates the non-stationarity
of EEG within the seizure state.
FP1−F7
F7−T7
T7−P7
P7−O1
FP1−F3
F3−C3
C3−P3
P3−O1
FP2−F4
F4−C4
C4−P4
P4−O2
FP2−F8
F8−T8
T8−P8
P8−O2
FZ−CZ
CZ−PZ
1719
1720
1721
1722
1723
1724
1725
1726
1727
1728
1729
1730
1731
1732
1733
1734
Figure 2. A seizure within the scalp EEG of Patient B.
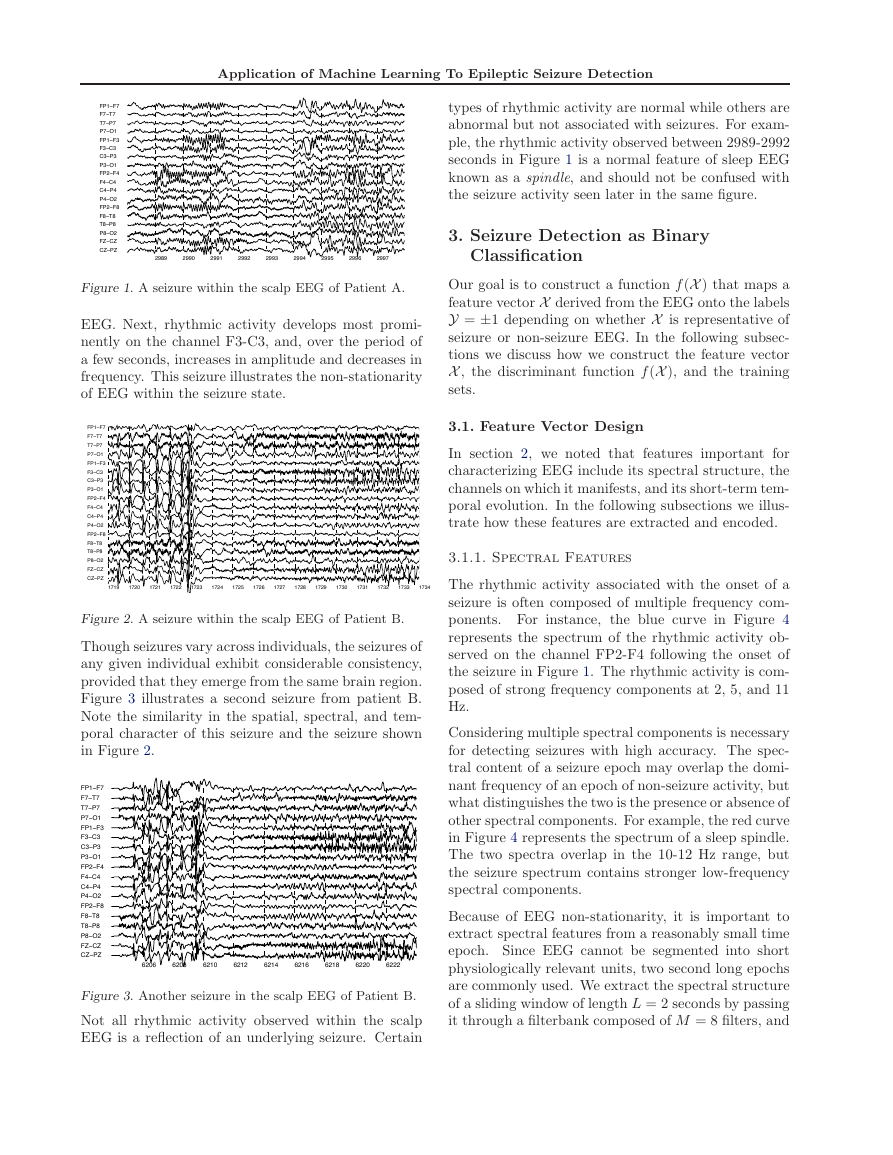
Though seizures vary across individuals, the seizures of
any given individual exhibit considerable consistency,
provided that they emerge from the same brain region.
Figure 3 illustrates a second seizure from patient B.
Note the similarity in the spatial, spectral, and tem-
poral character of this seizure and the seizure shown
in Figure 2.
FP1−F7
F7−T7
T7−P7
P7−O1
FP1−F3
F3−C3
C3−P3
P3−O1
FP2−F4
F4−C4
C4−P4
P4−O2
FP2−F8
F8−T8
T8−P8
P8−O2
FZ−CZ
CZ−PZ
6206
6208
6210
6212
6214
6216
6218
6220
6222
Figure 3. Another seizure in the scalp EEG of Patient B.
Not all rhythmic activity observed within the scalp
EEG is a reflection of an underlying seizure. Certain
Our goal is to construct a function f (X ) that maps a
feature vector X derived from the EEG onto the labels
Y = ±1 depending on whether X is representative of
seizure or non-seizure EEG. In the following subsec-
tions we discuss how we construct the feature vector
X , the discriminant function f (X ), and the training
sets.
3.1. Feature Vector Design
In section 2, we noted that features important for
characterizing EEG include its spectral structure, the
channels on which it manifests, and its short-term tem-
poral evolution. In the following subsections we illus-
trate how these features are extracted and encoded.
3.1.1. Spectral Features
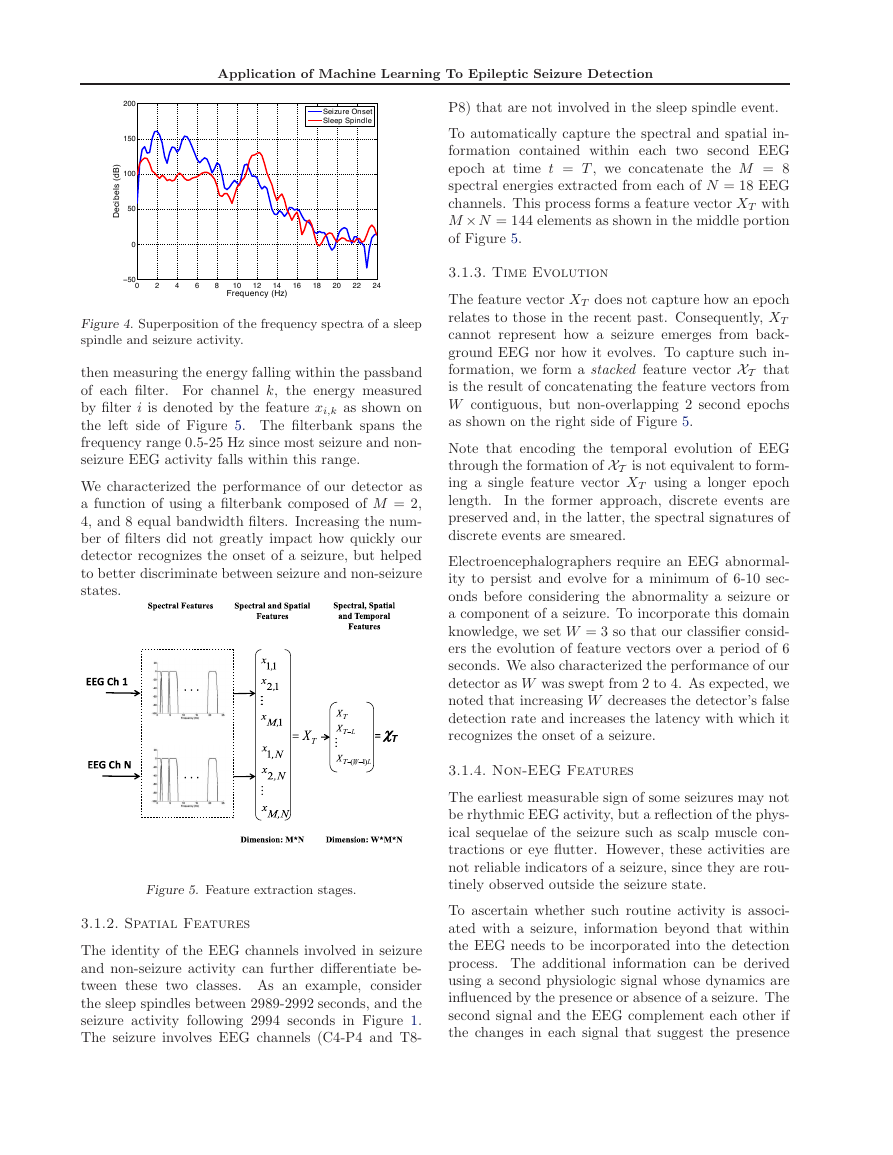
The rhythmic activity associated with the onset of a
seizure is often composed of multiple frequency com-
ponents. For instance, the blue curve in Figure 4
represents the spectrum of the rhythmic activity ob-
served on the channel FP2-F4 following the onset of
the seizure in Figure 1. The rhythmic activity is com-
posed of strong frequency components at 2, 5, and 11
Hz.
Considering multiple spectral components is necessary
for detecting seizures with high accuracy. The spec-
tral content of a seizure epoch may overlap the domi-
nant frequency of an epoch of non-seizure activity, but
what distinguishes the two is the presence or absence of
other spectral components. For example, the red curve
in Figure 4 represents the spectrum of a sleep spindle.
The two spectra overlap in the 10-12 Hz range, but
the seizure spectrum contains stronger low-frequency
spectral components.
Because of EEG non-stationarity, it is important to
extract spectral features from a reasonably small time
epoch. Since EEG cannot be segmented into short
physiologically relevant units, two second long epochs
are commonly used. We extract the spectral structure
of a sliding window of length L = 2 seconds by passing
it through a filterbank composed of M = 8 filters, and
�
Application of Machine Learning To Epileptic Seizure Detection
Seizure Onset
Sleep Spindle
P8) that are not involved in the sleep spindle event.
To automatically capture the spectral and spatial in-
formation contained within each two second EEG
epoch at time t = T , we concatenate the M = 8
spectral energies extracted from each of N = 18 EEG
channels. This process forms a feature vector XT with
M × N = 144 elements as shown in the middle portion
of Figure 5.
16
18
20
22
24
3.1.3. Time Evolution
200
150
100
50
0
)
B
d
(
s
l
e
b
i
c
e
D
−50
0
2
4
6
8
10
Frequency (Hz)
12
14
Figure 4. Superposition of the frequency spectra of a sleep
spindle and seizure activity.
then measuring the energy falling within the passband
of each filter. For channel k, the energy measured
by filter i is denoted by the feature xi,k as shown on
the left side of Figure 5. The filterbank spans the
frequency range 0.5-25 Hz since most seizure and non-
seizure EEG activity falls within this range.
We characterized the performance of our detector as
a function of using a filterbank composed of M = 2,
4, and 8 equal bandwidth filters. Increasing the num-
ber of filters did not greatly impact how quickly our
detector recognizes the onset of a seizure, but helped
to better discriminate between seizure and non-seizure
states.
Figure 5. Feature extraction stages.
3.1.2. Spatial Features
The identity of the EEG channels involved in seizure
and non-seizure activity can further differentiate be-
tween these two classes. As an example, consider
the sleep spindles between 2989-2992 seconds, and the
seizure activity following 2994 seconds in Figure 1.
The seizure involves EEG channels (C4-P4 and T8-
The feature vector XT does not capture how an epoch
relates to those in the recent past. Consequently, XT
cannot represent how a seizure emerges from back-
ground EEG nor how it evolves. To capture such in-
formation, we form a stacked feature vector XT that
is the result of concatenating the feature vectors from
W contiguous, but non-overlapping 2 second epochs
as shown on the right side of Figure 5.
Note that encoding the temporal evolution of EEG
through the formation of XT is not equivalent to form-
ing a single feature vector XT using a longer epoch
length.
In the former approach, discrete events are
preserved and, in the latter, the spectral signatures of
discrete events are smeared.
Electroencephalographers require an EEG abnormal-
ity to persist and evolve for a minimum of 6-10 sec-
onds before considering the abnormality a seizure or
a component of a seizure. To incorporate this domain
knowledge, we set W = 3 so that our classifier consid-
ers the evolution of feature vectors over a period of 6
seconds. We also characterized the performance of our
detector as W was swept from 2 to 4. As expected, we
noted that increasing W decreases the detector’s false
detection rate and increases the latency with which it
recognizes the onset of a seizure.
3.1.4. Non-EEG Features
The earliest measurable sign of some seizures may not
be rhythmic EEG activity, but a reflection of the phys-
ical sequelae of the seizure such as scalp muscle con-
tractions or eye flutter. However, these activities are
not reliable indicators of a seizure, since they are rou-
tinely observed outside the seizure state.
To ascertain whether such routine activity is associ-
ated with a seizure, information beyond that within
the EEG needs to be incorporated into the detection
process. The additional information can be derived
using a second physiologic signal whose dynamics are
influenced by the presence or absence of a seizure. The
second signal and the EEG complement each other if
the changes in each signal that suggest the presence
�
Application of Machine Learning To Epileptic Seizure Detection
)
z
H
1
1
−
+
5
2
(
/
y
g
r
e
n
E
1
0.8
0.6
0.4
0.2
0
0
0.2
5
34
2
1
0.4
Energy (0−16Hz)
0.6
0.8
1
Figure 6. Nonlinear decision boundary separating seizure
(red) and non-seizure (blue) feature vectors.
of a seizure rarely coincide during non-seizure states,
and often coincide at the time of an actual seizure.
Patient-specificity remains essential since the manner
in which the EEG and the second signal jointly change
during the seizure state is patient-specific.
The electrocardiogram (ECG), a non-invasive measure
of the electrical activity of the heart, is a good can-
didate for a complementary signal. It is easy to ac-
quire, and there is significant evidence that seizures
for many patients are associated with changes in heart
rate (Zijlman et al., 2002). Unfortunately, ECG data
was not available for most of the patients we were able
to study. However, we did have one patient (patient
24) for whom the EEG and ECG were simultaneously
recorded. In Section 7 we describe how features de-
rived from that patient’s ECG were concatenated with
our EEG features in order to improve detector perfor-
mance.
3.2. Feature Vector Classification
We classify a feature vector as representative of seizure
or non-seizure activity using a support-vector machine
(SVM). Since the seizure and non-seizure classes are
often not linearly separable, we generate non-linear
decision boundaries using an RBF kernel. Still the
SVM does not always enclose the most important data
points.
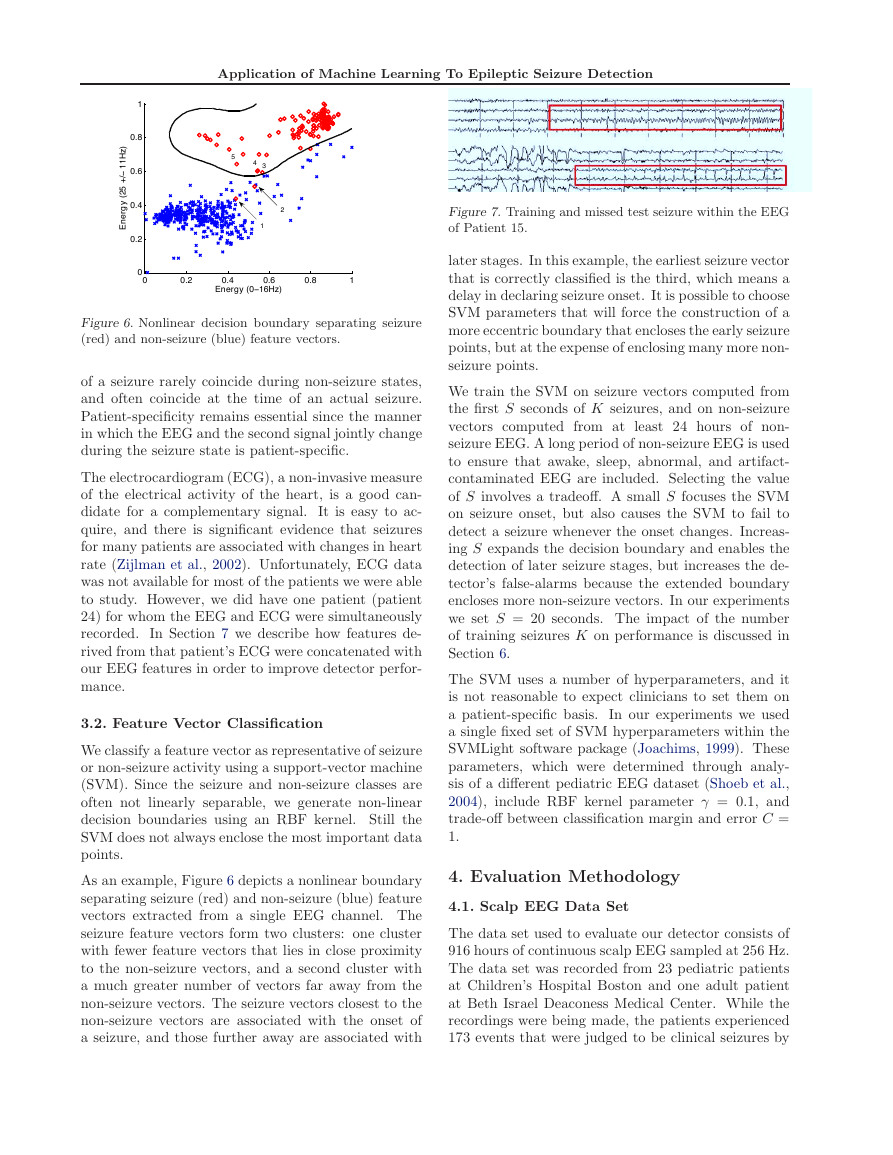
As an example, Figure 6 depicts a nonlinear boundary
separating seizure (red) and non-seizure (blue) feature
vectors extracted from a single EEG channel. The
seizure feature vectors form two clusters: one cluster
with fewer feature vectors that lies in close proximity
to the non-seizure vectors, and a second cluster with
a much greater number of vectors far away from the
non-seizure vectors. The seizure vectors closest to the
non-seizure vectors are associated with the onset of
a seizure, and those further away are associated with
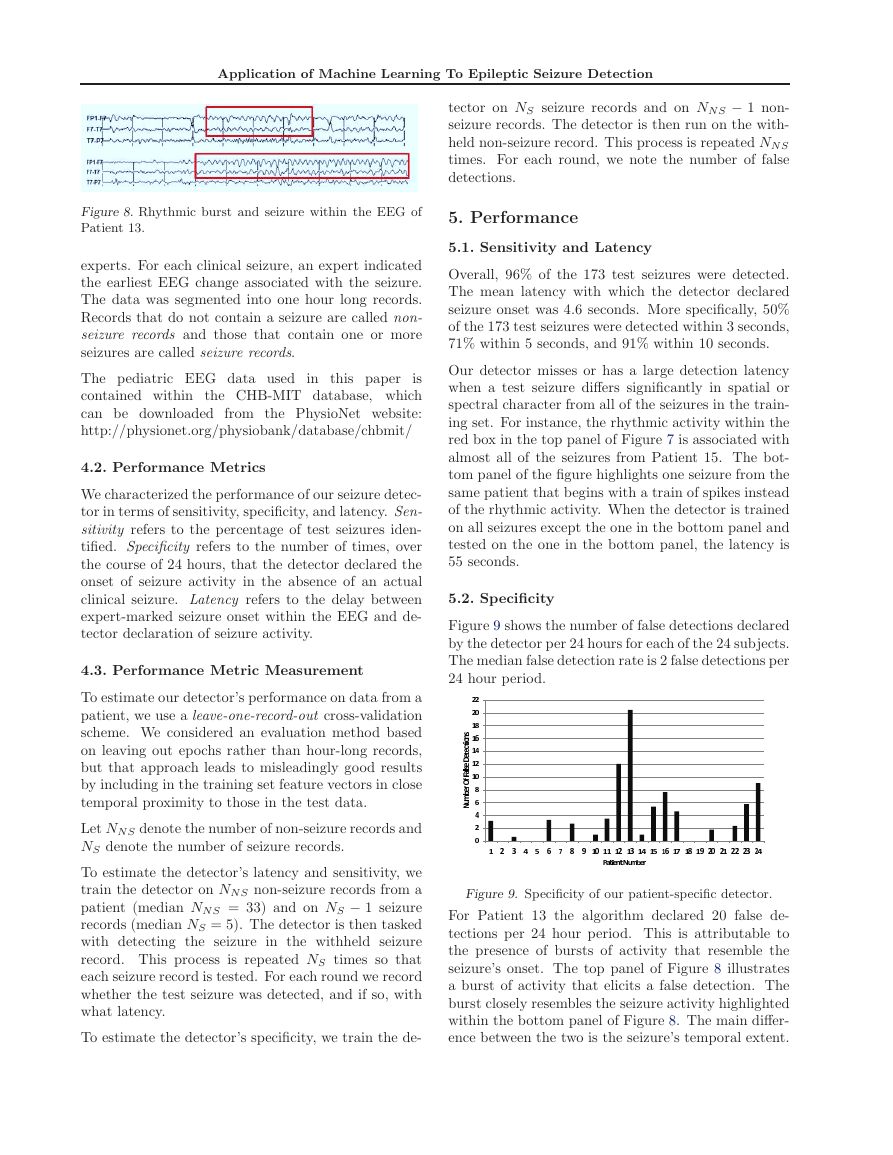
Figure 7. Training and missed test seizure within the EEG
of Patient 15.
later stages. In this example, the earliest seizure vector
that is correctly classified is the third, which means a
delay in declaring seizure onset. It is possible to choose
SVM parameters that will force the construction of a
more eccentric boundary that encloses the early seizure
points, but at the expense of enclosing many more non-
seizure points.
We train the SVM on seizure vectors computed from
the first S seconds of K seizures, and on non-seizure
vectors computed from at least 24 hours of non-
seizure EEG. A long period of non-seizure EEG is used
to ensure that awake, sleep, abnormal, and artifact-
contaminated EEG are included. Selecting the value
of S involves a tradeoff. A small S focuses the SVM
on seizure onset, but also causes the SVM to fail to
detect a seizure whenever the onset changes. Increas-
ing S expands the decision boundary and enables the
detection of later seizure stages, but increases the de-
tector’s false-alarms because the extended boundary
encloses more non-seizure vectors. In our experiments
we set S = 20 seconds. The impact of the number
of training seizures K on performance is discussed in
Section 6.
The SVM uses a number of hyperparameters, and it
is not reasonable to expect clinicians to set them on
a patient-specific basis. In our experiments we used
a single fixed set of SVM hyperparameters within the
SVMLight software package (Joachims, 1999). These
parameters, which were determined through analy-
sis of a different pediatric EEG dataset (Shoeb et al.,
2004), include RBF kernel parameter γ = 0.1, and
trade-off between classification margin and error C =
1.
4. Evaluation Methodology
4.1. Scalp EEG Data Set
The data set used to evaluate our detector consists of
916 hours of continuous scalp EEG sampled at 256 Hz.
The data set was recorded from 23 pediatric patients
at Children’s Hospital Boston and one adult patient
at Beth Israel Deaconess Medical Center. While the
recordings were being made, the patients experienced
173 events that were judged to be clinical seizures by
�
Application of Machine Learning To Epileptic Seizure Detection
tector on NS seizure records and on NN S − 1 non-
seizure records. The detector is then run on the with-
held non-seizure record. This process is repeated NN S
times. For each round, we note the number of false
detections.
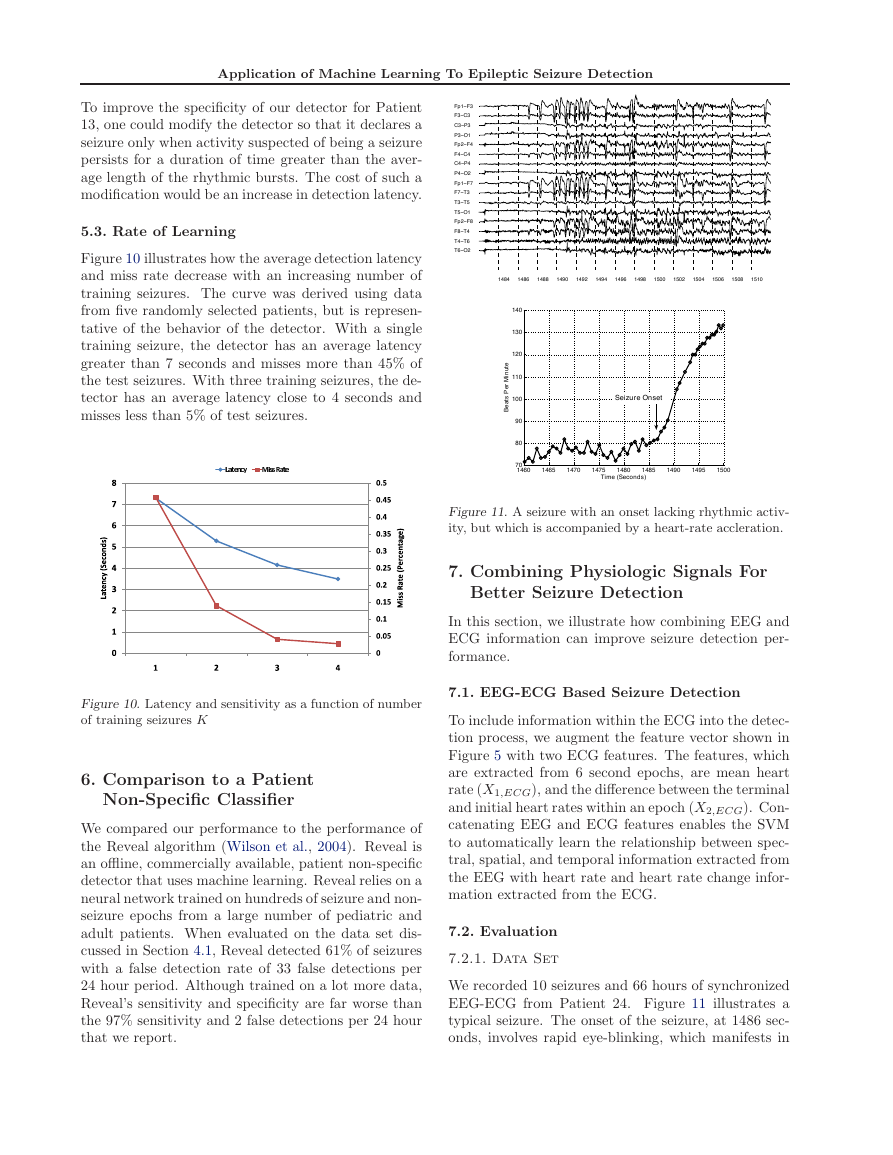
Figure 8. Rhythmic burst and seizure within the EEG of
Patient 13.
5. Performance
experts. For each clinical seizure, an expert indicated
the earliest EEG change associated with the seizure.
The data was segmented into one hour long records.
Records that do not contain a seizure are called non-
seizure records and those that contain one or more
seizures are called seizure records.
The pediatric EEG data used in this paper is
contained within the CHB-MIT database, which
can be downloaded from the PhysioNet website:
http://physionet.org/physiobank/database/chbmit/
4.2. Performance Metrics
We characterized the performance of our seizure detec-
tor in terms of sensitivity, specificity, and latency. Sen-
sitivity refers to the percentage of test seizures iden-
tified. Specificity refers to the number of times, over
the course of 24 hours, that the detector declared the
onset of seizure activity in the absence of an actual
clinical seizure. Latency refers to the delay between
expert-marked seizure onset within the EEG and de-
tector declaration of seizure activity.
4.3. Performance Metric Measurement
To estimate our detector’s performance on data from a
patient, we use a leave-one-record-out cross-validation
scheme. We considered an evaluation method based
on leaving out epochs rather than hour-long records,
but that approach leads to misleadingly good results
by including in the training set feature vectors in close
temporal proximity to those in the test data.
Let NN S denote the number of non-seizure records and
NS denote the number of seizure records.
To estimate the detector’s latency and sensitivity, we
train the detector on NN S non-seizure records from a
patient (median NN S = 33) and on NS − 1 seizure
records (median NS = 5). The detector is then tasked
with detecting the seizure in the withheld seizure
record. This process is repeated NS times so that
each seizure record is tested. For each round we record
whether the test seizure was detected, and if so, with
what latency.
To estimate the detector’s specificity, we train the de-
5.1. Sensitivity and Latency
Overall, 96% of the 173 test seizures were detected.
The mean latency with which the detector declared
seizure onset was 4.6 seconds. More specifically, 50%
of the 173 test seizures were detected within 3 seconds,
71% within 5 seconds, and 91% within 10 seconds.
Our detector misses or has a large detection latency
when a test seizure differs significantly in spatial or
spectral character from all of the seizures in the train-
ing set. For instance, the rhythmic activity within the
red box in the top panel of Figure 7 is associated with
almost all of the seizures from Patient 15. The bot-
tom panel of the figure highlights one seizure from the
same patient that begins with a train of spikes instead
of the rhythmic activity. When the detector is trained
on all seizures except the one in the bottom panel and
tested on the one in the bottom panel, the latency is
55 seconds.
5.2. Specificity
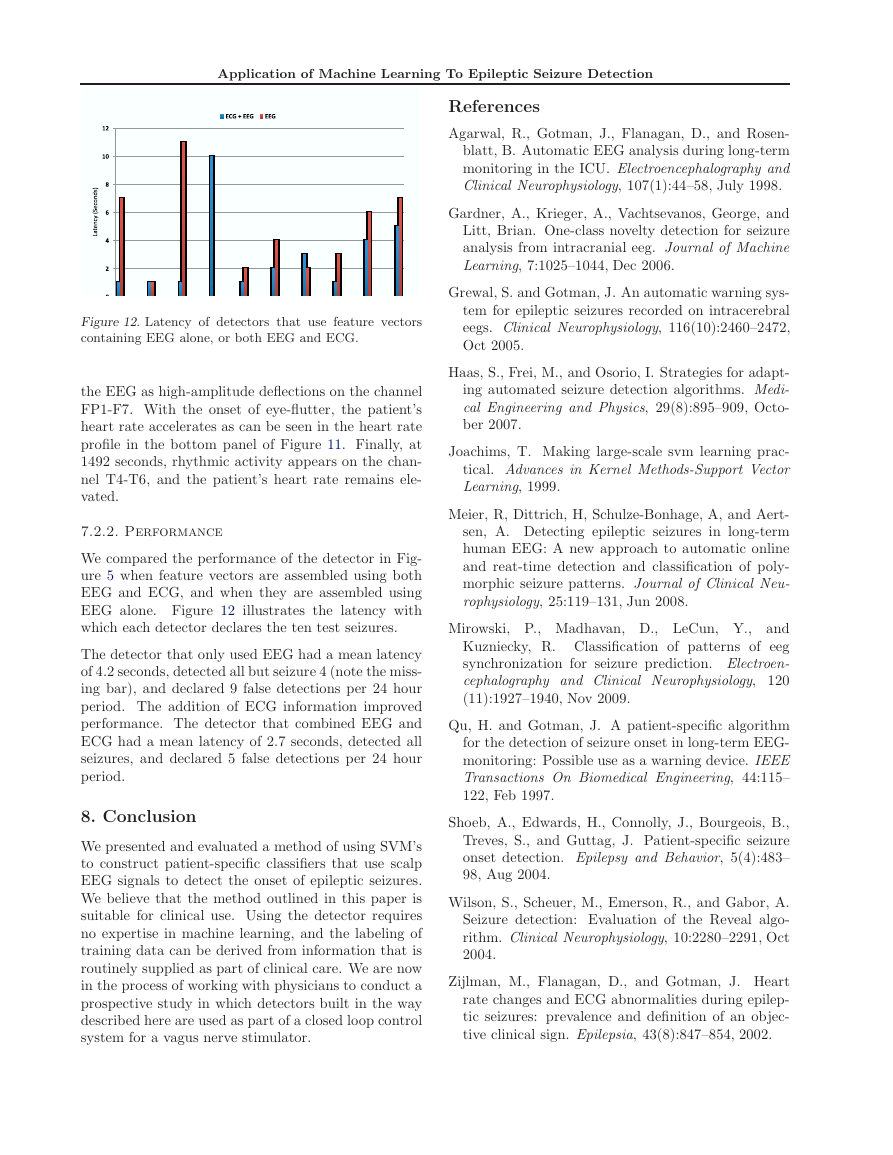
Figure 9 shows the number of false detections declared
by the detector per 24 hours for each of the 24 subjects.
The median false detection rate is 2 false detections per
24 hour period.
Figure 9. Specificity of our patient-specific detector.
For Patient 13 the algorithm declared 20 false de-
tections per 24 hour period. This is attributable to
the presence of bursts of activity that resemble the
seizure’s onset. The top panel of Figure 8 illustrates
a burst of activity that elicits a false detection. The
burst closely resembles the seizure activity highlighted
within the bottom panel of Figure 8. The main differ-
ence between the two is the seizure’s temporal extent.
�
Application of Machine Learning To Epileptic Seizure Detection
Fp1−F3
F3−C3
C3−P3
P3−O1
Fp2−F4
F4−C4
C4−P4
P4−O2
Fp1−F7
F7−T3
T3−T5
T5−O1
Fp2−F8
F8−T4
T4−T6
T6−O2
To improve the specificity of our detector for Patient
13, one could modify the detector so that it declares a
seizure only when activity suspected of being a seizure
persists for a duration of time greater than the aver-
age length of the rhythmic bursts. The cost of such a
modification would be an increase in detection latency.
5.3. Rate of Learning
Figure 10 illustrates how the average detection latency
and miss rate decrease with an increasing number of
training seizures. The curve was derived using data
from five randomly selected patients, but is represen-
tative of the behavior of the detector. With a single
training seizure, the detector has an average latency
greater than 7 seconds and misses more than 45% of
the test seizures. With three training seizures, the de-
tector has an average latency close to 4 seconds and
misses less than 5% of test seizures.
1484
1486
1488
1490
1492
1494
1496
1498
1500
1502
1504
1506
1508
1510
140
130
120
110
100
90
80
e
t
u
n
M
i
r
e
P
s
t
a
e
B
70
1460
1465
1470
Seizure Onset
1475
1480
1485
1490
1495
1500
Time (Seconds)
Figure 11. A seizure with an onset lacking rhythmic activ-
ity, but which is accompanied by a heart-rate accleration.
7. Combining Physiologic Signals For
Better Seizure Detection
In this section, we illustrate how combining EEG and
ECG information can improve seizure detection per-
formance.
7.1. EEG-ECG Based Seizure Detection
To include information within the ECG into the detec-
tion process, we augment the feature vector shown in
Figure 5 with two ECG features. The features, which
are extracted from 6 second epochs, are mean heart
rate (X1,ECG), and the difference between the terminal
and initial heart rates within an epoch (X2,ECG). Con-
catenating EEG and ECG features enables the SVM
to automatically learn the relationship between spec-
tral, spatial, and temporal information extracted from
the EEG with heart rate and heart rate change infor-
mation extracted from the ECG.
7.2. Evaluation
7.2.1. Data Set
We recorded 10 seizures and 66 hours of synchronized
EEG-ECG from Patient 24. Figure 11 illustrates a
typical seizure. The onset of the seizure, at 1486 sec-
onds, involves rapid eye-blinking, which manifests in
Figure 10. Latency and sensitivity as a function of number
of training seizures K
6. Comparison to a Patient
Non-Specific Classifier
We compared our performance to the performance of
the Reveal algorithm (Wilson et al., 2004). Reveal is
an offline, commercially available, patient non-specific
detector that uses machine learning. Reveal relies on a
neural network trained on hundreds of seizure and non-
seizure epochs from a large number of pediatric and
adult patients. When evaluated on the data set dis-
cussed in Section 4.1, Reveal detected 61% of seizures
with a false detection rate of 33 false detections per
24 hour period. Although trained on a lot more data,
Reveal’s sensitivity and specificity are far worse than
the 97% sensitivity and 2 false detections per 24 hour
that we report.
�
Application of Machine Learning To Epileptic Seizure Detection
References
Agarwal, R., Gotman, J., Flanagan, D., and Rosen-
blatt, B. Automatic EEG analysis during long-term
monitoring in the ICU. Electroencephalography and
Clinical Neurophysiology, 107(1):44–58, July 1998.
Gardner, A., Krieger, A., Vachtsevanos, George, and
Litt, Brian. One-class novelty detection for seizure
analysis from intracranial eeg. Journal of Machine
Learning, 7:1025–1044, Dec 2006.
Grewal, S. and Gotman, J. An automatic warning sys-
tem for epileptic seizures recorded on intracerebral
eegs. Clinical Neurophysiology, 116(10):2460–2472,
Oct 2005.
Haas, S., Frei, M., and Osorio, I. Strategies for adapt-
ing automated seizure detection algorithms. Medi-
cal Engineering and Physics, 29(8):895–909, Octo-
ber 2007.
Joachims, T. Making large-scale svm learning prac-
tical. Advances in Kernel Methods-Support Vector
Learning, 1999.
Meier, R, Dittrich, H, Schulze-Bonhage, A, and Aert-
sen, A. Detecting epileptic seizures in long-term
human EEG: A new approach to automatic online
and reat-time detection and classification of poly-
morphic seizure patterns. Journal of Clinical Neu-
rophysiology, 25:119–131, Jun 2008.
Mirowski, P., Madhavan, D., LeCun, Y., and
Kuzniecky, R. Classification of patterns of eeg
synchronization for seizure prediction. Electroen-
cephalography and Clinical Neurophysiology, 120
(11):1927–1940, Nov 2009.
Qu, H. and Gotman, J. A patient-specific algorithm
for the detection of seizure onset in long-term EEG-
monitoring: Possible use as a warning device. IEEE
Transactions On Biomedical Engineering, 44:115–
122, Feb 1997.
Shoeb, A., Edwards, H., Connolly, J., Bourgeois, B.,
Treves, S., and Guttag, J. Patient-specific seizure
onset detection. Epilepsy and Behavior, 5(4):483–
98, Aug 2004.
Wilson, S., Scheuer, M., Emerson, R., and Gabor, A.
Seizure detection: Evaluation of the Reveal algo-
rithm. Clinical Neurophysiology, 10:2280–2291, Oct
2004.
Zijlman, M., Flanagan, D., and Gotman, J. Heart
rate changes and ECG abnormalities during epilep-
tic seizures: prevalence and definition of an objec-
tive clinical sign. Epilepsia, 43(8):847–854, 2002.
Figure 12. Latency of detectors that use feature vectors
containing EEG alone, or both EEG and ECG.
the EEG as high-amplitude deflections on the channel
FP1-F7. With the onset of eye-flutter, the patient’s
heart rate accelerates as can be seen in the heart rate
profile in the bottom panel of Figure 11. Finally, at
1492 seconds, rhythmic activity appears on the chan-
nel T4-T6, and the patient’s heart rate remains ele-
vated.
7.2.2. Performance
We compared the performance of the detector in Fig-
ure 5 when feature vectors are assembled using both
EEG and ECG, and when they are assembled using
EEG alone. Figure 12 illustrates the latency with
which each detector declares the ten test seizures.
The detector that only used EEG had a mean latency
of 4.2 seconds, detected all but seizure 4 (note the miss-
ing bar), and declared 9 false detections per 24 hour
period. The addition of ECG information improved
performance. The detector that combined EEG and
ECG had a mean latency of 2.7 seconds, detected all
seizures, and declared 5 false detections per 24 hour
period.
8. Conclusion
We presented and evaluated a method of using SVM’s
to construct patient-specific classifiers that use scalp
EEG signals to detect the onset of epileptic seizures.
We believe that the method outlined in this paper is
suitable for clinical use. Using the detector requires
no expertise in machine learning, and the labeling of
training data can be derived from information that is
routinely supplied as part of clinical care. We are now
in the process of working with physicians to conduct a
prospective study in which detectors built in the way
described here are used as part of a closed loop control
system for a vagus nerve stimulator.
�


 2023年江西萍乡中考道德与法治真题及答案.doc
 2012年重庆南川中考生物真题及答案.doc
 2013年江西师范大学地理学综合及文艺理论基础考研真题.doc
 2020年四川甘孜小升初语文真题及答案I卷.doc
 2020年注册岩土工程师专业基础考试真题及答案.doc
 2023-2024学年福建省厦门市九年级上学期数学月考试题及答案.doc
 2021-2022学年辽宁省沈阳市大东区九年级上学期语文期末试题及答案.doc
 2022-2023学年北京东城区初三第一学期物理期末试卷及答案.doc
 2018上半年江西教师资格初中地理学科知识与教学能力真题及答案.doc
 2012年河北国家公务员申论考试真题及答案-省级.doc
 2020-2021学年江苏省扬州市江都区邵樊片九年级上学期数学第一次质量检测试题及答案.doc
 2022下半年黑龙江教师资格证中学综合素质真题及答案.doc