1
ENVI LiDAR Toolkit
Kevin M. Lausten
Copyright © 2007 ITT Visual Information Solutions
All Rights Reserved
http://www.ittvis.com/
ITT Visual Information Solutions is pleased to present a new add-on module to its
baseline ENVI package that can be used for ingesting, processing, visualizing and
exploiting three dimensional data sets captured by Light Detection and Ranging (LiDAR)
and Laser Radar (LaDAR) systems. LiDAR data are being used in a variety of remote
sensing communities to assist in the derivation of various geospatial products and
advanced analytic solutions. This new functionality has been developed for seamless
integration into our baseline ENVI package, and provides users of many formats of
LiDAR data the ability to interact with their data through a series of simple to use
interfaces in an industry accepted data processing environment.
ITT Visual Information Solutions • 4990 Pearl East Circle Boulder, CO 80301 • Ph: 303.786.9900 • Fax: 303.786.9909
�
2
Table of Contents
1. Introduction..................................................................................................................... 3
2. Preprocessing/Formatting ............................................................................................... 3
3. Geographic Processing.................................................................................................... 4
3.1 Decimating................................................................................................................ 4
3.2 Tiling......................................................................................................................... 5
3.3 Subset via Geographic Location ............................................................................... 5
3.4 Subset via ROI .......................................................................................................... 6
3.5 Merge ........................................................................................................................ 6
4. Visualization ................................................................................................................... 6
4.1 Point Representation ................................................................................................. 7
4.2 Image Rotation, Scale, Translation........................................................................... 9
4.3 Color Stretching........................................................................................................ 9
4.4 Image Overlay......................................................................................................... 10
5. Analysis......................................................................................................................... 11
5.1 Filtering................................................................................................................... 11
5.2 Raster Product Generation ...................................................................................... 15
5.3 Three Dimensional Texture Tools .......................................................................... 16
6. Conclusion .................................................................................................................... 18
7. Acknowledgements....................................................................................................... 18
8. References..................................................................................................................... 18
ITT Visual Information Solutions • 4990 Pearl East Circle Boulder, CO 80301 • Ph: 303.786.9900 • Fax: 303.786.9909
�
1. Introduction
3
LiDAR data, also known as LiDAR point cloud data, is becoming of greater
interest to the geospatial data community, as it precisely renders the shape, geometry and
geographical position of targets in three dimensions (x, y, z) from a remote location. In
addition to providing accurate shape, geometry and position, LiDAR sensors can provide
information regarding the reflective properties (at the illuminated wavelength) of a target
from the intensity of a return pulse. Also, a LiDAR sensor can capture multiple return
pulses from particular areas, indicating the existence of multiple objects and/or vegetation
cover. The information gathered by a LiDAR sensor can be used to better understand the
surface of the earth and the materials covering the surface of the earth. As the
capabilities of LiDAR sensors improve over time, data sets continue to grow in size.
With these increasing data sizes (some approaching 10 million points per file), it can
become more and more difficult for users to observe or detect a particular region of
interest.
ITT Visual Information Solutions has developed a robust package of LiDAR tools
in an easy-to-use interface to assist users in accomplishing their LiDAR related tasks.
Our toolkit features data filtering and geographic subsetting routines that assist the user in
extracting the necessary pieces of information pertinent to their analysis. Upon
application of these methods, information can be derived through the application of
analysis techniques much more effectively in a more time-efficient manner. The
information extracted from LiDAR data is important to a wide variety of communities
and industries including state and local governments, USGS, NOAA, the DoD/Intel
community, private corporations, civil engineering groups and academic researchers. In
an effort to accommodate these various users of LiDAR data with the functionality
necessary to efficiently extract information, we have developed a LiDAR toolkit that
provides our users with the ability to subset, merge, filter, visualize, process and analyze
their data through the use of a series of straight forward interfaces. The toolkit we have
developed was primarily focused on visualizing, processing and analyzing point cloud
data collected from a Linear-mode LiDAR detector system.
This document describes the basic functionality of the ITT Visual Information
Solutions LiDAR Toolkit, provides an overview of scenarios in which these processing
tools would be of particular use, and outlines some of the interfaces used to perform 3-D
analysis tasks.
2. Preprocessing/Formatting
Many LiDAR data providers deliver their sensor-collected data in a variety of
formats. It is the intention of the ITT toolkit to support as many different formats as
possible. As more and more users of LiDAR data cooperate and collaborate, there
appears to be a general trend in users wanting to work with their LiDAR data in .LAS
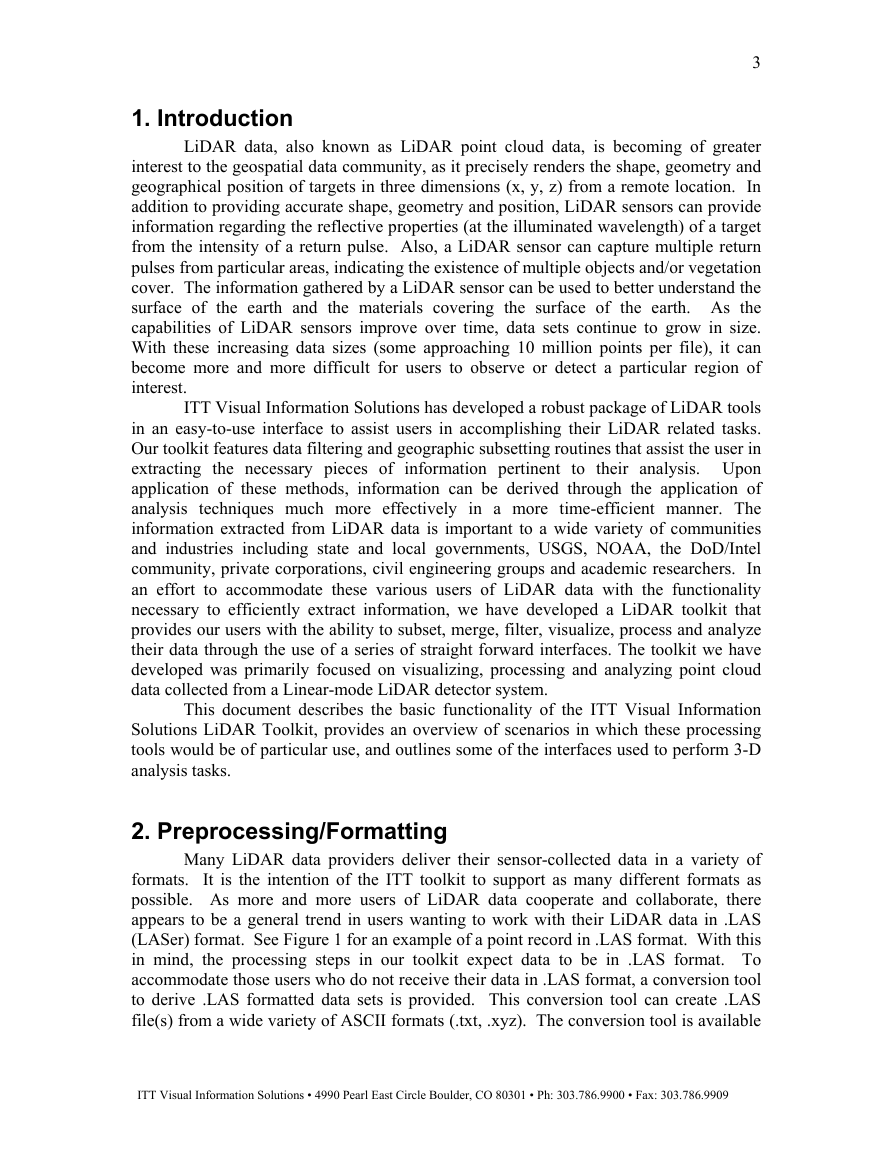
(LASer) format. See Figure 1 for an example of a point record in .LAS format. With this
in mind, the processing steps in our toolkit expect data to be in .LAS format. To
accommodate those users who do not receive their data in .LAS format, a conversion tool
to derive .LAS formatted data sets is provided. This conversion tool can create .LAS
file(s) from a wide variety of ASCII formats (.txt, .xyz). The conversion tool is available
ITT Visual Information Solutions • 4990 Pearl East Circle Boulder, CO 80301 • Ph: 303.786.9900 • Fax: 303.786.9909
�
4
under the main drop-down menu (LiDAR→Convert ASCII to LAS). Through
experience working with multiple data sets, we have seen some data providers are more
thorough than others with their cataloging of the pieces of information collected by the
LiDAR sensor. All of the information available in the ASCII file (x, y, z, intensity,
return number, etc.) will be included in the resultant .LAS file. In scenarios where values
such as intensity and/or return number are not provided, the resultant .LAS file simply
will populate that field with a default value of ‘0’. While we cannot claim to have
accommodated for every scenario in which a data provider may deliver their data, we
believe to have developed a robust conversion tool that can ingest a variety of ASCII data
sets that have varying degrees of completeness.
Point
Source
Easting
Angle
Return
Class
Elevation
Northing
Time
Figure 1: Graphical representation of a single point data structure in .LAS format
Intensity
User
3. Geographic Processing
Users of LiDAR data often have widely varied goals in mind. Some users are
focused on the three dimensional characteristics of a single feature or object in their data
set. Other users are interested in developing products that describe broad geographic
terrain features, such as digital elevation models. Based on these needs, some users only
want to work with a small geographic subset of the original data that is collected, while
other users require the ability to work with multiple data sets at once. The ITT Visual
Information Solutions LiDAR Toolkit provides functionality to perform a variety of
geographic processing routines to assist in the derivation of a LiDAR data set that allows
users to develop their output products in a more efficient fashion. These geographic
processing routines include decimation, tiling, subsetting and merge operations that each
can be used to create a modified 3-D data set in .LAS format for a more focused analysis.
3.1 Decimating
Decimating a LiDAR point cloud refers to the ability to create a reduced
resolution data set. When a decimation operation is performed, a new point cloud is
created that essentially covers the same geographic region, but less points are used to
describe the materials contained within the geographic region. This method can be
implemented when a user does not want or need all of the original information captured
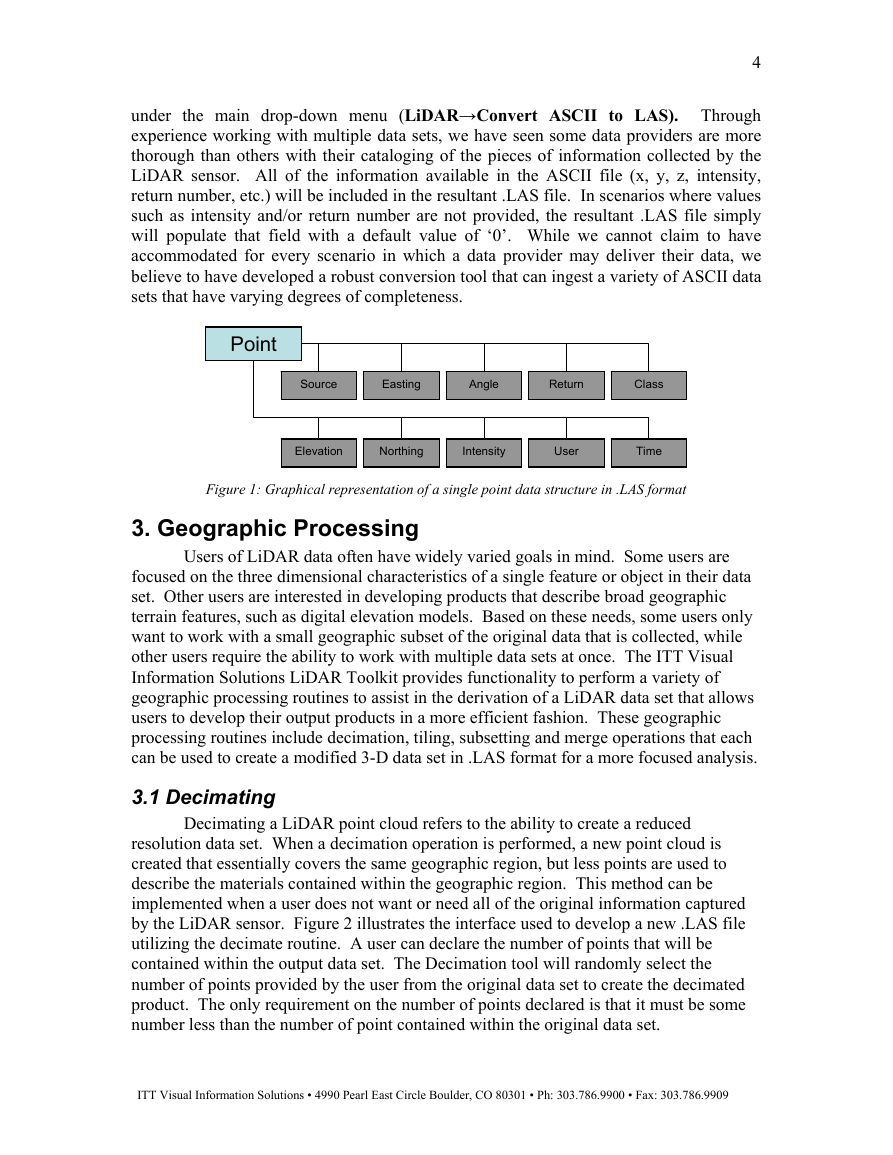
by the LiDAR sensor. Figure 2 illustrates the interface used to develop a new .LAS file
utilizing the decimate routine. A user can declare the number of points that will be
contained within the output data set. The Decimation tool will randomly select the
number of points provided by the user from the original data set to create the decimated
product. The only requirement on the number of points declared is that it must be some
number less than the number of point contained within the original data set.
ITT Visual Information Solutions • 4990 Pearl East Circle Boulder, CO 80301 • Ph: 303.786.9900 • Fax: 303.786.9909
�
5
Figure 2: Interface used for decimating a .LAS format point cloud (LiDAR→Decimate LAS File(s))
3.2 Tiling
Tiling is a simple way of dividing a point cloud data set at uniform intervals into
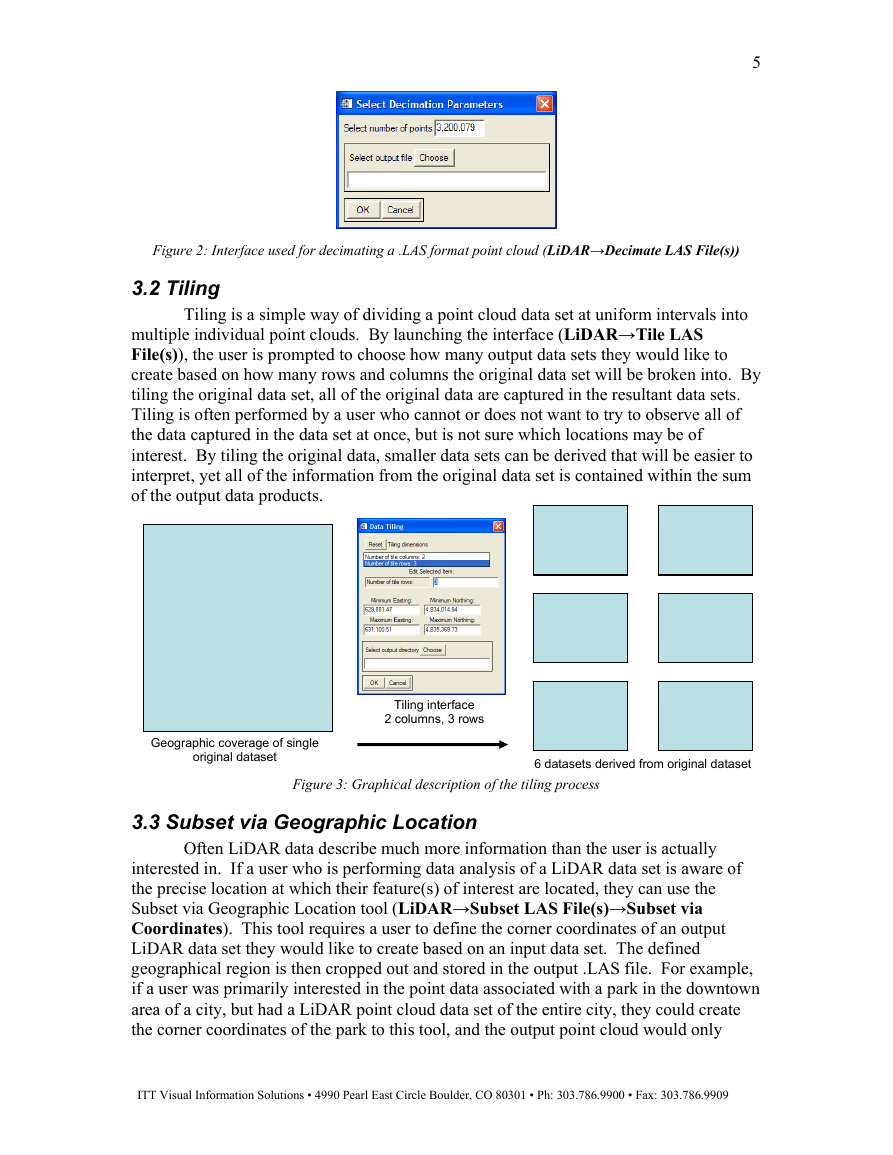
multiple individual point clouds. By launching the interface (LiDAR→Tile LAS
File(s)), the user is prompted to choose how many output data sets they would like to
create based on how many rows and columns the original data set will be broken into. By
tiling the original data set, all of the original data are captured in the resultant data sets.
Tiling is often performed by a user who cannot or does not want to try to observe all of
the data captured in the data set at once, but is not sure which locations may be of
interest. By tiling the original data, smaller data sets can be derived that will be easier to
interpret, yet all of the information from the original data set is contained within the sum
of the output data products.
Tiling interface
2 columns, 3 rows
Geographic coverage of single
original dataset
6 datasets derived from original dataset
Figure 3: Graphical description of the tiling process
3.3 Subset via Geographic Location
Often LiDAR data describe much more information than the user is actually
interested in. If a user who is performing data analysis of a LiDAR data set is aware of
the precise location at which their feature(s) of interest are located, they can use the
Subset via Geographic Location tool (LiDAR→Subset LAS File(s)→Subset via
Coordinates). This tool requires a user to define the corner coordinates of an output
LiDAR data set they would like to create based on an input data set. The defined
geographical region is then cropped out and stored in the output .LAS file. For example,
if a user was primarily interested in the point data associated with a park in the downtown
area of a city, but had a LiDAR point cloud data set of the entire city, they could create
the corner coordinates of the park to this tool, and the output point cloud would only
ITT Visual Information Solutions • 4990 Pearl East Circle Boulder, CO 80301 • Ph: 303.786.9900 • Fax: 303.786.9909
�
6
contain points that fall within those boundaries. As a result, the derived point cloud
would describe the park area and none of the urban features surrounding the park that
were contained within the original data set.
3.4 Subset via ROI
Similar to the Subset via Geographic Location tool, the Subset via ROI tool
allows a user to create a single output .LAS file based on geographic boundaries provided
by the user. However, this tool allows a user to define the boundary in ENVI using a
georeferenced image of the same geographic area as the point cloud data set. Prior to
launching the Subset via ROI tool, a user must open this georeferenced image in ENVI
and bring up the ROI (Regions of Interest) tool. A user must then define a region of
interest that represents the geographic area(s) they are interested in further investigating.
For more information on ENVI’S ROI tool consult your ENVI Help system. Once a
region of interest is defined in ENVI, a user may launch the Subset via ROI tool
(LiDAR→Subset LAS File(s)→Subset via Image/ROI) and choose the region of
interest that defines the geographic boundaries of the point cloud they would like to
create. The output point cloud contains only those points that fall within the geographic
boundaries of the user-defined region of interest.
3.5 Merge
While some users want to whittle down their LiDAR data sets to observe smaller
scale features (i.e. buildings or vehicles), other users are particularly interested in larger
scale analysis, such as creating a county-wide or state-wide Digital Surface Model
(DSM). To derive these types of large-scale products, a user may be required to work
with multiple data sets that were collected adjacent to each other. In cases such as these,
it makes sense to create a single point cloud data set that contains all of the data from
multiple individual data sets. This can be performed by using the merge functionality in
the toolkit (LiDAR→Merge LAS Files). A user must simply launch the tool, choose the
input data sets and a single output .LAS file is created. Upon merging these data sets into
a single (much larger) data set, analysis techniques can be used to create the DSM from
the merged data set. While deriving a single DSM for each point cloud and then
mosaicing them together is possible, this would be much more time consuming than
simply merging the individual point data sets to a single data set.
4. Visualization
A key to handling and understanding a LIDAR data set is having the capability to
visualize your data in three dimensions. In the development of the toolkit, we have built
functionality into our viewer such that a user can visually interpret as much information
as possible. Included within our viewer functionality is the ability to perform
rotation/translation/scale operations to observe the data set from essentially all possible
orientations and positions in and around the data set. Individual points are represented in
the viewer as either vertices of a Delaunay-triangle based surface, a grid surface or as
individual points. The color of the points/surface is either based on elevation or a
georeferenced panchromatic or color composite image that can be overlaid onto the point
cloud. If the user chooses to color the points based on elevation, a variety of stretching
ITT Visual Information Solutions • 4990 Pearl East Circle Boulder, CO 80301 • Ph: 303.786.9900 • Fax: 303.786.9909
�
7
routines are provided to assist the user in detecting features of varying size. To begin
visualizing a LiDAR data set, the viewer can be launched by selecting LiDAR→3D
LiDAR Levels Viewer.
Three dimensional data are often difficult to interpret in a two dimensional
representation, such as a computer screen. Considering this issue, we have implemented
some visualization strategies to assist the user in understanding the 3-D nature of their
data through the use of a 2-D representation.
First, data points are initially colored based on their elevation values. Realizing
the elevation distribution of the points contained within the data set, a series of elevation
bins are created that evenly span the entire elevation range of the data. By default, we
use 16 elevation bins, but this value can be altered using a filtering interface (see section
5.1.1). For example, if a user was interested in viewing a point cloud data set with points
that ranged in elevation from 100 meters above sea level to 260 meters above sea level,
each bin would represent 10 meters of elevation. Each individual bin is assigned a color
(with bins closest to the ground getting more natural colors: bin one = tan/soil, bin two =
green/vegetation, etc.) and every point is assigned to one of the elevation bins. All of the
points that fall within a particular elevation bin are therefore assigned that color when the
entire data set is rendered in the viewer.
Second, a series of background lights are added to the viewer which are
unobservable by the user. The user can, however, observe the effects of these lights.
When data are rendered as a surface, reflection and shading caused by the orientation of
surfaces and the position of the lights give the impression of depth; thus, improving the
ability to interpret the additional dimension of information.
4.1 Point Representation
In an effort to provide our users with as much flexibility as possible, we provide a
variety of point representation options. By default, when a user chooses to load a point
cloud data set into the viewer (File→Open LAS File), the data are rendered as a series of
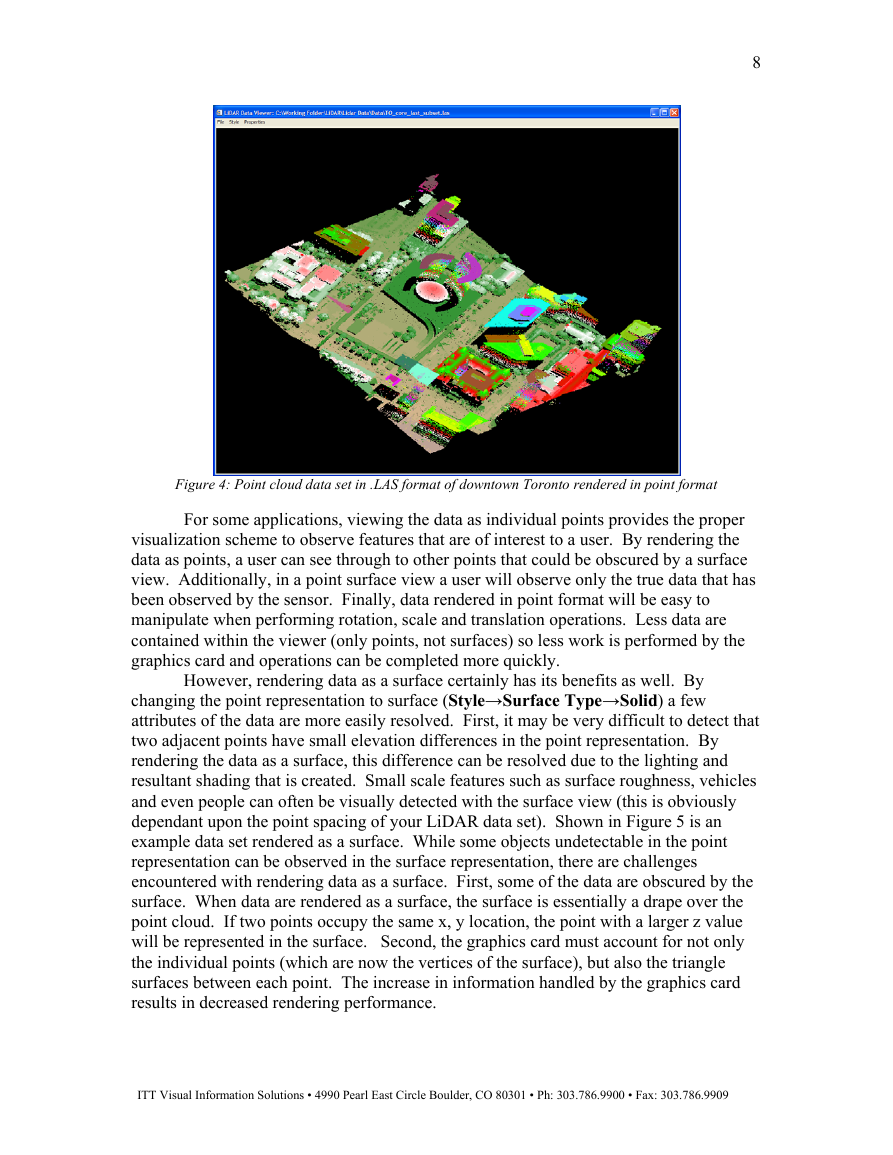
individual points. See Figure 4 for an example of data rendered in point format.
ITT Visual Information Solutions • 4990 Pearl East Circle Boulder, CO 80301 • Ph: 303.786.9900 • Fax: 303.786.9909
�
8
Figure 4: Point cloud data set in .LAS format of downtown Toronto rendered in point format
For some applications, viewing the data as individual points provides the proper
visualization scheme to observe features that are of interest to a user. By rendering the
data as points, a user can see through to other points that could be obscured by a surface
view. Additionally, in a point surface view a user will observe only the true data that has
been observed by the sensor. Finally, data rendered in point format will be easy to
manipulate when performing rotation, scale and translation operations. Less data are
contained within the viewer (only points, not surfaces) so less work is performed by the
graphics card and operations can be completed more quickly.
However, rendering data as a surface certainly has its benefits as well. By
changing the point representation to surface (Style→Surface Type→Solid) a few
attributes of the data are more easily resolved. First, it may be very difficult to detect that
two adjacent points have small elevation differences in the point representation. By
rendering the data as a surface, this difference can be resolved due to the lighting and
resultant shading that is created. Small scale features such as surface roughness, vehicles
and even people can often be visually detected with the surface view (this is obviously
dependant upon the point spacing of your LiDAR data set). Shown in Figure 5 is an
example data set rendered as a surface. While some objects undetectable in the point
representation can be observed in the surface representation, there are challenges
encountered with rendering data as a surface. First, some of the data are obscured by the
surface. When data are rendered as a surface, the surface is essentially a drape over the
point cloud. If two points occupy the same x, y location, the point with a larger z value
will be represented in the surface. Second, the graphics card must account for not only
the individual points (which are now the vertices of the surface), but also the triangle
surfaces between each point. The increase in information handled by the graphics card
results in decreased rendering performance.
ITT Visual Information Solutions • 4990 Pearl East Circle Boulder, CO 80301 • Ph: 303.786.9900 • Fax: 303.786.9909
�



 2023年江西萍乡中考道德与法治真题及答案.doc
 2012年重庆南川中考生物真题及答案.doc
 2013年江西师范大学地理学综合及文艺理论基础考研真题.doc
 2020年四川甘孜小升初语文真题及答案I卷.doc
 2020年注册岩土工程师专业基础考试真题及答案.doc
 2023-2024学年福建省厦门市九年级上学期数学月考试题及答案.doc
 2021-2022学年辽宁省沈阳市大东区九年级上学期语文期末试题及答案.doc
 2022-2023学年北京东城区初三第一学期物理期末试卷及答案.doc
 2018上半年江西教师资格初中地理学科知识与教学能力真题及答案.doc
 2012年河北国家公务员申论考试真题及答案-省级.doc
 2020-2021学年江苏省扬州市江都区邵樊片九年级上学期数学第一次质量检测试题及答案.doc
 2022下半年黑龙江教师资格证中学综合素质真题及答案.doc