logo资料库

SAGA_User_Guide.pdf

第1页 / 共336页
第2页 / 共336页
第3页 / 共336页
第4页 / 共336页
第5页 / 共336页
第6页 / 共336页
第7页 / 共336页
第8页 / 共336页
资料共336页,剩余部分请下载后查看
User Guide for SAGA (version 2.0.5)
Acknowledgment
Table of Content
Chapter 1 – Introduction to Volume 2
Description: Chapter 2 – Some SAGA Basics
Description: Chapter 3 – SAGA Buffer Modules
Grid – Calculus/Grid Calculator
Description: Chapter 4 – Creating Data Layers from DEMs in SAGA
Description: Chapter 5 – Generating a Watershed Basins Layer
Description: Chapter 6 – Evaluating Proposed Community Park Sites
Description: Chapter 7 – Using SAGA With Digital Satellite Images
Description: Chapter 8 – The SAGA Point Cloud (.spc) Data Type
Description: Volume 1
Chapter 2 - Some SAGA Basics
List of Data Layers, Tables and Maps In Work Session
Rename a Grid or Shapes Data Layer
The SAGA Grid Calculator
Re-Classifying Grid Data Values
Using the Change Grid Values Module
Using the Reclassify Grid Values Module
Creating a Vector Layer from a Grid Data Layer
Viewshed Analysis
Chapter 3 - SAGA Buffer Modules
Introduction
Grid – Calculus/Grid Calculator
Grid – Tools/Threshold Buffer
The Shapes – Tools/Shapes Buffer Module
Example 1
Example 2
The Grid – Tools/Grid Buffer Module
Example 1
Example 2
The Grid – Tools/Grid Proximity Buffer Module
Example 1
Example 2
The Grid – Tools/Threshold Buffer Module
Example 1
Example 2
Example 3
Chapter 4 – Creating Data Layers from DEMs in SAGA
Introduction
Creating Slope and Aspect Maps from a DEM
Developing Terrain From Grid Data Layers
Creating Contour Shapes Data Layers
Creating Slope and Aspect Maps From a DEM
Developing Terrain Form Grid Data Layers
Creating Contour Shapes Data Layers
Chapter 5 - Generating a Watershed Basins Layer
Preparing a DEM Data Layer for Hydrology Analysis
Calculating Catchment Area
Defining Channel Networks
Defining Watershed Basins
Chapter 6 - Evaluating Proposed Community Park Sites
Grid-Calculus/Grid Calculator
Selection Criteria
Criterion 1: Identifying the boundary for Grapeview
Criterion 2: identifying Open Space land use in Mason County and Grapeview
Criterion 3: Open Space parcels must be a minimum size of 5 contiguous acres
Criterion 4: Open Space land parcels with road access
Criterion 5: The park parcel cannot be adjacent to these land uses: industry, commercial, mineral extraction, and utilities
Criterion 6: The park parcel may be adjacent to these land uses: agriculture, commercial recreation, public, rural and residential
Criterion 7: The park is most suitable adjacent to these land uses: open space, forest, rural, and water
Criterion 8: The highest amount of ground surface with slopes between 0 and 3 degrees
Criterion 9: The viewing of these land use classes in the foreground and middle-ground will be minimized: industry, commercial, mineral extraction, utilities. This criterion will be used to compare parcel choices
Discussion of Results
Summary
Chapter 7 – Using SAGA With Digital Satellite Images
Imagery Background Information
Contrast Enhancements
Filters
Ratios
Composite Images
Vegetation Indices
The Normalized Difference Vegetation Index
Ratio
The Ratio Vegetation Index (RVI)
Transformed Vegetation Index (TVI)
Corrected Transformed Vegetation Index (CTVI)
Normalized Ratio Vegetation Index (NRVI)
Image Classification
Unsupervised Classification
Supervised Classification
Preparing the Input Polygon Shapes Data Layer
Chapter 8 – The SAGA Point Cloud (.spc) Data Type
Point Cloud Type Background Information
Importing a .las File
Cluster Analysis for Point Clouds
How to Delete a Point Cloud Attribute
Point Cloud Attribute Calculator
Selecting a Subset of a Point Cloud Layer
The Shapes – Point Clouds/Point Cloud Reclassifier/Subset Extractor Module
Thinning a Point Cloud
Creating a Point Cloud Layer from Other SAGA Data Types
Converting a Point Cloud to a Grid Data Layer
Saving a Point Cloud Layer to Shapes Data Layer
Transforming a Point Cloud Layer
The Shapes – Point Cloud Viewer/Point Cloud Viewer Module
APPENDIX I – Volume 2 Example Data Layers

User Guide for SAGA (version 2.0.5) By Vern Cimmery November, 2010 Volume 2 i
User Guide for SAGA (version 2.0.5) Copyright ©2010 Vern Cimmery Permission is granted to copy, distribute and/or modify this document under the terms of the Creative Commons Attribution–ShareAlike license. A copy of the license can be downloaded from the Creative Commons website at www.creativecommons.org. The license applies to the entire text of this book, plus all the illustrations that are by Vern Cimmery. ii
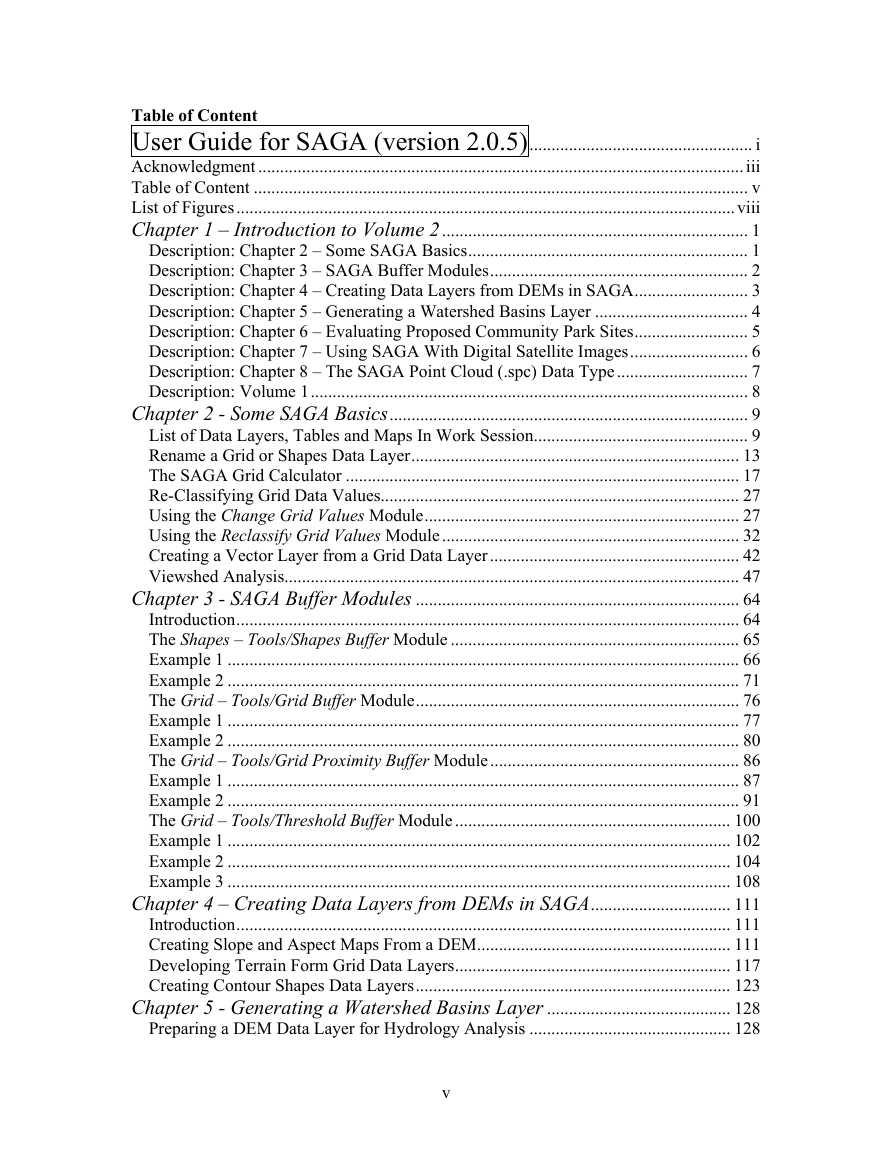
Acknowledgment Most of the System for Automated Geo-Scientific Analysis or SAGA was created and developed by the working-group Geosystem Analysis (formerly associated with Göttingen University and currently with Hamburg University), headed by Prof. Dr. Jürgen Böhner. The current versions of SAGA are mainly due to the creativeness and participation of the core set of developers; namely Rüdiger Köthe, Andre Ringeler, Victor Olaya, Dr. Christian Caro, Dr. Volker Wichmann, Prof. Dr. Jürgen Böhner and, in particular Dr. Olaf Conrad, who shouldered the main programming work. However, SAGA would not have reached this level of sophistication without that multitude of methodical innovations cooperatively worked out by the working-group Geosystem Analysis as a whole in context with national and international environment related research projects. Dr. Volker Wichmann has provided a significant amount of assistance in the production of this guide. His feedback and supportive collaboration have made this User Guide for SAGA (version 2.0.5) feasible and possible. I cannot express enough appreciation for his support. Volume 2 of this User Guide is an expansion of Chapter 7 in the 2007 User Guide for SAGA Version 2. As such, it introduces users to the use of SAGA functions and modules to address hypothetical spatial analysis issues. This volume assumes reader familiarity with Volume 1. Please feel free to e-mail me if you have any questions or suggestions for improvement. My e-mail address is: kapcimmery@hotmail.com This User Guide for SAGA (Volume 2) is contributed to the SAGA user community to, hopefully, assist the user in successfully applying the SAGA functions, tools, commands, and procedures in addressing applications specific to spatial analysis. Please feel free to make a copy, reference the document, etc., as you desire. I would appreciate if you gave me credit for the effort I have invested. There is no intention to violate any software copyrights indirectly related to SAGA. You are free: • To copy, distribute, display, and use this manual. • To make derivative works. • To make commercial use of this work. Under the following conditions: • Attribution. You must give the original author credit. iii
• Share alike. If you alter, transform, or build upon this work, you may distribute the result. • Work only under a license identical to this one. • For any reuse or distribution, you must make clear to others the license terms of • Any of these conditions can be waived if you get permission from the copyright this work. holder. Your fair use and other rights are in no way affected by the above. For any further information, please contact the author at the following e–mail address kapcimmery@hotmail.com. iv
Table of Content User Guide for SAGA (version 2.0.5)................................................... i Acknowledgment ...............................................................................................................iii Table of Content ................................................................................................................. v List of Figures..................................................................................................................viii Chapter 1 – Introduction to Volume 2...................................................................... 1 Description: Chapter 2 – Some SAGA Basics................................................................ 1 Description: Chapter 3 – SAGA Buffer Modules........................................................... 2 Description: Chapter 4 – Creating Data Layers from DEMs in SAGA.......................... 3 Description: Chapter 5 – Generating a Watershed Basins Layer ................................... 4 Description: Chapter 6 – Evaluating Proposed Community Park Sites.......................... 5 Description: Chapter 7 – Using SAGA With Digital Satellite Images........................... 6 Description: Chapter 8 – The SAGA Point Cloud (.spc) Data Type.............................. 7 Description: Volume 1.................................................................................................... 8 Chapter 2 - Some SAGA Basics.................................................................................. 9 List of Data Layers, Tables and Maps In Work Session................................................. 9 Rename a Grid or Shapes Data Layer........................................................................... 13 The SAGA Grid Calculator .......................................................................................... 17 Re-Classifying Grid Data Values.................................................................................. 27 Using the Change Grid Values Module........................................................................ 27 Using the Reclassify Grid Values Module.................................................................... 32 Creating a Vector Layer from a Grid Data Layer......................................................... 42 Viewshed Analysis........................................................................................................ 47 Chapter 3 - SAGA Buffer Modules .......................................................................... 64 Introduction................................................................................................................... 64 The Shapes – Tools/Shapes Buffer Module .................................................................. 65 Example 1 ..................................................................................................................... 66 Example 2 ..................................................................................................................... 71 The Grid – Tools/Grid Buffer Module.......................................................................... 76 Example 1 ..................................................................................................................... 77 Example 2 ..................................................................................................................... 80 The Grid – Tools/Grid Proximity Buffer Module......................................................... 86 Example 1 ..................................................................................................................... 87 Example 2 ..................................................................................................................... 91 The Grid – Tools/Threshold Buffer Module ............................................................... 100 Example 1 ................................................................................................................... 102 Example 2 ................................................................................................................... 104 Example 3 ................................................................................................................... 108 Chapter 4 – Creating Data Layers from DEMs in SAGA................................ 111 Introduction................................................................................................................. 111 Creating Slope and Aspect Maps From a DEM.......................................................... 111 Developing Terrain Form Grid Data Layers............................................................... 117 Creating Contour Shapes Data Layers........................................................................ 123 Chapter 5 - Generating a Watershed Basins Layer .......................................... 128 Preparing a DEM Data Layer for Hydrology Analysis .............................................. 128 v
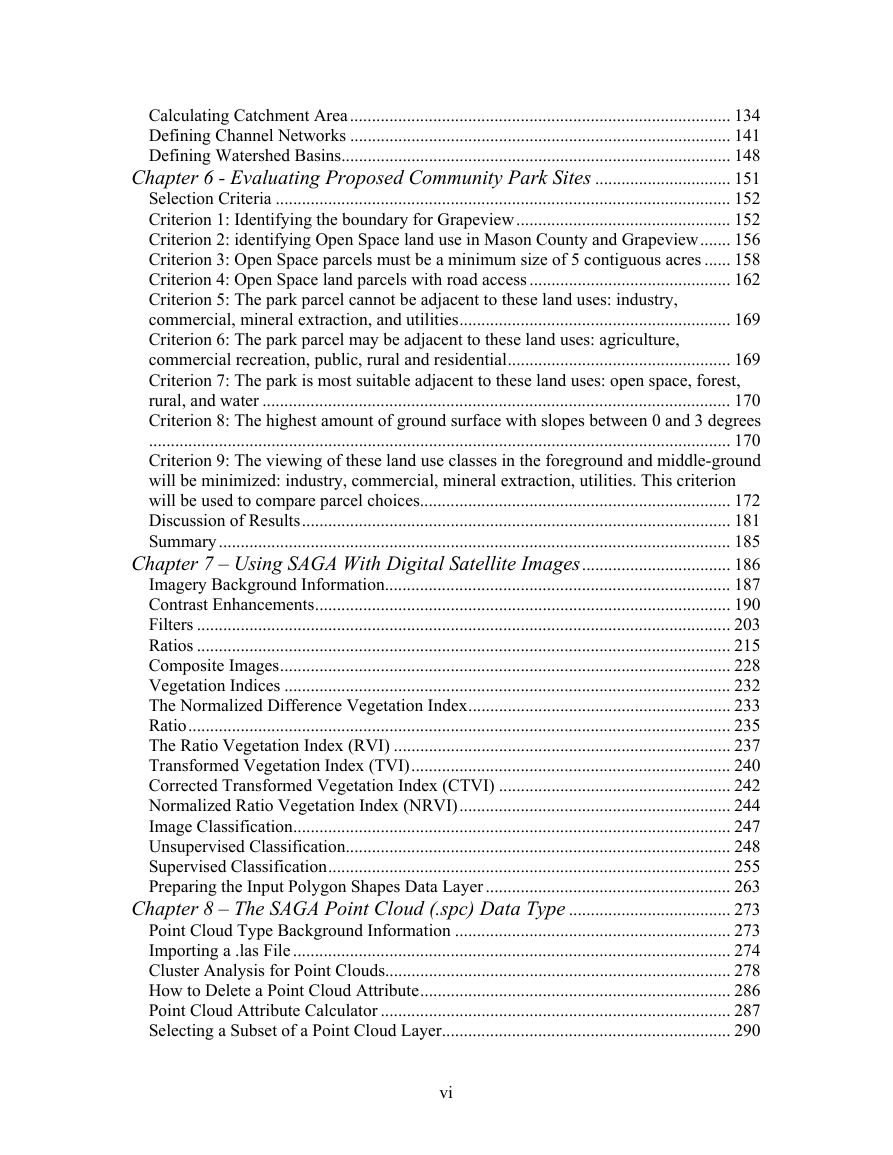
Calculating Catchment Area....................................................................................... 134 Defining Channel Networks ....................................................................................... 141 Defining Watershed Basins......................................................................................... 148 Chapter 6 - Evaluating Proposed Community Park Sites ............................... 151 Selection Criteria ........................................................................................................ 152 Criterion 1: Identifying the boundary for Grapeview................................................. 152 Criterion 2: identifying Open Space land use in Mason County and Grapeview....... 156 Criterion 3: Open Space parcels must be a minimum size of 5 contiguous acres ...... 158 Criterion 4: Open Space land parcels with road access .............................................. 162 Criterion 5: The park parcel cannot be adjacent to these land uses: industry, commercial, mineral extraction, and utilities.............................................................. 169 Criterion 6: The park parcel may be adjacent to these land uses: agriculture, commercial recreation, public, rural and residential................................................... 169 Criterion 7: The park is most suitable adjacent to these land uses: open space, forest, rural, and water ........................................................................................................... 170 Criterion 8: The highest amount of ground surface with slopes between 0 and 3 degrees ..................................................................................................................................... 170 Criterion 9: The viewing of these land use classes in the foreground and middle-ground will be minimized: industry, commercial, mineral extraction, utilities. This criterion will be used to compare parcel choices....................................................................... 172 Discussion of Results.................................................................................................. 181 Summary..................................................................................................................... 185 Chapter 7 – Using SAGA With Digital Satellite Images.................................. 186 Imagery Background Information............................................................................... 187 Contrast Enhancements............................................................................................... 190 Filters .......................................................................................................................... 203 Ratios .......................................................................................................................... 215 Composite Images....................................................................................................... 228 Vegetation Indices ...................................................................................................... 232 The Normalized Difference Vegetation Index............................................................ 233 Ratio............................................................................................................................ 235 The Ratio Vegetation Index (RVI) ............................................................................. 237 Transformed Vegetation Index (TVI)......................................................................... 240 Corrected Transformed Vegetation Index (CTVI) ..................................................... 242 Normalized Ratio Vegetation Index (NRVI).............................................................. 244 Image Classification.................................................................................................... 247 Unsupervised Classification........................................................................................ 248 Supervised Classification............................................................................................ 255 Preparing the Input Polygon Shapes Data Layer ........................................................ 263 Chapter 8 – The SAGA Point Cloud (.spc) Data Type ..................................... 273 Point Cloud Type Background Information ............................................................... 273 Importing a .las File .................................................................................................... 274 Cluster Analysis for Point Clouds............................................................................... 278 How to Delete a Point Cloud Attribute....................................................................... 286 Point Cloud Attribute Calculator ................................................................................ 287 Selecting a Subset of a Point Cloud Layer.................................................................. 290 vi
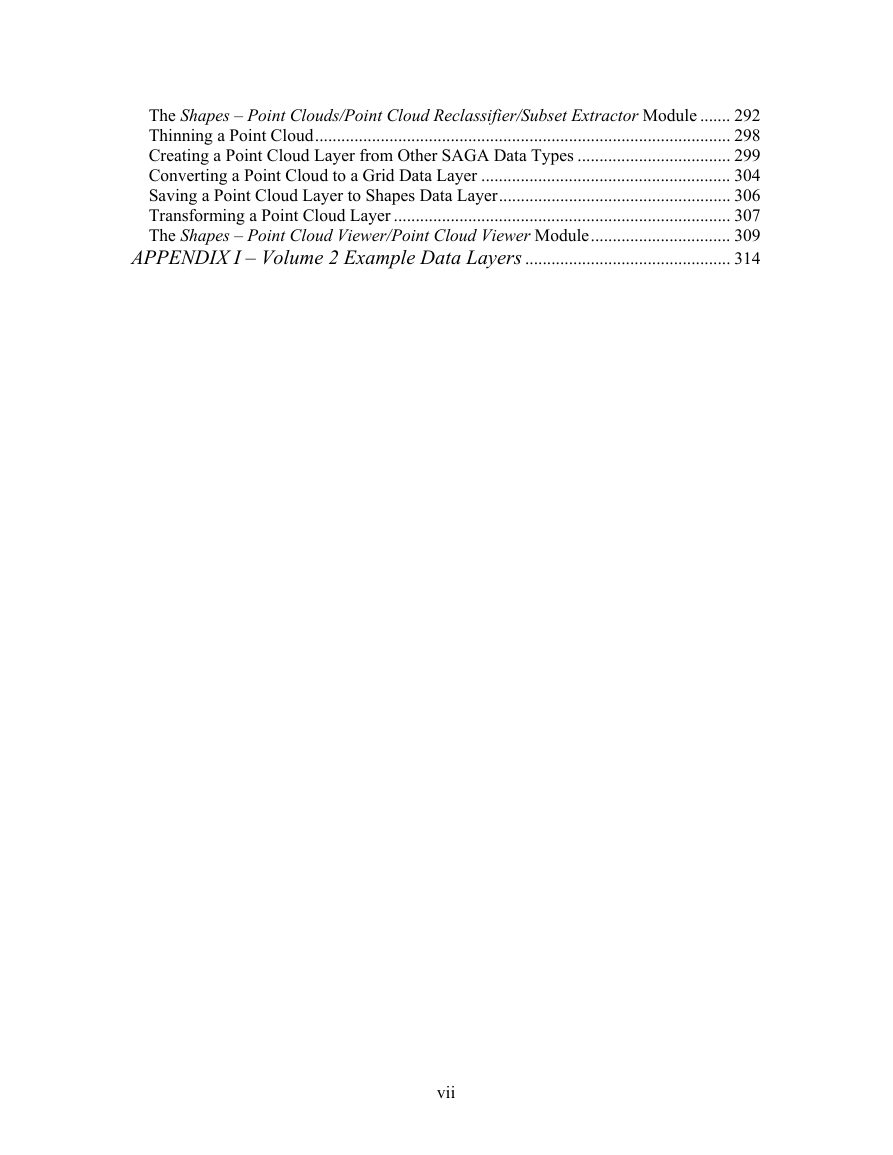
The Shapes – Point Clouds/Point Cloud Reclassifier/Subset Extractor Module ....... 292 Thinning a Point Cloud............................................................................................... 298 Creating a Point Cloud Layer from Other SAGA Data Types ................................... 299 Converting a Point Cloud to a Grid Data Layer ......................................................... 304 Saving a Point Cloud Layer to Shapes Data Layer..................................................... 306 Transforming a Point Cloud Layer ............................................................................. 307 The Shapes – Point Cloud Viewer/Point Cloud Viewer Module................................ 309 APPENDIX I – Volume 2 Example Data Layers ............................................... 314 vii

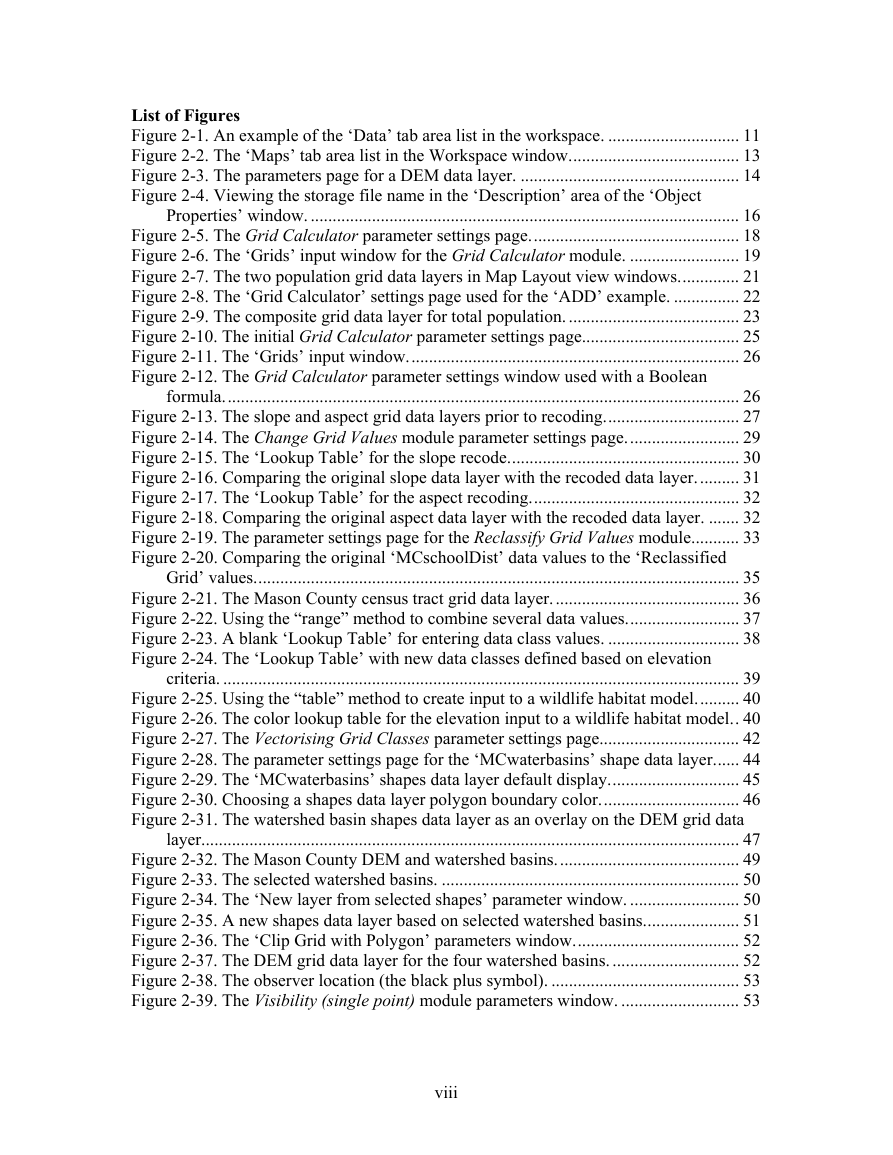
List of Figures Figure 2-1. An example of the ‘Data’ tab area list in the workspace. .............................. 11 Figure 2-2. The ‘Maps’ tab area list in the Workspace window....................................... 13 Figure 2-3. The parameters page for a DEM data layer. .................................................. 14 Figure 2-4. Viewing the storage file name in the ‘Description’ area of the ‘Object Properties’ window. .................................................................................................. 16 Figure 2-5. The Grid Calculator parameter settings page................................................ 18 Figure 2-6. The ‘Grids’ input window for the Grid Calculator module. ......................... 19 Figure 2-7. The two population grid data layers in Map Layout view windows.............. 21 Figure 2-8. The ‘Grid Calculator’ settings page used for the ‘ADD’ example. ............... 22 Figure 2-9. The composite grid data layer for total population. ....................................... 23 Figure 2-10. The initial Grid Calculator parameter settings page.................................... 25 Figure 2-11. The ‘Grids’ input window............................................................................ 26 Figure 2-12. The Grid Calculator parameter settings window used with a Boolean formula...................................................................................................................... 26 Figure 2-13. The slope and aspect grid data layers prior to recoding............................... 27 Figure 2-14. The Change Grid Values module parameter settings page.......................... 29 Figure 2-15. The ‘Lookup Table’ for the slope recode..................................................... 30 Figure 2-16. Comparing the original slope data layer with the recoded data layer.......... 31 Figure 2-17. The ‘Lookup Table’ for the aspect recoding................................................ 32 Figure 2-18. Comparing the original aspect data layer with the recoded data layer. ....... 32 Figure 2-19. The parameter settings page for the Reclassify Grid Values module........... 33 Figure 2-20. Comparing the original ‘MCschoolDist’ data values to the ‘Reclassified Grid’ values............................................................................................................... 35 Figure 2-21. The Mason County census tract grid data layer........................................... 36 Figure 2-22. Using the “range” method to combine several data values.......................... 37 Figure 2-23. A blank ‘Lookup Table’ for entering data class values. .............................. 38 Figure 2-24. The ‘Lookup Table’ with new data classes defined based on elevation criteria. ...................................................................................................................... 39 Figure 2-25. Using the “table” method to create input to a wildlife habitat model.......... 40 Figure 2-26. The color lookup table for the elevation input to a wildlife habitat model.. 40 Figure 2-27. The Vectorising Grid Classes parameter settings page................................ 42 Figure 2-28. The parameter settings page for the ‘MCwaterbasins’ shape data layer...... 44 Figure 2-29. The ‘MCwaterbasins’ shapes data layer default display.............................. 45 Figure 2-30. Choosing a shapes data layer polygon boundary color................................ 46 Figure 2-31. The watershed basin shapes data layer as an overlay on the DEM grid data layer........................................................................................................................... 47 Figure 2-32. The Mason County DEM and watershed basins.......................................... 49 Figure 2-33. The selected watershed basins. .................................................................... 50 Figure 2-34. The ‘New layer from selected shapes’ parameter window. ......................... 50 Figure 2-35. A new shapes data layer based on selected watershed basins...................... 51 Figure 2-36. The ‘Clip Grid with Polygon’ parameters window...................................... 52 Figure 2-37. The DEM grid data layer for the four watershed basins. ............................. 52 Figure 2-38. The observer location (the black plus symbol). ........................................... 53 Figure 2-39. The Visibility (single point) module parameters window. ........................... 53 viii
分享到:
收藏