BV0056-11_TR_Cover2004.qxd 23-03-2004 13:33 Page 1
TECHNICAL REVIEW
Beamforming
1
2
6
2
–
7
0
0
0
N
S
S
I
1
1
–
6
5
0
0
V
B
No.1 2004
HEADQUARTERS: DK-2850 Nærum · Denmark
Telephone: +45 4580 0500 · Fax: +45 4580 14 05
www.bksv.com · info@bksv.com
�
bv005611.book Page i Tuesday, March 23, 2004 12:46 PM
Previously issued numbers of
Brüel & Kjær Technical Review
1 – 2002 A New Design Principle for Triaxial Piezoelectric Accelerometers
Use of FE Models in the Optimisation of Accelerometer Designs
System for Measurement of Microphone Distortion and Linearity from
Medium to Very High Levels
1 – 2001 The Influence of Environmental Conditions on the Pressure Sensitivity of
Measurement Microphones
Reduction of Heat Conduction Error in Microphone Pressure Reciprocity
Calibration
Frequency Response for Measurement Microphones – a Question of
Confidence
Measurement of Microphone Random-incidence and Pressure-field
Responses and Determination of their Uncertainties
1 – 2000 Non-stationary STSF
1 – 1999 Characteristics of the Vold-Kalman Order Tracking Filter
1 – 1998 Danish Primary Laboratory of Acoustics (DPLA) as Part of the National
Metrology Organisation
Pressure Reciprocity Calibration – Instrumentation, Results and Uncertainty
MP.EXE, a Calculation Program for Pressure Reciprocity Calibration of
Microphones
1 – 1997 A New Design Principle for Triaxial Piezoelectric Accelerometers
A Simple QC Test for Knock Sensors
Torsional Operational Deflection Shapes (TODS) Measurements
2 – 1996 Non-stationary Signal Analysis using Wavelet Transform, Short-time
Fourier Transform and Wigner-Ville Distribution
1 – 1996 Calibration Uncertainties & Distortion of Microphones.
Wide Band Intensity Probe. Accelerometer Mounted Resonance Test
2 – 1995 Order Tracking Analysis
1 – 1995 Use of Spatial Transformation of Sound Fields (STSF) Techniques in the
Automative Industry
2 – 1994 The use of Impulse Response Function for Modal Parameter Estimation
Complex Modulus and Damping Measurements using Resonant and Non-
resonant Methods (Damping Part II)
1 – 1994 Digital Filter Techniques vs. FFT Techniques for Damping Measurements
2 – 1990 Optical Filters and their Use with the Type 1302 & Type 1306
1 – 1990 The Brüel & Kjær Photoacoustic Transducer System and its Physical
2 – 1989 STSF — Practical Instrumentation and Application
Digital Filter Analysis: Real-time and Non Real-time Performance
1 – 1989 STSF — A Unique Technique for Scan Based Near-Field Acoustic
Holography Without Restrictions on Coherence
(Damping Part I)
Photoacoustic Gas Monitors
Properties
(Continued on cover page 3)
�
bv005611.book Page ii Tuesday, March 23, 2004 12:46 PM
Technical
Review
No. 1 – 2004
�
bv005611.book Page iii Tuesday, March 23, 2004 12:46 PM
Contents
Beamforming .......................................................................................................... 1
J.J. Christensen and J. Hald
Copyright © 2004, Brüel & Kjær Sound & Vibration Measurement A/S
All rights reserved. No part of this publication may be reproduced or distributed in any form, or by any
means, without prior written permission of the publishers. For details, contact: Brüel & Kjær
Sound & Vibration Measurement A/S, DK-2850 Nærum, Denmark.
Editor: Harry K. Zaveri
�
bv005611.book Page 1 Tuesday, March 23, 2004 12:46 PM
Beamforming
by J.J. Christensen and J. Hald
Abstract
This article explains the basic principles of Beamforming, including the main per-
formance parameters Resolution and Sidelobe Level. Special attention is given to
the influence of array design and to cross-spectral beamforming. Different array
designs, including Brüel & Kjær’s newly patented wheel array design, are described
and compared, and the basic principle of Brüel & Kjær’s geometry optimisation
method is outlined. A new, improved version of cross-spectral beamforming used
in Beamforming Software Type 7768 is introduced and its benefits are verified. The
article also provides some guidelines for performing good measurements and
finally, describes a set of measurements representing typical applications.
Résumé
Cet article traite succintement du concept d’imagerie par formation de faisceaux, et
notamment des principaux paramètres essentiels aux performances de l’antenne
que sont la Résolution et le Niveau de lobe latéral. Une attention toute particulière
est portée sur l’influence de la forme de l’antenne et sur la formation de faisceaux
par approche interspectrale. Diverses conceptions d’antennes, dont l’antenne circu-
laire Brüel & Kjær nouvellement brevetée, y sont présentées et comparées; les prin-
cipes fondamentaux de la méthode propriétaire d’optimisation géométrique y sont
soulignés. Une nouvelle version amendée de l’approche interspectrale implémen-
tée dans le Logiciel Beamforming Software Type 7768 est également présentée et
ses avantages sont vérifiés. Cet article inventorie par ailleurs les points contribuant
à la réalisation de mesures de qualité, pour conclure par la description d’une série
de mesures se rapportant à des applications typiques.
Zusammenfassung
Dieser Artikel erläutert die Grundprinzipien des Beamforming einschließlich der
Hauptparameter Auflösung und Nebenmaxima (Sidelobe Level). Besondere Auf-
merksamkeit wird dem Einfluss der Array-Konstruktion und dem Beamforming
nach dem Kreuzspektrum-Verfahren gewidmet. Es werden verschiedene Array-
1
�
bv005611.book Page 2 Tuesday, March 23, 2004 12:46 PM
Konstruktionen beschrieben und verglichen, darunter Brüel & Kjærs patentiertes
Wheel Array. Außerdem wird das Grundprinzip der Geometrieoptimierung von
Brüel & Kjær skizziert. Eine neue verbesserte Version des in der Beamforming
Software Typ 7768 verwendeten Beamforming nach dem Kreuzspektrum-Verfah-
ren wird vorgestellt und dessen Vorteile nachgewiesen. Der Artikel enthält auch
Richtlinien zur Durchführung guter Messungen und beschreibt eine Serie von Mes-
sungen, die typische Anwendungen repräsentieren.
Introduction
Planar Near-field Acoustical Holography (NAH) is an established technique for
efficient and accurate noise source location [1, 2]. NAH can provide high-resolu-
tion source maps on a planar source surface from measurements taken over a regu-
lar rectangular grid of points close to the source. The measurement grid must
capture the major part of the sound radiation into a half space and therefore com-
pletely cover the noise source plus approximately a 45º solid angle. The grid spac-
ing must be less than half a wavelength at the highest frequency of interest. Thus,
the number of measurement points gets very high when the source is much larger
than the wavelength, which always occurs at sufficiently high frequencies. The
same problem arises when for some reason it is not possible to measure close to
the source. Then, because of the required 45º coverage angle, the measurement
area must be very large. In these cases, beamforming is an attractive alternative.
Beamforming is an array-based measurement technique for sound-source loca-
tion from medium to long measurement distances. Basically, the source location is
performed by estimating the amplitudes of plane (or spherical) waves incident
towards the array from a chosen set of directions. The angular resolution is
inversely proportional to the array diameter measured in units of wavelength, so
the array should be much larger than wavelength to get a fine angular resolution. At
low frequencies, this requirement usually cannot be met, so here the resolution will
be poor. Unlike NAH, beamforming does not require the array to be larger than the
sound source. For typical, irregular array designs, the beamforming method does
not allow the measurement distance to be much smaller than the array diameter. On
the other hand, the measurement distance should be kept as small as possible to
achieve the finest possible resolution on the source surface.
An important difference between beamforming and NAH is that beamforming
can use irregular array geometries, for example, random array geometries. The use
of a discrete set of measurement points on a plane can be seen as a spatial sampling
2
�
bv005611.book Page 3 Tuesday, March 23, 2004 12:46 PM
of the sound field. NAH requires a regular, rectangular grid of points in order to
apply a 2D spatial DFT. Outside the near-field region, such a regular grid will sup-
press spatial aliasing effects very well, if the grid spacing is just less than half a
wavelength. When the grid spacing exceeds half a wavelength, spatial aliasing
components quickly get very disturbing. Irregular arrays on the other hand can
potentially provide a much smoother transition: spatial aliasing effects can be kept
at an acceptable level up to a much higher frequency with the same average spatial
sampling density. This indicates why beamforming can measure up to high fre-
quencies with a fairly low number of microphones.
Theory
Delay-And-Sum Beamforming for Infinite Focus Distance
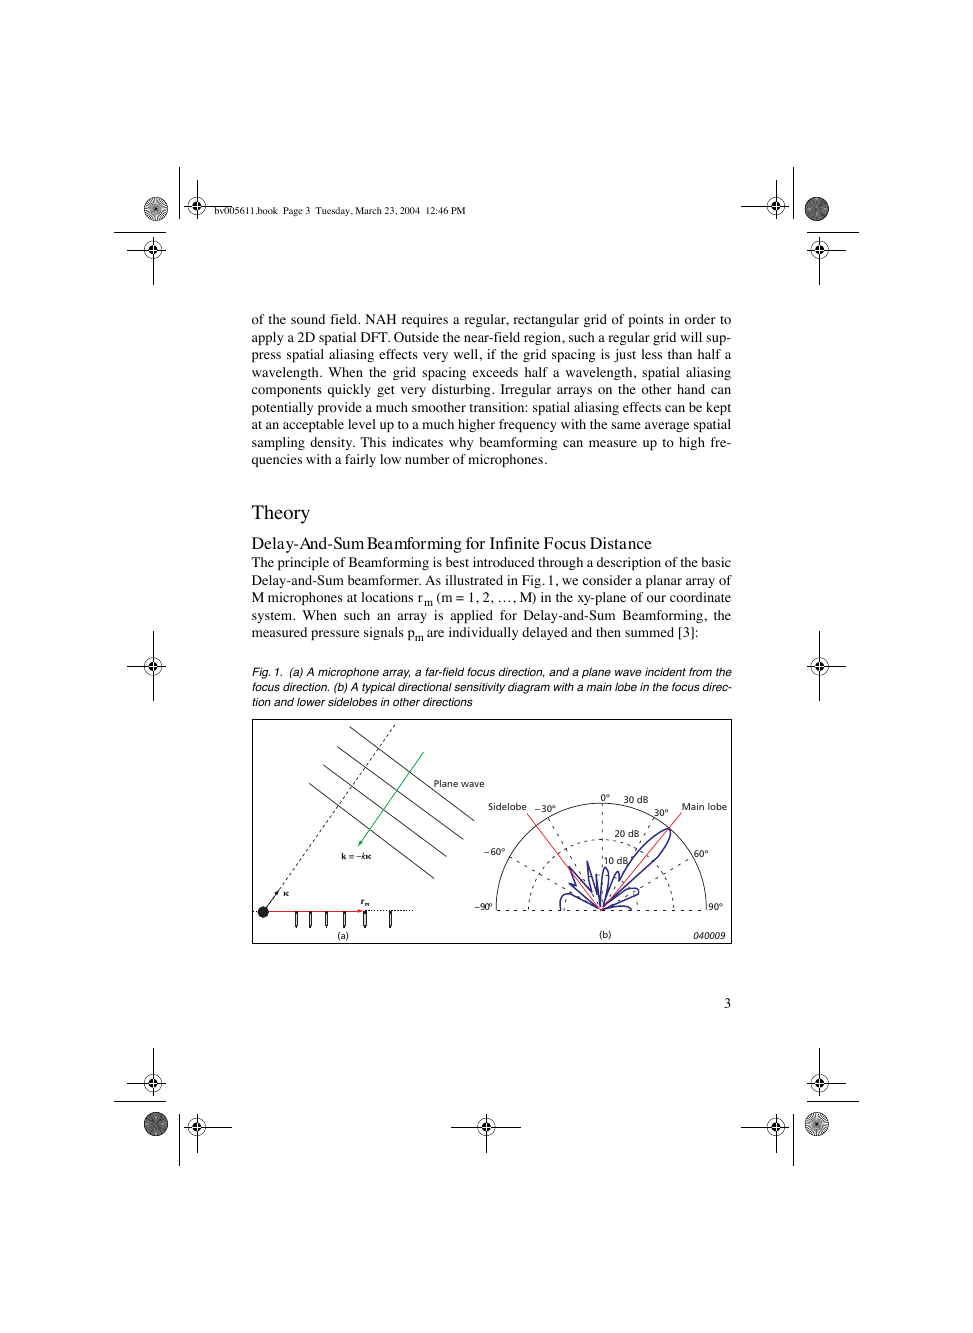
The principle of Beamforming is best introduced through a description of the basic
Delay-and-Sum beamformer. As illustrated in Fig. 1, we consider a planar array of
M microphones at locations rm (m = 1, 2, …, M) in the xy-plane of our coordinate
system. When such an array is applied for Delay-and-Sum Beamforming, the
measured pressure signals pm are individually delayed and then summed [3]:
Fig.1. (a) A microphone array, a far-field focus direction, and a plane wave incident from the
focus direction. (b) A typical directional sensitivity diagram with a main lobe in the focus direc-
tion and lower sidelobes in other directions
Plane wave
Sidelobe
– 30º
0º
30 dB
Main lobe
30º
–
(a)
– 60º
–90º
20 dB
10 dB
(b)
60º
90º
040009
3
�
bv005611.book Page 4 Tuesday, March 23, 2004 12:46 PM
b t,
(
)
=
M∑ pm t ∆m
wm
–(
m 1=
(
)
)
(1)
where wm are a set of weighting or shading coefficients applied to the individual
microphone signals. The individual time delays ∆m are chosen with the aim of
achieving selective directional sensitivity in a specific direction, characterised
here by a unit vector . This objective is met by adjusting the time delays in such a
way that signals associated with a plane wave, incident from the direction , will
be aligned in time before they are summed. Geometrical considerations (Fig. 1)
show that this can be obtained by choosing:
∆m
=
rm⋅
--------------
c
(2)
where c is the propagation speed of sound. Signals arriving from other far-field
directions will not be aligned before the summation, and therefore they will not
add up coherently. Thus, we have obtained a directional sensitivity, as illustrated
in Fig. 1(b).
The frequency domain version of eq. (1) for the Delay-and-Sum beamformer
output is:
B x,
(
)
=
M
∑
m 1=
wmPm x(
)e
–
jx∆m
(
)
=
M
∑
m 1=
wmPm x(
)e
jk rm⋅
(3)
Here, x is the temporal angular frequency, k ≡ –k is the wave number vector of a
plane wave incident from the direction in which the array is focused (see Fig. 1),
and k = x/c is the wave number. In eq. (3) an implicit time factor equal to e jxt is
assumed. Because k ≡ –k, we can write B(k, x) instead of B(, x).
Through our choice of time delays ∆m(), or equivalently of the “preferred”
wave number vector k ≡ –k, we have “tuned” the beamformer on the far-field
direction . Ideally, we would like to measure only signals arriving from that direc-
tion, in order to get a perfect localisation of the sound sources. To investigate, how
much “leakage” we will get from plane waves incident from other directions, we
now assume a plane wave incident with a wave number vector k0 different from the
preferred k ≡ –k, Fig. 2. The pressure measured by the microphones will then be:
Pm x(
)
=
P0e
–
jk0 rm⋅
(4)
which, according to eq. (3), will give the following output from the beamformer:
4
�




 2023年江西萍乡中考道德与法治真题及答案.doc
 2012年重庆南川中考生物真题及答案.doc
 2013年江西师范大学地理学综合及文艺理论基础考研真题.doc
 2020年四川甘孜小升初语文真题及答案I卷.doc
 2020年注册岩土工程师专业基础考试真题及答案.doc
 2023-2024学年福建省厦门市九年级上学期数学月考试题及答案.doc
 2021-2022学年辽宁省沈阳市大东区九年级上学期语文期末试题及答案.doc
 2022-2023学年北京东城区初三第一学期物理期末试卷及答案.doc
 2018上半年江西教师资格初中地理学科知识与教学能力真题及答案.doc
 2012年河北国家公务员申论考试真题及答案-省级.doc
 2020-2021学年江苏省扬州市江都区邵樊片九年级上学期数学第一次质量检测试题及答案.doc
 2022下半年黑龙江教师资格证中学综合素质真题及答案.doc