1
TIBCO Spotfire S+ 介绍
北京宏能畅然数据应用有限公司
2010-01
1
�
2
0.S+简介.............................................................................................................................................. 3
1.数据访问........................................................................................................................................... 3
2.S 编程语言 ...................................................................................................................................... 3
3.图形用户界面................................................................................................................................... 4
4.统计和数据分析技术....................................................................................................................... 4
假设检验和置信区间..................................................................................................................... 5
Shapiro-Wilk检验........................................................................................................................... 5
回归分析......................................................................................................................................... 5
方差分析......................................................................................................................................... 5
非线性回归和最大似然................................................................................................................. 6
非参数回归..................................................................................................................................... 6
决策树模型..................................................................................................................................... 6
相关性数据分析............................................................................................................................. 6
再抽样............................................................................................................................................. 7
多元分析......................................................................................................................................... 7
聚类分析......................................................................................................................................... 7
质量控制......................................................................................................................................... 7
效能和样本大小............................................................................................................................. 7
生存分析......................................................................................................................................... 7
时间序列分析................................................................................................................................. 8
稳健统计......................................................................................................................................... 8
支持向量机(S+8 或更高版本)....................................................................................................... 8
5.缺失值............................................................................................................................................... 9
6.日期、时间和日历数据................................................................................................................... 9
7.数值计算........................................................................................................................................... 9
8.点击制图①....................................................................................................................................... 9
9.可伸缩的管道式架构②................................................................................................................. 10
10.集成开发环境S+ Workbench....................................................................................................... 10
11.可集成性....................................................................................................................................... 11
12.附加LIBRARIES.......................................................................................................................... 11
13.支持的平台................................................................................................................................... 11
14.系统配置要求............................................................................................................................... 11
2
�
3
0.S+简介
TIBCO 公司的 Spotfire 系列产品 S+自 1987 年来在各行各业广泛使用。她曾获
得著名的“美国计算机协会优秀软件奖”,而其它获此殊荣的是大名鼎鼎的 TCP/IP,
UNIX 与网上浏览器的创始者 MOSAIC 等。S+(原名 S-PLUS)具有开放的平台、
最完备的分析工具库与多样化的价格设计,非常适合中国用户。可惜由于该软件的
初始创始国的出口限制,导致她直到 2002 年才正式许可进入中国大陆市场。
S+主要是针对金融、生物医药、制造、环境、教育科研等行业设计开发的。
1.数据访问
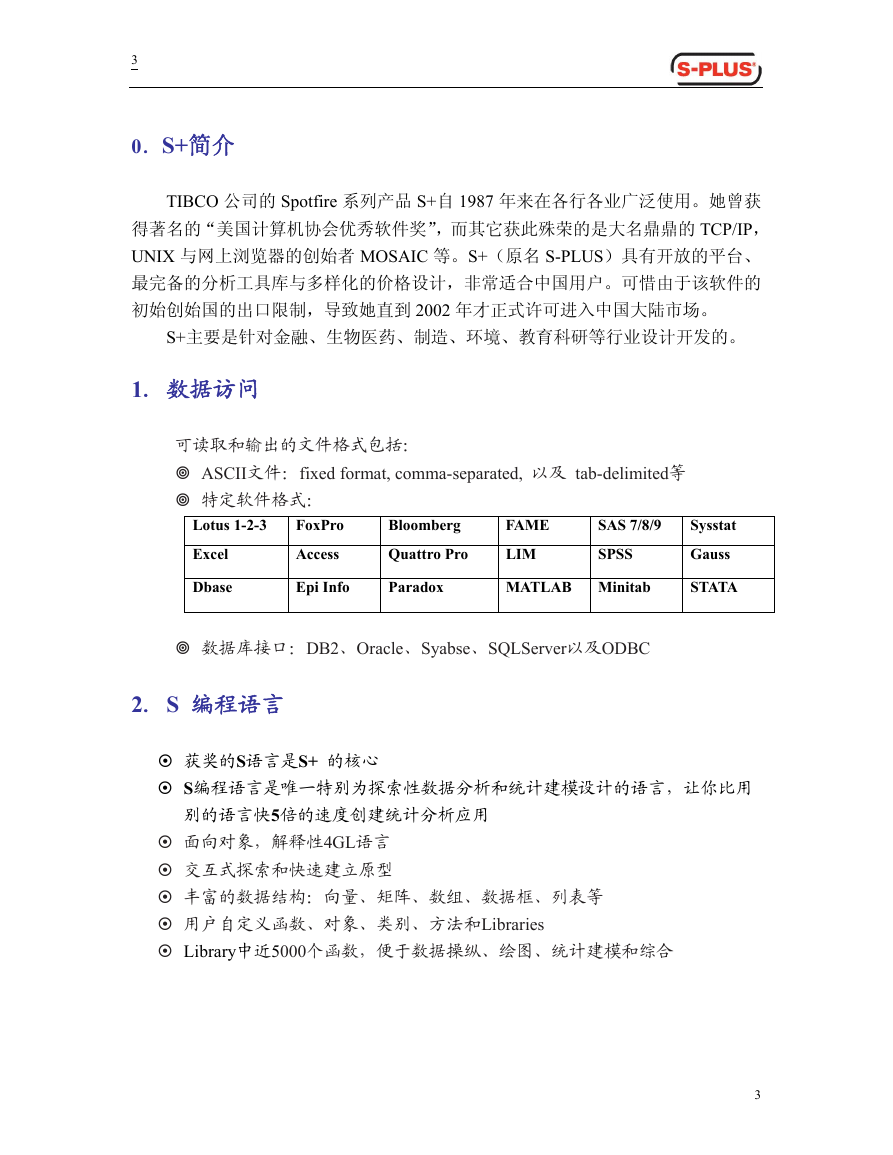
可读取和输出的文件格式包括:
ASCII文件:fixed format, comma-separated, 以及 tab-delimited等
特定软件格式:
Lotus 1-2-3
Excel
Dbase
FoxPro
Access
Epi Info
Bloomberg
Quattro Pro
Paradox
SAS 7/8/9
SPSS
FAME
LIM
MATLAB Minitab
Sysstat
Gauss
STATA
数据库接口:DB2、Oracle、Syabse、SQLServer以及ODBC
2.S 编程语言
获奖的S语言是S+ 的核心
S编程语言是唯一特别为探索性数据分析和统计建模设计的语言,让你比用
别的语言快5倍的速度创建统计分析应用
面向对象,解释性4GL语言
交互式探索和快速建立原型
丰富的数据结构:向量、矩阵、数组、数据框、列表等
用户自定义函数、对象、类别、方法和Libraries
Library中近5000个函数,便于数据操纵、绘图、统计建模和综合
3
�
4
3.图形用户界面
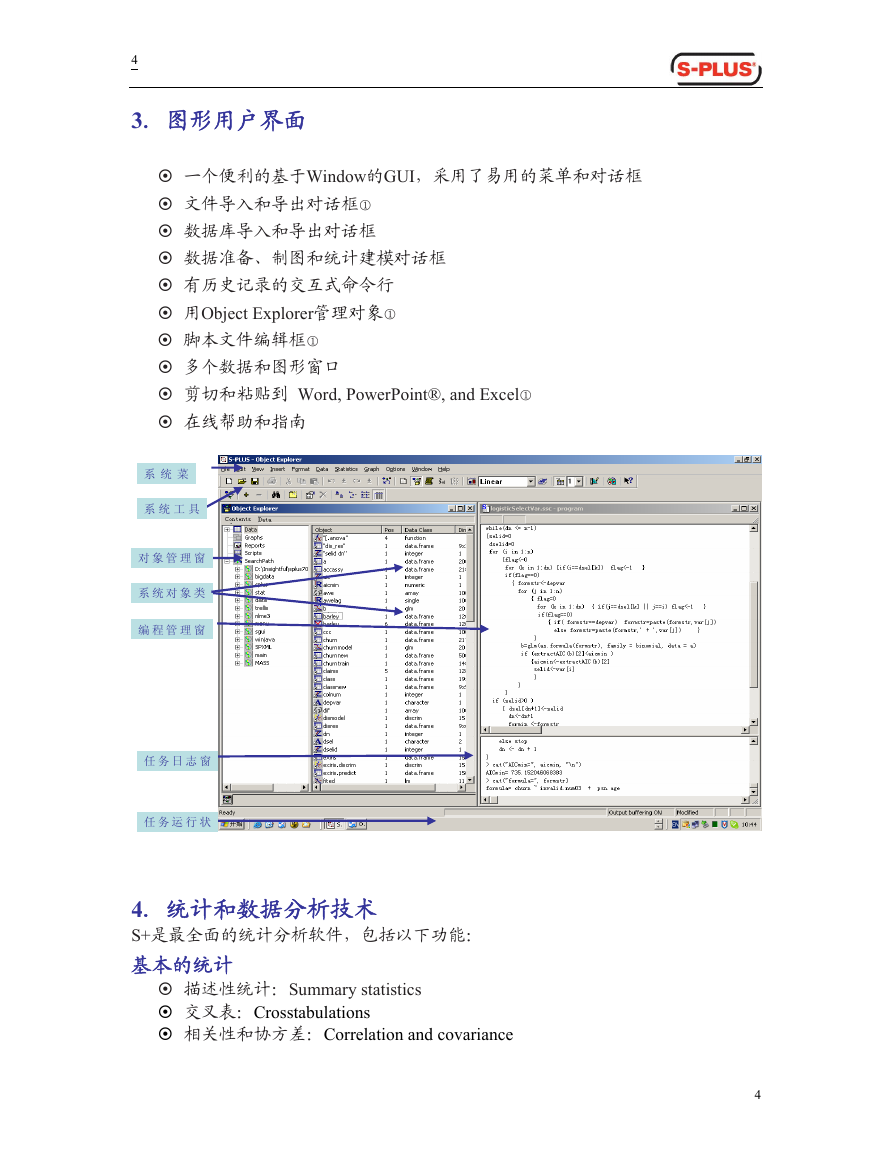
一个便利的基于Window的GUI,采用了易用的菜单和对话框
文件导入和导出对话框①
数据库导入和导出对话框
数据准备、制图和统计建模对话框
有历史记录的交互式命令行
用Object Explorer管理对象①
脚本文件编辑框①
多个数据和图形窗口
剪切和粘贴到 Word, PowerPoint®, and Excel①
在线帮助和指南
系 统 菜
系 统 工 具
对 象 管 理 窗
系 统 对 象 类
编 程 管 理 窗
任 务 日 志 窗
任 务 运 行 状
4.统计和数据分析技术
S+是最全面的统计分析软件,包括以下功能:
基本的统计
描述性统计:Summary statistics
交叉表:Crosstabulations
相关性和协方差:Correlation and covariance
4
�
5
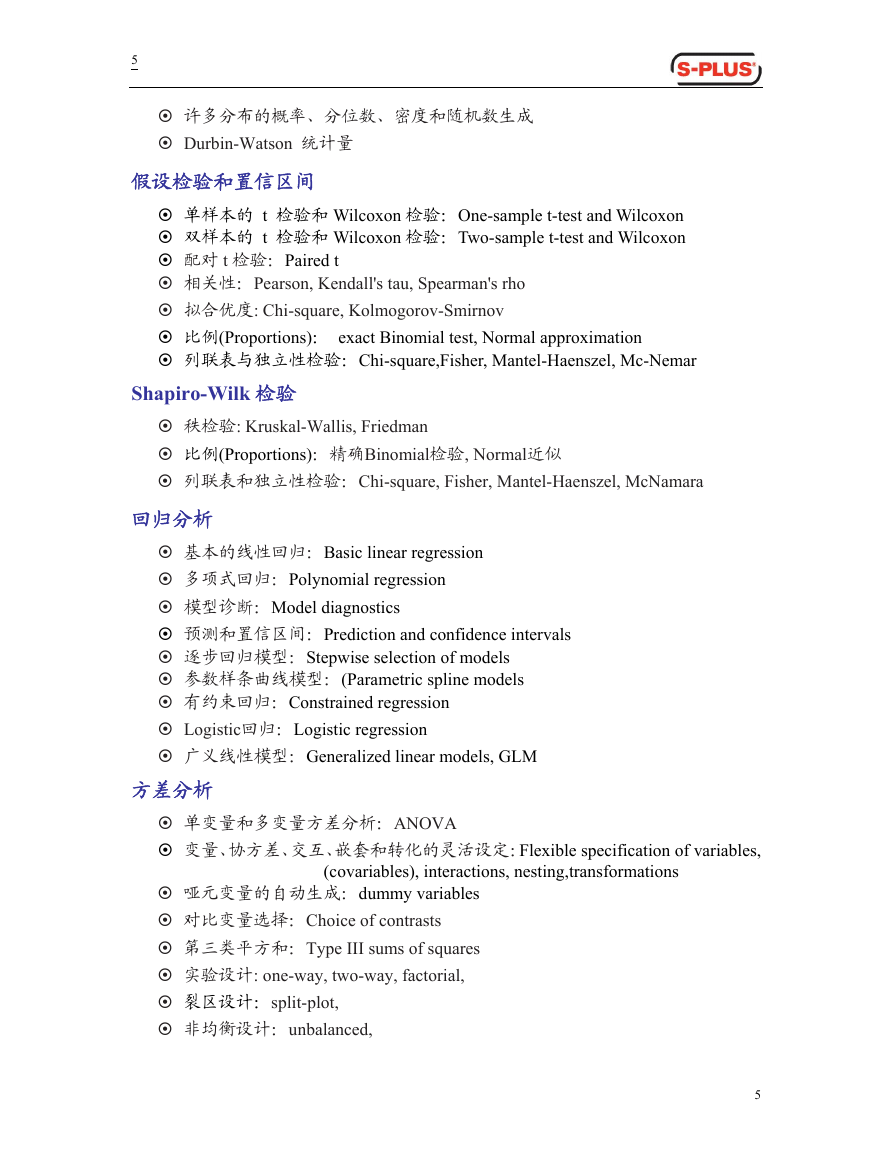
许多分布的概率、分位数、密度和随机数生成
Durbin-Watson 统计量
假设检验和置信区间
单样本的 t 检验和 Wilcoxon 检验:One-sample t-test and Wilcoxon
双样本的 t 检验和 Wilcoxon 检验:Two-sample t-test and Wilcoxon
配对 t 检验:Paired t
相关性:Pearson, Kendall's tau, Spearman's rho
拟合优度: Chi-square, Kolmogorov-Smirnov
比例(Proportions): exact Binomial test, Normal approximation
列联表与独立性检验:Chi-square,Fisher, Mantel-Haenszel, Mc-Nemar
Shapiro-Wilk 检验
秩检验: Kruskal-Wallis, Friedman
比例(Proportions):精确Binomial检验, Normal近似
列联表和独立性检验:Chi-square, Fisher, Mantel-Haenszel, McNamara
回归分析
基本的线性回归:Basic linear regression
多项式回归:Polynomial regression
模型诊断:Model diagnostics
预测和置信区间:Prediction and confidence intervals
逐步回归模型:Stepwise selection of models
参数样条曲线模型:(Parametric spline models
有约束回归:Constrained regression
Logistic回归:Logistic regression
广义线性模型:Generalized linear models, GLM
方差分析
单变量和多变量方差分析:ANOVA
变量、协方差、交互、嵌套和转化的灵活设定:Flexible specification of variables,
(covariables), interactions, nesting,transformations
哑元变量的自动生成:dummy variables
对比变量选择:Choice of contrasts
第三类平方和:Type III sums of squares
实验设计: one-way, two-way, factorial,
裂区设计:split-plot,
非均衡设计:unbalanced,
5
�
6
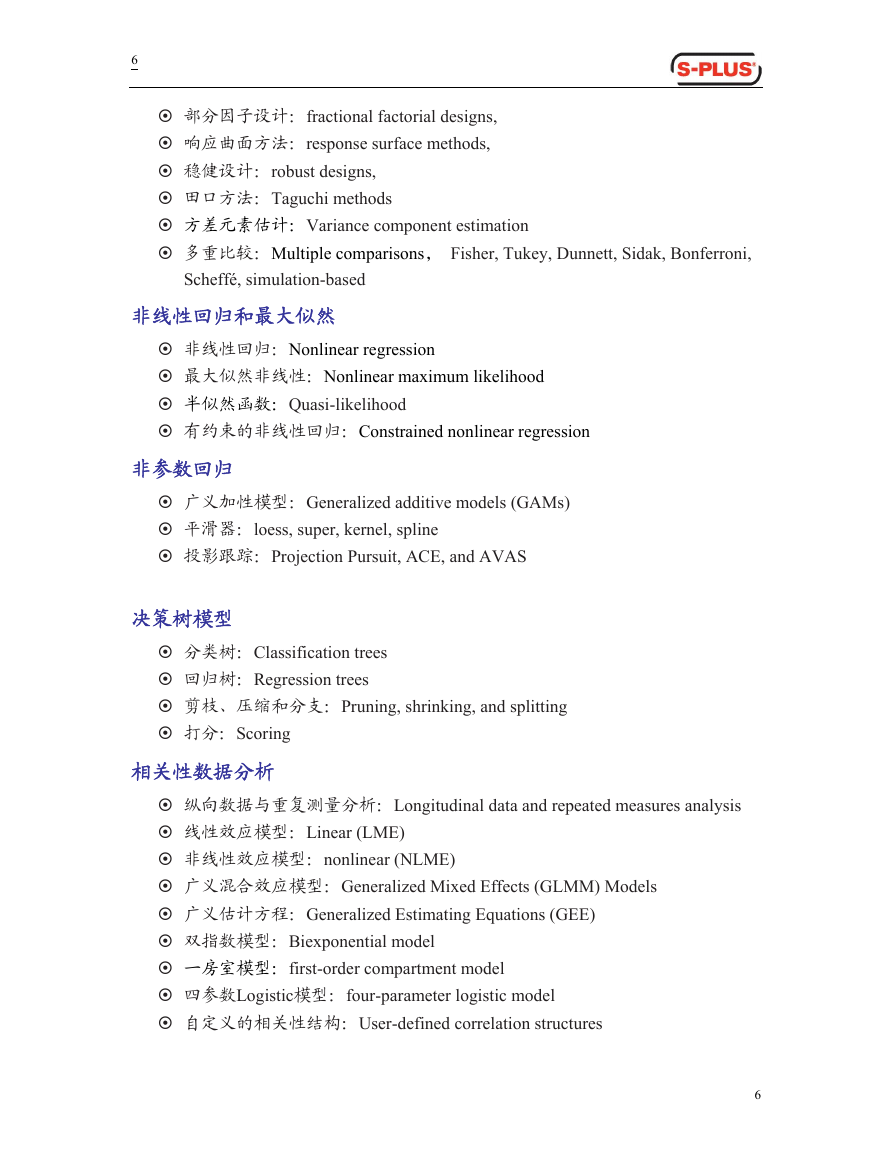
部分因子设计:fractional factorial designs,
响应曲面方法:response surface methods,
稳健设计:robust designs,
田口方法:Taguchi methods
方差元素估计:Variance component estimation
多重比较:Multiple comparisons, Fisher, Tukey, Dunnett, Sidak, Bonferroni,
Scheffé, simulation-based
非线性回归和最大似然
非线性回归:Nonlinear regression
最大似然非线性:Nonlinear maximum likelihood
半似然函数:Quasi-likelihood
有约束的非线性回归:Constrained nonlinear regression
非参数回归
广义加性模型:Generalized additive models (GAMs)
平滑器:loess, super, kernel, spline
投影跟踪:Projection Pursuit, ACE, and AVAS
决策树模型
分类树:Classification trees
回归树:Regression trees
剪枝、压缩和分支:Pruning, shrinking, and splitting
打分:Scoring
相关性数据分析
纵向数据与重复测量分析:Longitudinal data and repeated measures analysis
线性效应模型:Linear (LME)
非线性效应模型:nonlinear (NLME)
广义混合效应模型:Generalized Mixed Effects (GLMM) Models
广义估计方程:Generalized Estimating Equations (GEE)
双指数模型:Biexponential model
一房室模型:first-order compartment model
四参数Logistic模型:four-parameter logistic model
自定义的相关性结构:User-defined correlation structures
6
�
7
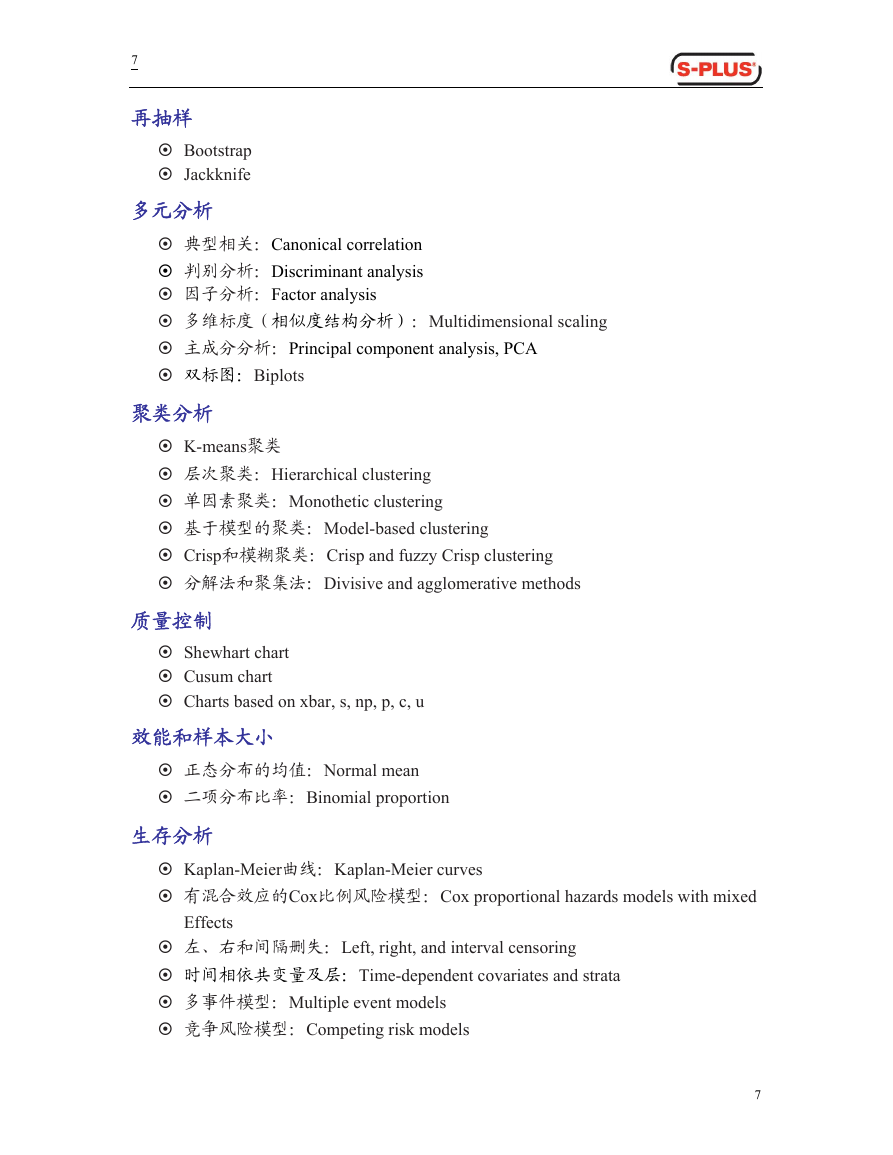
再抽样
Bootstrap
Jackknife
多元分析
典型相关:Canonical correlation
判别分析:Discriminant analysis
因子分析:Factor analysis
多维标度(相似度结构分析):Multidimensional scaling
主成分分析:Principal component analysis, PCA
双标图:Biplots
聚类分析
K-means聚类
层次聚类:Hierarchical clustering
单因素聚类:Monothetic clustering
基于模型的聚类:Model-based clustering
Crisp和模糊聚类:Crisp and fuzzy Crisp clustering
分解法和聚集法:Divisive and agglomerative methods
质量控制
Shewhart chart
Cusum chart
Charts based on xbar, s, np, p, c, u
效能和样本大小
正态分布的均值:Normal mean
二项分布比率:Binomial proportion
生存分析
Kaplan-Meier曲线:Kaplan-Meier curves
有混合效应的Cox比例风险模型:Cox proportional hazards models with mixed
Effects
左、右和间隔删失:Left, right, and interval censoring
时间相依共变量及层:Time-dependent covariates and strata
多事件模型:Multiple event models
竞争风险模型:Competing risk models
7
�
8
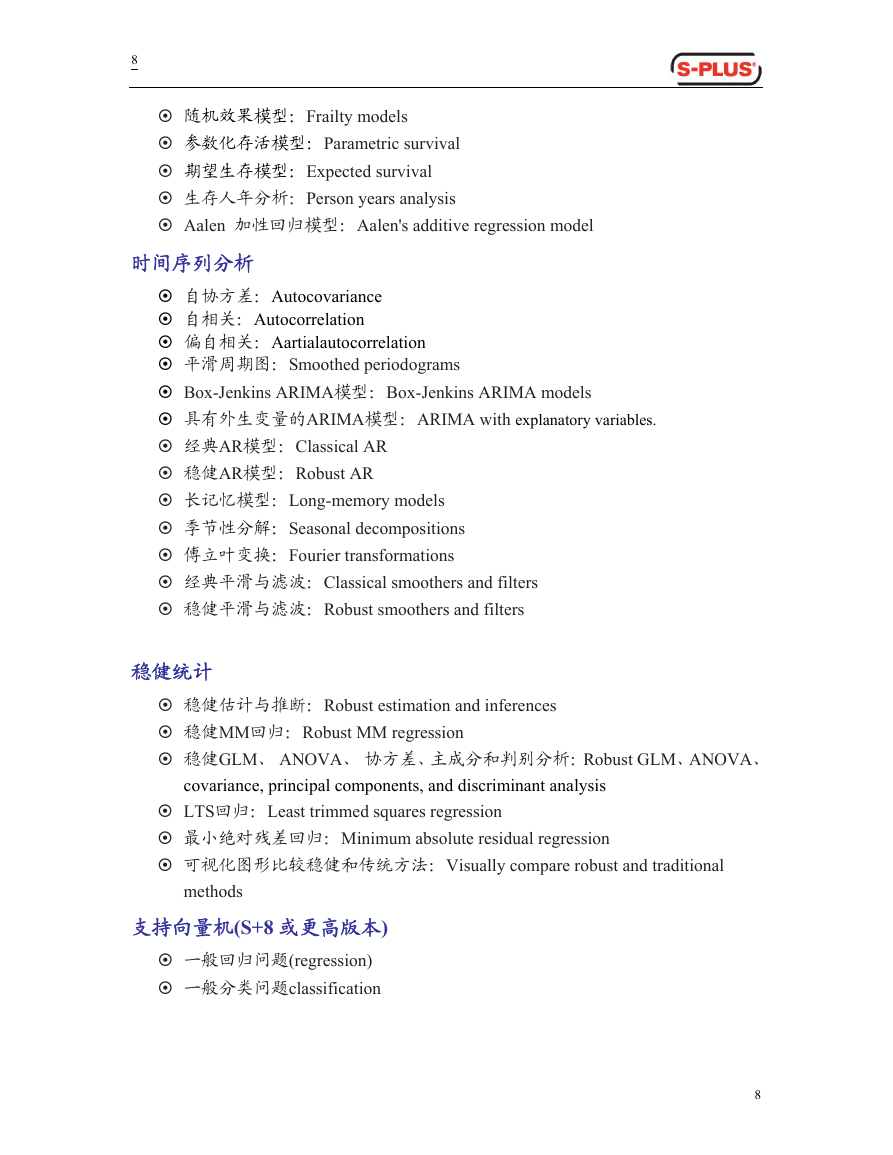
随机效果模型:Frailty models
参数化存活模型:Parametric survival
期望生存模型:Expected survival
生存人年分析:Person years analysis
Aalen 加性回归模型:Aalen's additive regression model
时间序列分析
自协方差:Autocovariance
自相关:Autocorrelation
偏自相关:Aartialautocorrelation
平滑周期图:Smoothed periodograms
Box-Jenkins ARIMA模型:Box-Jenkins ARIMA models
具有外生变量的ARIMA模型:ARIMA with explanatory variables.
经典AR模型:Classical AR
稳健AR模型:Robust AR
长记忆模型:Long-memory models
季节性分解:Seasonal decompositions
傅立叶变换:Fourier transformations
经典平滑与滤波:Classical smoothers and filters
稳健平滑与滤波:Robust smoothers and filters
稳健统计
稳健估计与推断:Robust estimation and inferences
稳健MM回归:Robust MM regression
稳健GLM、 ANOVA、 协方差、主成分和判别分析:Robust GLM、ANOVA、
covariance, principal components, and discriminant analysis
LTS回归:Least trimmed squares regression
最小绝对残差回归:Minimum absolute residual regression
可视化图形比较稳健和传统方法:Visually compare robust and traditional
methods
支持向量机(S+8 或更高版本)
一般回归问题(regression)
一般分类问题classification
8
�


 2023年江西萍乡中考道德与法治真题及答案.doc
 2012年重庆南川中考生物真题及答案.doc
 2013年江西师范大学地理学综合及文艺理论基础考研真题.doc
 2020年四川甘孜小升初语文真题及答案I卷.doc
 2020年注册岩土工程师专业基础考试真题及答案.doc
 2023-2024学年福建省厦门市九年级上学期数学月考试题及答案.doc
 2021-2022学年辽宁省沈阳市大东区九年级上学期语文期末试题及答案.doc
 2022-2023学年北京东城区初三第一学期物理期末试卷及答案.doc
 2018上半年江西教师资格初中地理学科知识与教学能力真题及答案.doc
 2012年河北国家公务员申论考试真题及答案-省级.doc
 2020-2021学年江苏省扬州市江都区邵樊片九年级上学期数学第一次质量检测试题及答案.doc
 2022下半年黑龙江教师资格证中学综合素质真题及答案.doc