tdsa (MX-Scan)
tdsa
Associated Symbols:
tdsa
License Requirements: MODEL_SYNTHESIS
Part Category:
Related Topics:
Analog Model Synthesis Templates
Analog Model Synthesis Overview
Functional Description
The tdsa template uses sine wave stimulus techniques to obtain
phase and gain information for a large-signal circuit. You connect
the output as a source for the design under test, and the input to
the output of the design. When you run a transient analysis, tdsa
simulates the design, measures its output, and calculates phase
and gain information, which it stores in a plot file. It also offers
an optional bandpass input filter, and includes a source for a
standard AC analysis.
Template Description Sections
Connection Points
Symbol Properties
Post-Processing Information
Model Description
Usage Notes
Example
Generic Template Library
Copyright © 1992-2007 Synopsys Inc.
1
�
tdsa Connection Points
Name
outp
outm
inp
inm
Type
electrical
Description
positive output of sinusoidal source
electrical
negative output of sinusoidal source
electrical
positive input for measurements
electrical
negative input for measurements
enbl
logic_4
enable input for frequency sweep
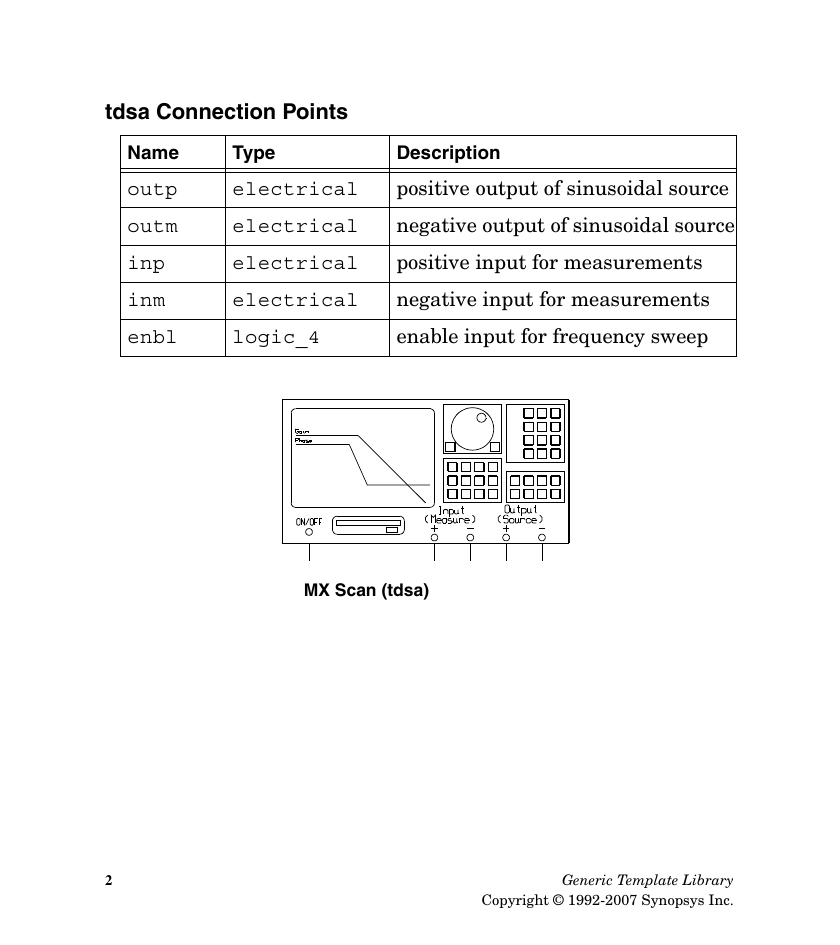
MX Scan (tdsa)
2
Generic Template Library
Copyright © 1992-2007 Synopsys Inc.
�
tdsa Symbol Properties
tdsa
Property
primitive Description: This symbol calls the template
tdsa. The template will create an
AC or complex plot file for the
circuit under test during a
transient analysis. This is not
meant to replace the standard AC
analysis, but to allow AC results
to be obtained for circuits that
will not work with the standard
AC analysis. An example is
switching circuits.
WARNING! Since a template and
not the simulator creates the plot
file, analyses with looping (such
as vary and mc) will not function
as expected. Only the AC data
obtained from the last loop will be
in the plot file created by the tdsa
template.
ref
Description: Suffix appended to a template
name that uniquely identifies a
part in a schematic.
Default:
Example
Input:
If not specified will be assigned
by Schematic Capture Tool
Can be any alpha-numeric string
Generic Template Library
Copyright © 1992-2007 Synopsys Inc.
3
�
Property
fbegin
Description: Starting frequency value for the
frequency sweep. A value is
required and it must be > 0.
Default
(units):
Example
Input:
value required
(Hz)
100
fend
Description: Ending frequency value for the
frequency sweep. A value is
required and it must be > 0.
Default
(units):
Example
Input:
value required
(Hz)
10k
pfile
Description: Name of the plot file created by
Default
(units):
Example
Input:
tdsa template. File identifier
(suffix) identifying AC plot file
showing the frequency response
determined by tdsa.
ac_tdsa
Can be any alpha-numeric string
in quotes. ac_1 Plot file
generated: design.ac_1
Generic Template Library
Copyright © 1992-2007 Synopsys Inc.
4
�
tdsa
Property
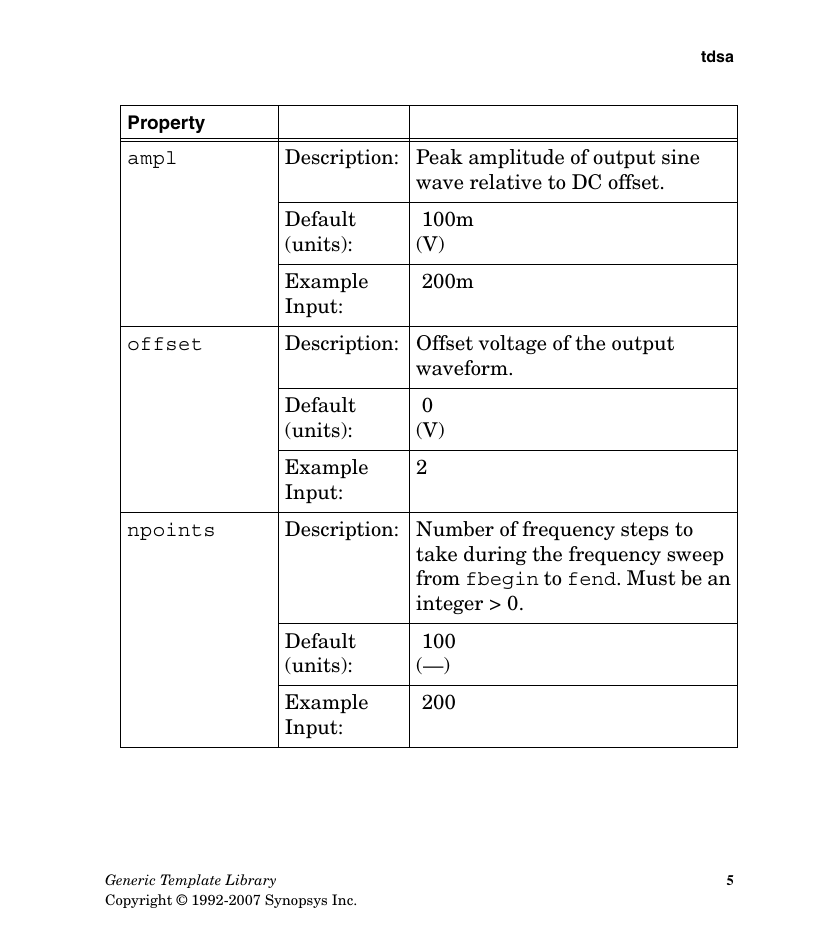
ampl
Description: Peak amplitude of output sine
wave relative to DC offset.
Default
(units):
Example
Input:
100m
(V)
200m
offset
Description: Offset voltage of the output
waveform.
Default
(units):
Example
Input:
0
(V)
2
npoints
Description: Number of frequency steps to
take during the frequency sweep
from fbegin to fend. Must be an
integer > 0.
Default
(units):
Example
Input:
100
(—)
200
Generic Template Library
Copyright © 1992-2007 Synopsys Inc.
5
�
Property
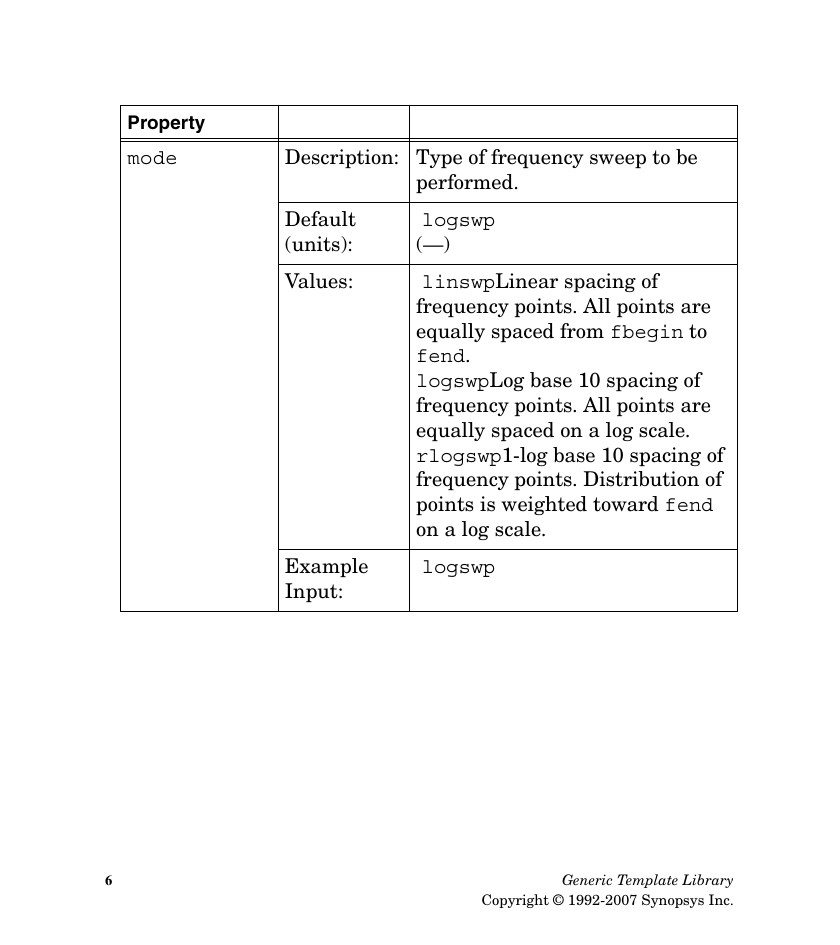
mode
Description: Type of frequency sweep to be
Default
(units):
Values:
performed.
logswp
(—)
linswpLinear spacing of
frequency points. All points are
equally spaced from fbegin to
fend.
logswpLog base 10 spacing of
frequency points. All points are
equally spaced on a log scale.
rlogswp1-log base 10 spacing of
frequency points. Distribution of
points is weighted toward fend
on a log scale.
Example
Input:
logswp
6
Generic Template Library
Copyright © 1992-2007 Synopsys Inc.
�
Property
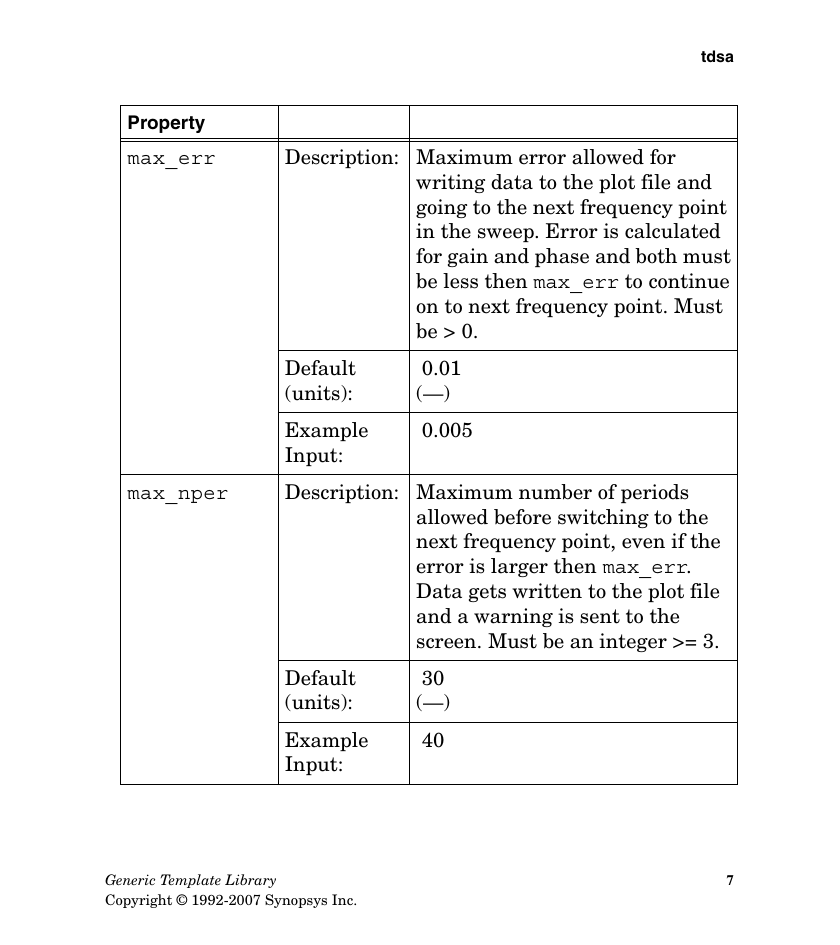
max_err
Description: Maximum error allowed for
tdsa
writing data to the plot file and
going to the next frequency point
in the sweep. Error is calculated
for gain and phase and both must
be less then max_err to continue
on to next frequency point. Must
be > 0.
Default
(units):
Example
Input:
0.01
(—)
0.005
max_nper
Description: Maximum number of periods
allowed before switching to the
next frequency point, even if the
error is larger then max_err.
Data gets written to the plot file
and a warning is sent to the
screen. Must be an integer >= 3.
Default
(units):
Example
Input:
30
(—)
40
Generic Template Library
Copyright © 1992-2007 Synopsys Inc.
7
�
Property
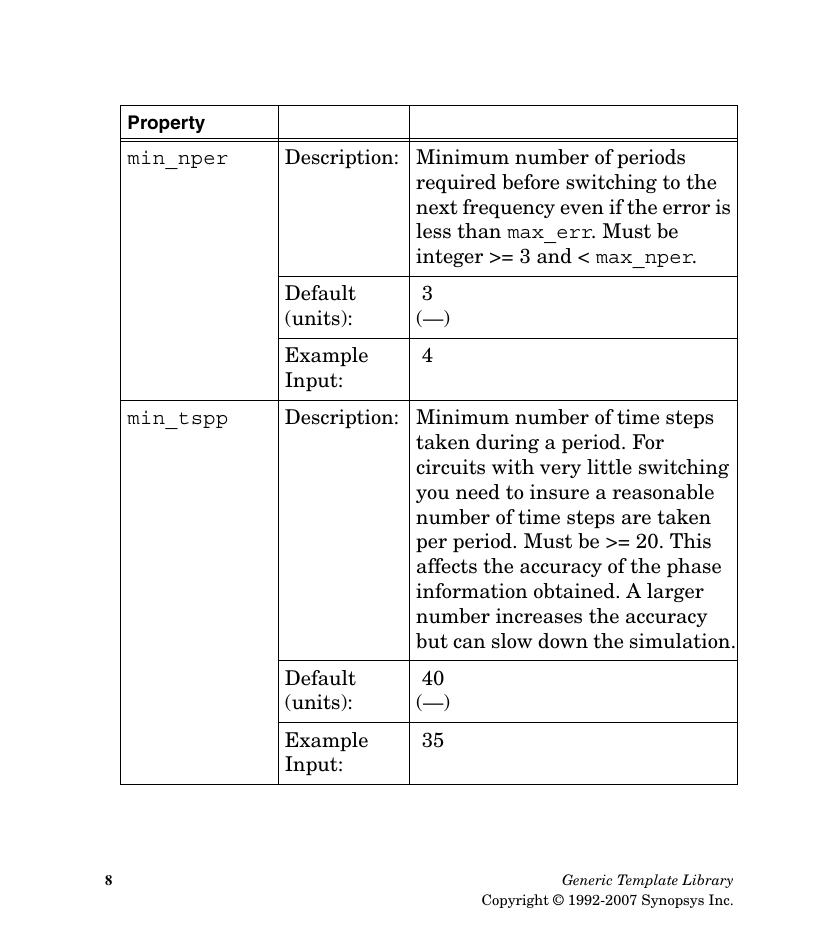
min_nper
Description: Minimum number of periods
required before switching to the
next frequency even if the error is
less than max_err. Must be
integer >= 3 and < max_nper.
Default
(units):
Example
Input:
3
(—)
4
min_tspp
Description: Minimum number of time steps
taken during a period. For
circuits with very little switching
you need to insure a reasonable
number of time steps are taken
per period. Must be >= 20. This
affects the accuracy of the phase
information obtained. A larger
number increases the accuracy
but can slow down the simulation.
Default
(units):
Example
Input:
40
(—)
35
8
Generic Template Library
Copyright © 1992-2007 Synopsys Inc.
�


 2023年江西萍乡中考道德与法治真题及答案.doc
 2012年重庆南川中考生物真题及答案.doc
 2013年江西师范大学地理学综合及文艺理论基础考研真题.doc
 2020年四川甘孜小升初语文真题及答案I卷.doc
 2020年注册岩土工程师专业基础考试真题及答案.doc
 2023-2024学年福建省厦门市九年级上学期数学月考试题及答案.doc
 2021-2022学年辽宁省沈阳市大东区九年级上学期语文期末试题及答案.doc
 2022-2023学年北京东城区初三第一学期物理期末试卷及答案.doc
 2018上半年江西教师资格初中地理学科知识与教学能力真题及答案.doc
 2012年河北国家公务员申论考试真题及答案-省级.doc
 2020-2021学年江苏省扬州市江都区邵樊片九年级上学期数学第一次质量检测试题及答案.doc
 2022下半年黑龙江教师资格证中学综合素质真题及答案.doc