Highway Capacity Manual 2000
Background and underlying
concepts for this chapter are
in Chapter 10
A lane group is indicated in
formulas by the subscript i
See Chapter 10 for
description of quick estimation
method
I.
INTRODUCTION
SCOPE OF THE METHODOLOGY
This chapter contains a methodology for analyzing the capacity and level of service
(LOS) of signalized intersections. The analysis must consider a wide variety of
prevailing conditions, including the amount and distribution of traffic movements, traffic
composition, geometric characteristics, and details of intersection signalization. The
methodology focuses on the determination of LOS for known or projected conditions.
The methodology addresses the capacity, LOS, and other performance measures for
lane groups and intersection approaches and the LOS for the intersection as a whole.
Capacity is evaluated in terms of the ratio of demand flow rate to capacity (v/c ratio),
whereas LOS is evaluated on the basis of control delay per vehicle (in seconds per
vehicle). Control delay is the portion of the total delay attributed to traffic signal
operation for signalized intersections. Control delay includes initial deceleration delay,
queue move-up time, stopped delay, and final acceleration delay. Appendix A presents a
method for observing intersection control delay in the field. Exhibit 10-9 provides
definitions of the basic terms used in this chapter.
Each lane group is analyzed separately. Equations in this chapter use the subscript i
to indicate each lane group. The capacity of the intersection as a whole is not addressed
because both the design and the signalization of intersections focus on the
accommodation of traffic movement on approaches to the intersection.
The capacity analysis methodology for signalized intersections is based on known or
projected signalization plans. Two procedures are available to assist the analyst in
establishing signalization plans. The first is the quick estimation method, which produces
estimates of the cycle length and green times that can be considered to constitute a
reasonable and effective signal timing plan. The quick estimation method requires
minimal field data and relies instead on default values for the required traffic and control
parameters. It is described and documented in Chapter 10.
A more detailed procedure is provided in Appendix B of this chapter for estimating
the timing plan at both pretimed and traffic-actuated signals. The procedure for pretimed
signals provides the basis for the design of signal timing plans that equalize the degree of
saturation on the critical approaches for each phase of the signal sequence. This
procedure does not, however, provide for optimal operation.
The methodology in this chapter is based in part on the results of a National
Cooperative Highway Research Program (NCHRP) study (1, 2). Critical movement
capacity analysis techniques have been developed in the United States (3–5), Australia
(6), Great Britain (7), and Sweden (8). Background for delay estimation procedures was
developed in Great Britain (7), Australia (9, 10), and the United States (11). Updates to
the original methodology were developed subsequently (12–24).
LIMITATIONS TO THE METHODOLOGY
The methodology does not take into account the potential impact of downstream
congestion on intersection operation. Nor does the methodology detect and adjust for the
impacts of turn-pocket overflows on through traffic and intersection operation.
II. METHODOLOGY
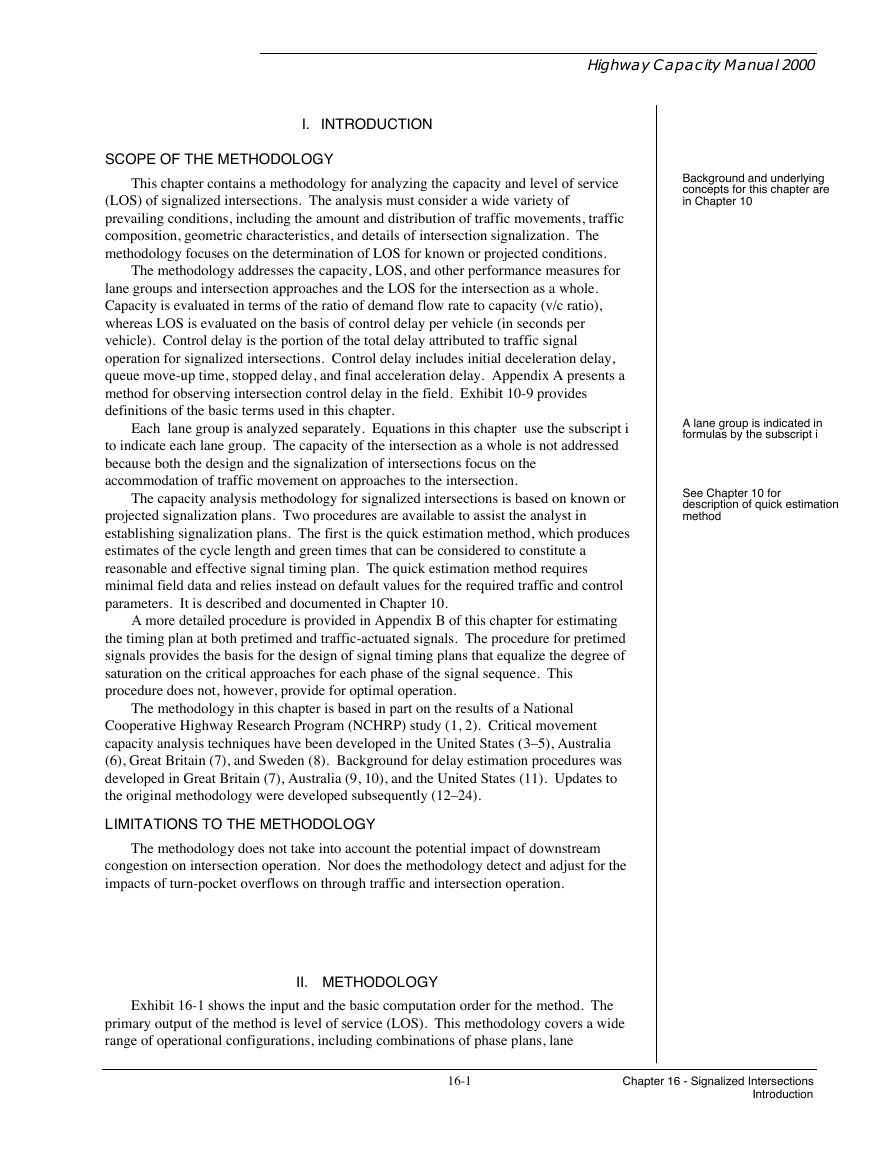
Exhibit 16-1 shows the input and the basic computation order for the method. The
primary output of the method is level of service (LOS). This methodology covers a wide
range of operational configurations, including combinations of phase plans, lane
16-1
Chapter 16 - Signalized Intersections
Introduction
�
Highway Capacity Manual 2000
utilization, and left-turn treatment alternatives. It is important to note that some of these
configurations may be considered unacceptable by some operating agencies from a traffic
safety point of view. The safety aspect of signalized intersections cannot be ignored, and
the provision in this chapter of a capacity and LOS analysis methodology for a specific
operational configuration does not imply an endorsement of the suitability for application
of such a configuration.
EXHIBIT 16-1. SIGNALIZED INTERSECTION METHODOLOGY
Input Parameters
- Geometric
- Traffic
- Signal
Lane Grouping and Demand
Flow Rate
- Lane grouping
- PHF
- RTOR
Saturation Flow Rate
- Basic equation
- Adjustment factors
Capacity and v/c
- Capacity
- v/c
Performance Measures
- Delay
- Progression adjustment
- LOS
- Back of queue
LOS criteria
LOS
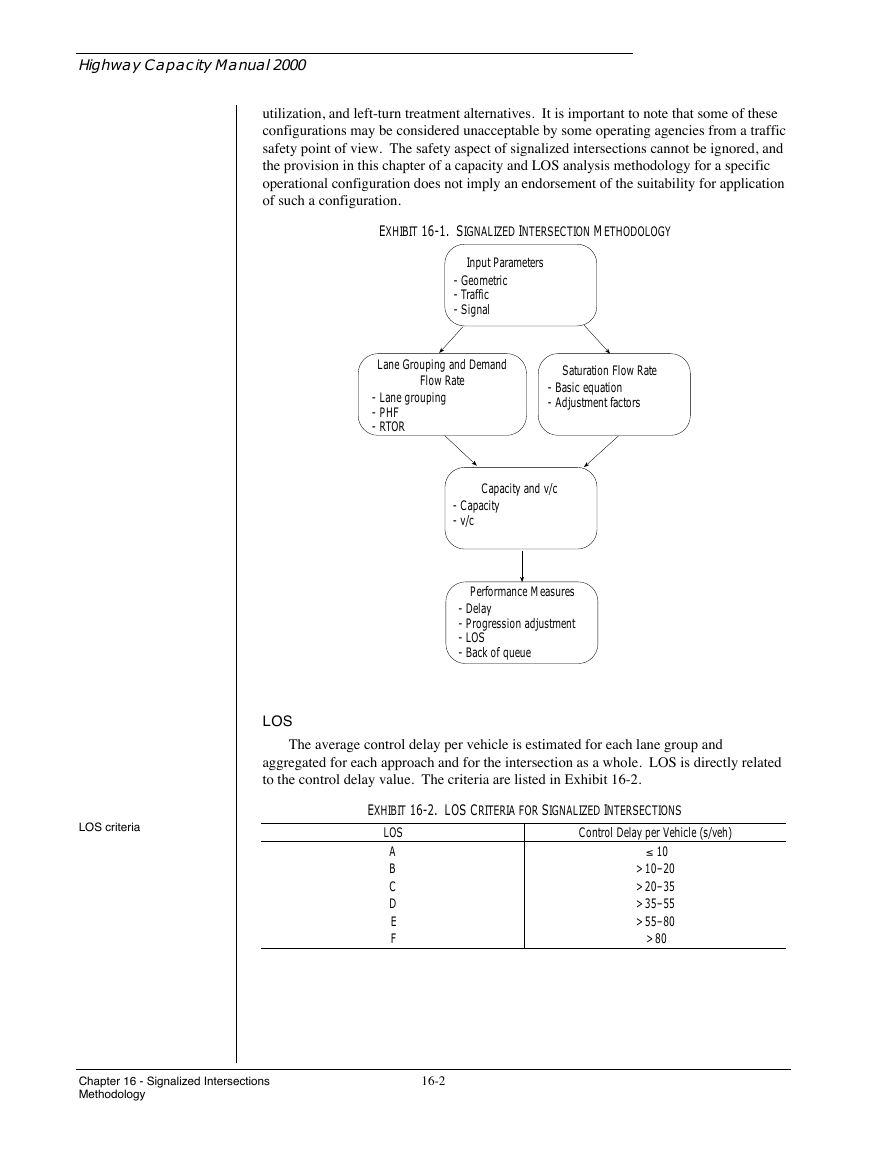
The average control delay per vehicle is estimated for each lane group and
aggregated for each approach and for the intersection as a whole. LOS is directly related
to the control delay value. The criteria are listed in Exhibit 16-2.
EXHIBIT 16-2. LOS CRITERIA FOR SIGNALIZED INTERSECTIONS
LOS
A
B
C
D
E
F
Control Delay per Vehicle (s/veh)
≤ 10
> 10–20
> 20–35
> 35–55
> 55–80
> 80
Chapter 16 - Signalized Intersections
Methodology
16-2
�
Highway Capacity Manual 2000
INPUT PARAMETERS
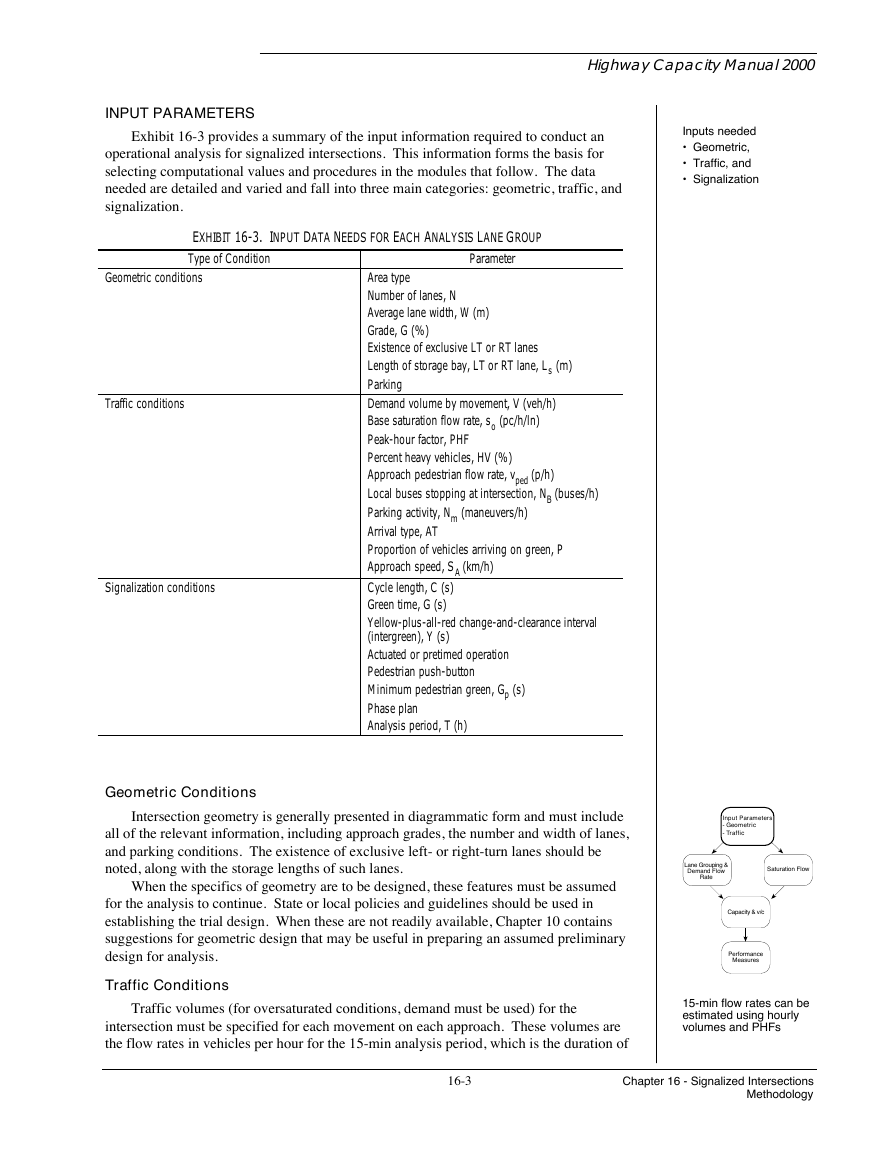
Exhibit 16-3 provides a summary of the input information required to conduct an
operational analysis for signalized intersections. This information forms the basis for
selecting computational values and procedures in the modules that follow. The data
needed are detailed and varied and fall into three main categories: geometric, traffic, and
signalization.
Inputs needed
Geometric,
Traffic, and
Signalization
EXHIBIT 16-3. INPUT DATA NEEDS FOR EACH ANALYSIS LANE GROUP
Type of Condition
Parameter
Geometric conditions
Traffic conditions
Signalization conditions
Area type
Number of lanes, N
Average lane width, W (m)
Grade, G (%)
Existence of exclusive LT or RT lanes
Length of storage bay, LT or RT lane, Ls (m)
Parking
Demand volume by movement, V (veh/h)
Base saturation flow rate, so (pc/h/ln)
Peak-hour factor, PHF
Percent heavy vehicles, HV (%)
Approach pedestrian flow rate, vped (p/h)
Local buses stopping at intersection, NB (buses/h)
Parking activity, Nm (maneuvers/h)
Arrival type, AT
Proportion of vehicles arriving on green, P
Approach speed, SA (km/h)
Cycle length, C (s)
Green time, G (s)
Yellow-plus-all-red change-and-clearance interval
(intergreen), Y (s)
Actuated or pretimed operation
Pedestrian push-button
Minimum pedestrian green, Gp (s)
Phase plan
Analysis period, T (h)
Geometric Conditions
Intersection geometry is generally presented in diagrammatic form and must include
all of the relevant information, including approach grades, the number and width of lanes,
and parking conditions. The existence of exclusive left- or right-turn lanes should be
noted, along with the storage lengths of such lanes.
When the specifics of geometry are to be designed, these features must be assumed
for the analysis to continue. State or local policies and guidelines should be used in
establishing the trial design. When these are not readily available, Chapter 10 contains
suggestions for geometric design that may be useful in preparing an assumed preliminary
design for analysis.
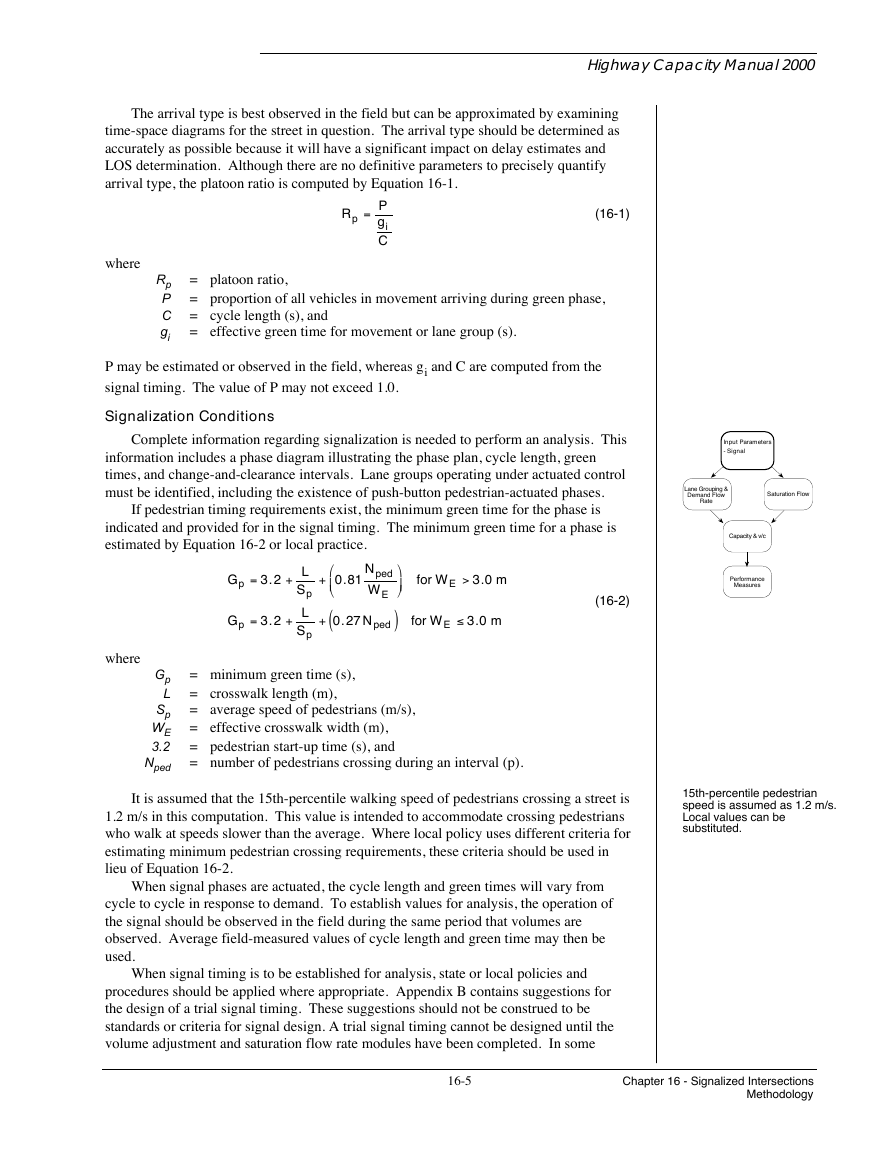
Input Parameters
- Geometric
- Traffic
Lane Grouping &
Demand Flow
Rate
Saturation Flow
Capacity & v/c
Performance
Measures
Traffic Conditions
Traffic volumes (for oversaturated conditions, demand must be used) for the
intersection must be specified for each movement on each approach. These volumes are
the flow rates in vehicles per hour for the 15-min analysis period, which is the duration of
15-min flow rates can be
estimated using hourly
volumes and PHFs
16-3
Chapter 16 - Signalized Intersections
Methodology
�
Highway Capacity Manual 2000
Study the entire period
during which volumes
approach and exceed
capacity
Heavy vehicles are those
having more than four
tires on the pavement
the typical analysis period (T = 0.25). If the 15-min data are not known, they may be
estimated using hourly volumes and peak-hour factors (PHFs). In situations where the
v/c is greater than about 0.9, control delay is significantly affected by the length of the
analysis period. In these cases, if the 15-min flow rate remains relatively constant for
more than 15 min, the length of time the flow is constant should be used as the analysis
period, T, in hours.
If v/c exceeds 1.0 during the analysis period, the length of the analysis period should
be extended to cover the period of oversaturation in the same fashion, as long as the
average flow during that period is relatively constant. If the resulting analysis period is
longer than 15 min and different flow rates can be identified during equal-length
subperiods within the longer analysis period, a multiple-period analysis using the
procedures in Appendix F should be performed using each of these subperiods
individually. The length of the subperiods would normally be, but not be limited to, 15
min each.
Vehicle type distribution is quantified as the percent of heavy vehicles (% HV) in
each movement, where heavy vehicles are defined as those with more than four tires
touching the pavement. The number of local buses on each approach should also be
identified, including only those buses making stops to pick up or discharge passengers at
the intersection (on either the approach or departure side). Buses not making such stops
are considered to be heavy vehicles.
Pedestrian and bicycle flows that interfere with permitted right or left turns are
needed. The pedestrian and bicycle flows used to analyze a given approach are the flows
in the crosswalk interfering with right turns from the approach. For example, for a
westbound approach, the pedestrian and bicycle flows in the north crosswalk would be
used for the analysis.
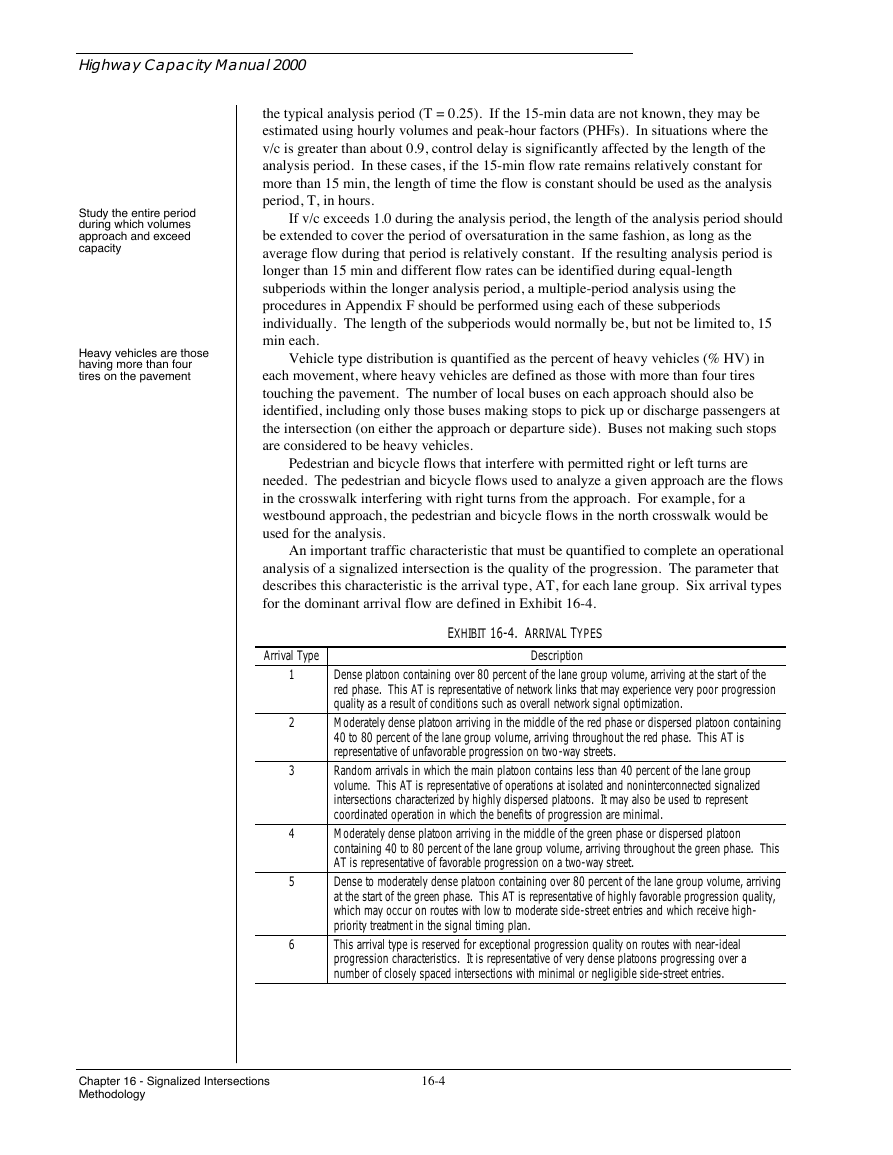
An important traffic characteristic that must be quantified to complete an operational
analysis of a signalized intersection is the quality of the progression. The parameter that
describes this characteristic is the arrival type, AT, for each lane group. Six arrival types
for the dominant arrival flow are defined in Exhibit 16-4.
Arrival Type
EXHIBIT 16-4. ARRIVAL TYPES
Description
1
2
3
4
5
6
Dense platoon containing over 80 percent of the lane group volume, arriving at the start of the
red phase. This AT is representative of network links that may experience very poor progression
quality as a result of conditions such as overall network signal optimization.
Moderately dense platoon arriving in the middle of the red phase or dispersed platoon containing
40 to 80 percent of the lane group volume, arriving throughout the red phase. This AT is
representative of unfavorable progression on two-way streets.
Random arrivals in which the main platoon contains less than 40 percent of the lane group
volume. This AT is representative of operations at isolated and noninterconnected signalized
intersections characterized by highly dispersed platoons. It may also be used to represent
coordinated operation in which the benefits of progression are minimal.
Moderately dense platoon arriving in the middle of the green phase or dispersed platoon
containing 40 to 80 percent of the lane group volume, arriving throughout the green phase. This
AT is representative of favorable progression on a two-way street.
Dense to moderately dense platoon containing over 80 percent of the lane group volume, arriving
at the start of the green phase. This AT is representative of highly favorable progression quality,
which may occur on routes with low to moderate side-street entries and which receive high-
priority treatment in the signal timing plan.
This arrival type is reserved for exceptional progression quality on routes with near-ideal
progression characteristics. It is representative of very dense platoons progressing over a
number of closely spaced intersections with minimal or negligible side-street entries.
Chapter 16 - Signalized Intersections
Methodology
16-4
�
Highway Capacity Manual 2000
The arrival type is best observed in the field but can be approximated by examining
time-space diagrams for the street in question. The arrival type should be determined as
accurately as possible because it will have a significant impact on delay estimates and
LOS determination. Although there are no definitive parameters to precisely quantify
arrival type, the platoon ratio is computed by Equation 16-1.
Rp = P
gi
C
(16-1)
where
= platoon ratio,
= proportion of all vehicles in movement arriving during green phase,
Rp
P
C = cycle length (s), and
gi
= effective green time for movement or lane group (s).
P may be estimated or observed in the field, whereas gi and C are computed from the
signal timing. The value of P may not exceed 1.0.
Signalization Conditions
Complete information regarding signalization is needed to perform an analysis. This
information includes a phase diagram illustrating the phase plan, cycle length, green
times, and change-and-clearance intervals. Lane groups operating under actuated control
must be identified, including the existence of push-button pedestrian-actuated phases.
If pedestrian timing requirements exist, the minimum green time for the phase is
indicated and provided for in the signal timing. The minimum green time for a phase is
estimated by Equation 16-2 or local practice.
Gp = 3.2 + L
Sp
Gp = 3.2 + L
Sp
N ped
+ 0.81
W E
(
+ 0.27 N ped
)
for W E > 3.0 m
for W E ≤ 3.0 m
(16-2)
where
Gp
L
Sp
WE
3.2
Nped
= minimum green time (s),
= crosswalk length (m),
= average speed of pedestrians (m/s),
= effective crosswalk width (m),
= pedestrian start-up time (s), and
= number of pedestrians crossing during an interval (p).
It is assumed that the 15th-percentile walking speed of pedestrians crossing a street is
1.2 m/s in this computation. This value is intended to accommodate crossing pedestrians
who walk at speeds slower than the average. Where local policy uses different criteria for
estimating minimum pedestrian crossing requirements, these criteria should be used in
lieu of Equation 16-2.
When signal phases are actuated, the cycle length and green times will vary from
cycle to cycle in response to demand. To establish values for analysis, the operation of
the signal should be observed in the field during the same period that volumes are
observed. Average field-measured values of cycle length and green time may then be
used.
When signal timing is to be established for analysis, state or local policies and
procedures should be applied where appropriate. Appendix B contains suggestions for
the design of a trial signal timing. These suggestions should not be construed to be
standards or criteria for signal design. A trial signal timing cannot be designed until the
volume adjustment and saturation flow rate modules have been completed. In some
Input Parameters
- Signal
Lane Grouping &
Demand Flow
Rate
Saturation Flow
Capacity & v/c
Performance
Measures
15th-percentile pedestrian
speed is assumed as 1.2 m/s.
Local values can be
substituted.
16-5
Chapter 16 - Signalized Intersections
Methodology
�
Highway Capacity Manual 2000
Appendix B contains
procedure for estimating
average cycle lengths
under actuated control
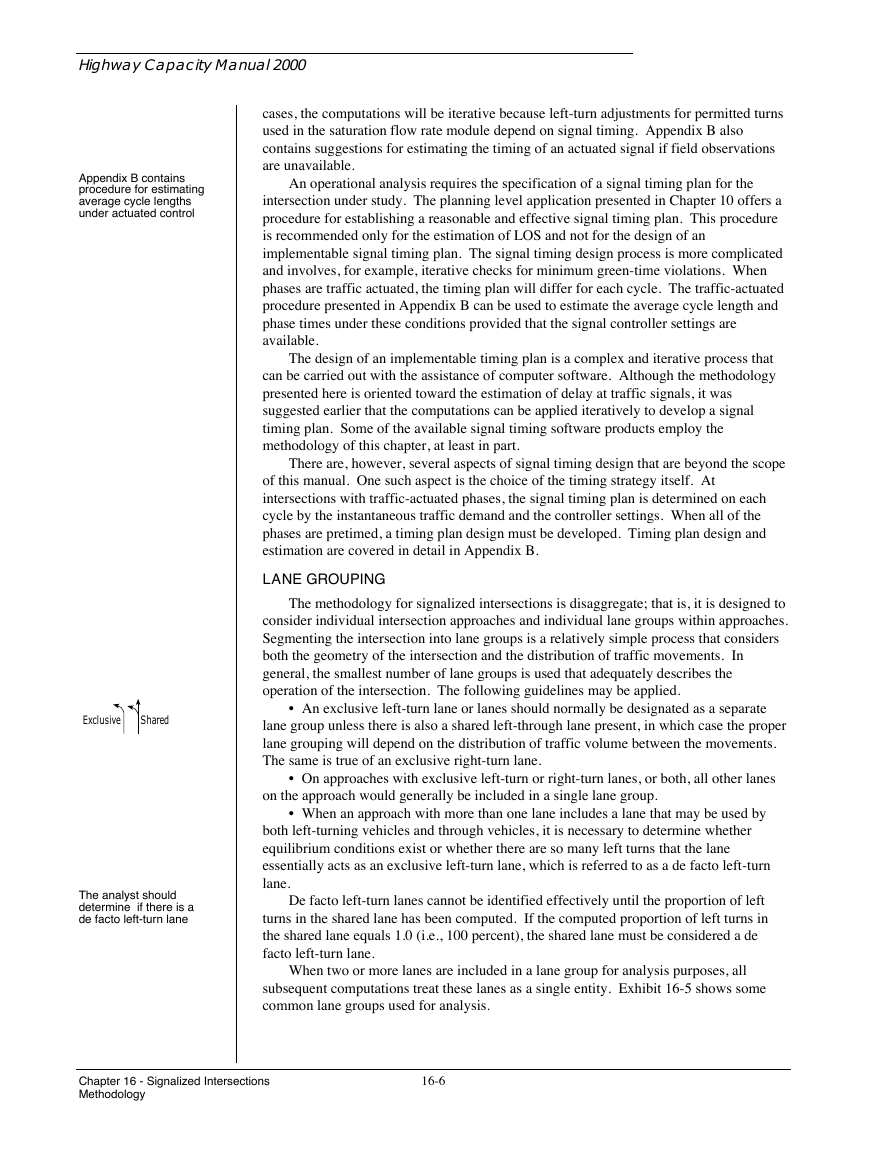
Exclusive
Shared
The analyst should
determine if there is a
de facto left-turn lane
cases, the computations will be iterative because left-turn adjustments for permitted turns
used in the saturation flow rate module depend on signal timing. Appendix B also
contains suggestions for estimating the timing of an actuated signal if field observations
are unavailable.
An operational analysis requires the specification of a signal timing plan for the
intersection under study. The planning level application presented in Chapter 10 offers a
procedure for establishing a reasonable and effective signal timing plan. This procedure
is recommended only for the estimation of LOS and not for the design of an
implementable signal timing plan. The signal timing design process is more complicated
and involves, for example, iterative checks for minimum green-time violations. When
phases are traffic actuated, the timing plan will differ for each cycle. The traffic-actuated
procedure presented in Appendix B can be used to estimate the average cycle length and
phase times under these conditions provided that the signal controller settings are
available.
The design of an implementable timing plan is a complex and iterative process that
can be carried out with the assistance of computer software. Although the methodology
presented here is oriented toward the estimation of delay at traffic signals, it was
suggested earlier that the computations can be applied iteratively to develop a signal
timing plan. Some of the available signal timing software products employ the
methodology of this chapter, at least in part.
There are, however, several aspects of signal timing design that are beyond the scope
of this manual. One such aspect is the choice of the timing strategy itself. At
intersections with traffic-actuated phases, the signal timing plan is determined on each
cycle by the instantaneous traffic demand and the controller settings. When all of the
phases are pretimed, a timing plan design must be developed. Timing plan design and
estimation are covered in detail in Appendix B.
LANE GROUPING
The methodology for signalized intersections is disaggregate; that is, it is designed to
consider individual intersection approaches and individual lane groups within approaches.
Segmenting the intersection into lane groups is a relatively simple process that considers
both the geometry of the intersection and the distribution of traffic movements. In
general, the smallest number of lane groups is used that adequately describes the
operation of the intersection. The following guidelines may be applied.
An exclusive left-turn lane or lanes should normally be designated as a separate
lane group unless there is also a shared left-through lane present, in which case the proper
lane grouping will depend on the distribution of traffic volume between the movements.
The same is true of an exclusive right-turn lane.
On approaches with exclusive left-turn or right-turn lanes, or both, all other lanes
on the approach would generally be included in a single lane group.
When an approach with more than one lane includes a lane that may be used by
both left-turning vehicles and through vehicles, it is necessary to determine whether
equilibrium conditions exist or whether there are so many left turns that the lane
essentially acts as an exclusive left-turn lane, which is referred to as a de facto left-turn
lane.
De facto left-turn lanes cannot be identified effectively until the proportion of left
turns in the shared lane has been computed. If the computed proportion of left turns in
the shared lane equals 1.0 (i.e., 100 percent), the shared lane must be considered a de
facto left-turn lane.
When two or more lanes are included in a lane group for analysis purposes, all
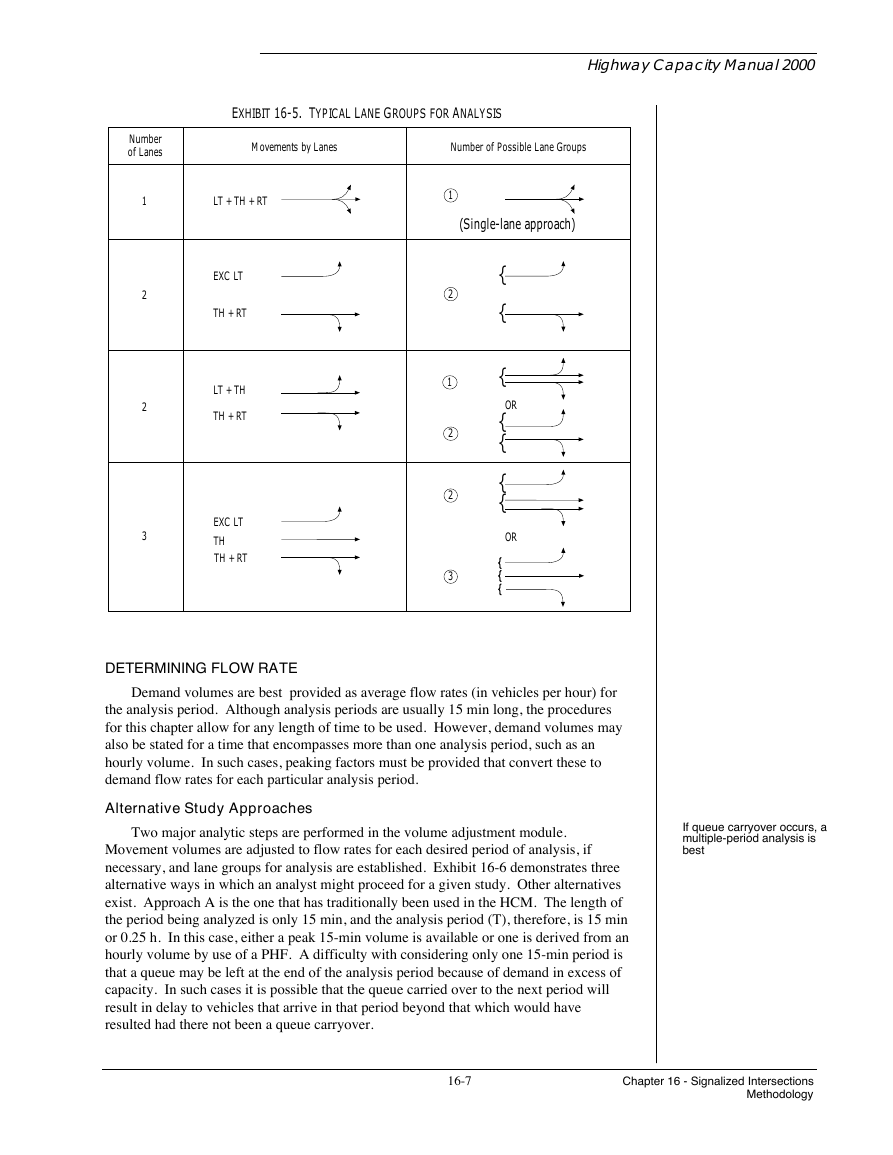
subsequent computations treat these lanes as a single entity. Exhibit 16-5 shows some
common lane groups used for analysis.
Chapter 16 - Signalized Intersections
Methodology
16-6
�
EXHIBIT 16-5. TYPICAL LANE GROUPS FOR ANALYSIS
Number
of Lanes
Movements by Lanes
Number of Possible Lane Groups
Highway Capacity Manual 2000
1
2
2
3
LT + TH + RT
EXC LT
TH + RT
LT + TH
TH + RT
EXC LT
TH
TH + RT
(Single-lane approach)
{
{
{
OR
{
{
{
{
OR
1
2
1
2
2
3
DETERMINING FLOW RATE
Demand volumes are best provided as average flow rates (in vehicles per hour) for
the analysis period. Although analysis periods are usually 15 min long, the procedures
for this chapter allow for any length of time to be used. However, demand volumes may
also be stated for a time that encompasses more than one analysis period, such as an
hourly volume. In such cases, peaking factors must be provided that convert these to
demand flow rates for each particular analysis period.
Alternative Study Approaches
Two major analytic steps are performed in the volume adjustment module.
Movement volumes are adjusted to flow rates for each desired period of analysis, if
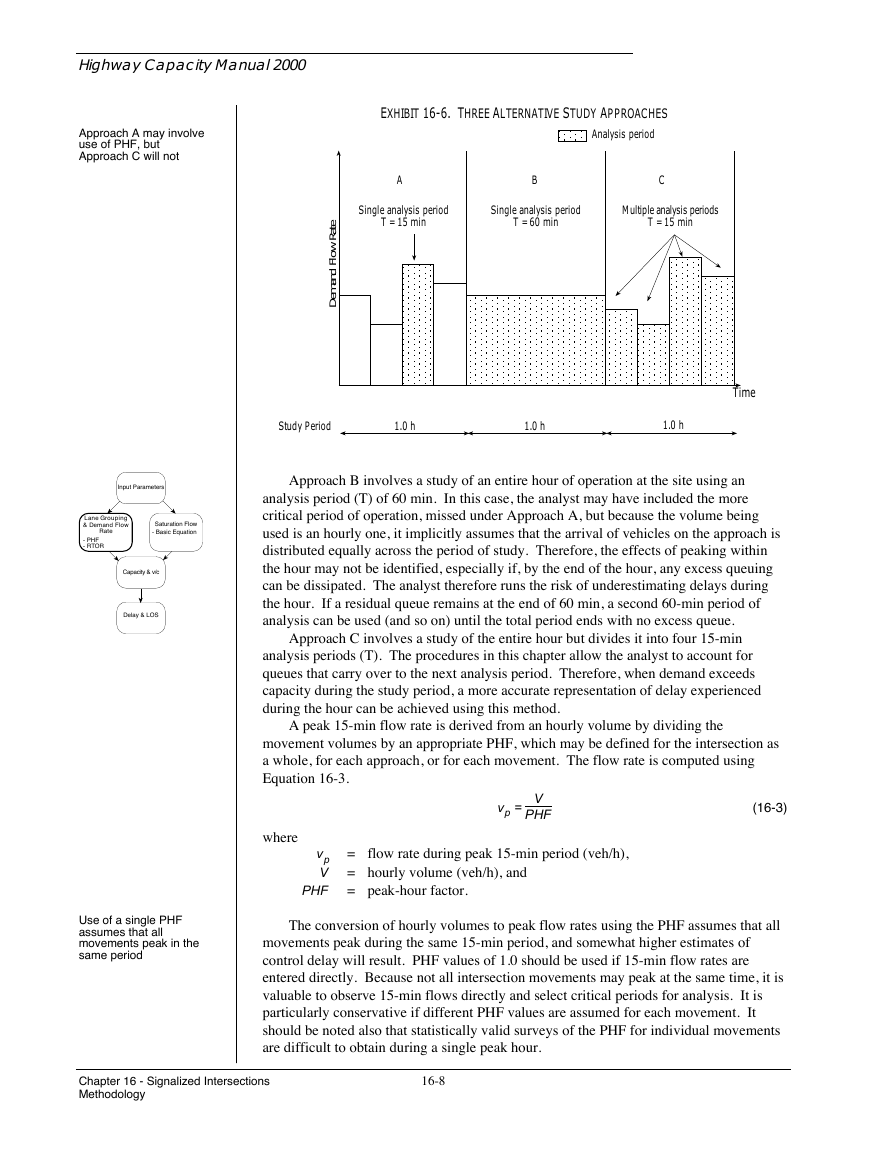
necessary, and lane groups for analysis are established. Exhibit 16-6 demonstrates three
alternative ways in which an analyst might proceed for a given study. Other alternatives
exist. Approach A is the one that has traditionally been used in the HCM. The length of
the period being analyzed is only 15 min, and the analysis period (T), therefore, is 15 min
or 0.25 h. In this case, either a peak 15-min volume is available or one is derived from an
hourly volume by use of a PHF. A difficulty with considering only one 15-min period is
that a queue may be left at the end of the analysis period because of demand in excess of
capacity. In such cases it is possible that the queue carried over to the next period will
result in delay to vehicles that arrive in that period beyond that which would have
resulted had there not been a queue carryover.
If queue carryover occurs, a
multiple-period analysis is
best
16-7
Chapter 16 - Signalized Intersections
Methodology
�
Highway Capacity Manual 2000
Approach A may involve
use of PHF, but
Approach C will not
EXHIBIT 16-6. THREE ALTERNATIVE STUDY APPROACHES
Analysis period
A
B
C
Single analysis period
T = 15 min
Single analysis period
T = 60 min
Multiple analysis periods
T = 15 min
l
e
t
a
R
w
o
F
d
n
a
m
e
D
Input Parameters
Lane Grouping
& Demand Flow
Rate
- PHF
- RTOR
Saturation Flow
- Basic Equation
Capacity & v/c
Delay & LOS
Study Period
1.0 h
1.0 h
1.0 h
Time
Approach B involves a study of an entire hour of operation at the site using an
analysis period (T) of 60 min. In this case, the analyst may have included the more
critical period of operation, missed under Approach A, but because the volume being
used is an hourly one, it implicitly assumes that the arrival of vehicles on the approach is
distributed equally across the period of study. Therefore, the effects of peaking within
the hour may not be identified, especially if, by the end of the hour, any excess queuing
can be dissipated. The analyst therefore runs the risk of underestimating delays during
the hour. If a residual queue remains at the end of 60 min, a second 60-min period of
analysis can be used (and so on) until the total period ends with no excess queue.
Approach C involves a study of the entire hour but divides it into four 15-min
analysis periods (T). The procedures in this chapter allow the analyst to account for
queues that carry over to the next analysis period. Therefore, when demand exceeds
capacity during the study period, a more accurate representation of delay experienced
during the hour can be achieved using this method.
A peak 15-min flow rate is derived from an hourly volume by dividing the
movement volumes by an appropriate PHF, which may be defined for the intersection as
a whole, for each approach, or for each movement. The flow rate is computed using
Equation 16-3.
V
vp =
PHF
(16-3)
Use of a single PHF
assumes that all
movements peak in the
same period
where
vp
V
PHF
= flow rate during peak 15-min period (veh/h),
= hourly volume (veh/h), and
= peak-hour factor.
The conversion of hourly volumes to peak flow rates using the PHF assumes that all
movements peak during the same 15-min period, and somewhat higher estimates of
control delay will result. PHF values of 1.0 should be used if 15-min flow rates are
entered directly. Because not all intersection movements may peak at the same time, it is
valuable to observe 15-min flows directly and select critical periods for analysis. It is
particularly conservative if different PHF values are assumed for each movement. It
should be noted also that statistically valid surveys of the PHF for individual movements
are difficult to obtain during a single peak hour.
Chapter 16 - Signalized Intersections
Methodology
16-8
�


 2023年江西萍乡中考道德与法治真题及答案.doc
 2012年重庆南川中考生物真题及答案.doc
 2013年江西师范大学地理学综合及文艺理论基础考研真题.doc
 2020年四川甘孜小升初语文真题及答案I卷.doc
 2020年注册岩土工程师专业基础考试真题及答案.doc
 2023-2024学年福建省厦门市九年级上学期数学月考试题及答案.doc
 2021-2022学年辽宁省沈阳市大东区九年级上学期语文期末试题及答案.doc
 2022-2023学年北京东城区初三第一学期物理期末试卷及答案.doc
 2018上半年江西教师资格初中地理学科知识与教学能力真题及答案.doc
 2012年河北国家公务员申论考试真题及答案-省级.doc
 2020-2021学年江苏省扬州市江都区邵樊片九年级上学期数学第一次质量检测试题及答案.doc
 2022下半年黑龙江教师资格证中学综合素质真题及答案.doc